Center Pivot Irrigation Systems Market by Crop Type (Cereals and Oilseeds & Pulses), Field Size (Small, Medium, Large), Mobility (Stationary and Mobile), Component (Span, Pivot Points, Drive Train, Control Panel, Sprinkler Drop) - Global Forecast to 2021


The center pivot irrigation systems market is estimated to be valued at USD 941.0 Million in 2015. It is projected to grow at a CAGR of 14.9% from 2016 to 2021, to reach 1,734.4 Million by 2021. The base year considered for the study is 2015 and the forecast years are from 2016 to 2021.
Objectives of the Report
- To define, segment, and project the global market size for center pivot irrigation systems on the basis of crop type, field size, components, mobility, and region
- To provide detailed information about the key factors influencing the growth of the market (drivers, restraints, opportunities, and challenges)
- To analyze the opportunities in the market for stakeholders and provide a competitive landscape of market trends
- To strategically analyze micromarkets with respect to individual growth trends, future prospects, and their contribution to the total market.
- To project the size of the center pivot irrigation systems market and its submarkets, in terms of value
- To strategically profile key players and comprehensively analyze their core competencies
- To analyze competitive developments such as expansions, acquisitions, agreements, and new product launches in the center pivot irrigation market
- To provide a detailed competitive landscape of this market, along with an analysis of the business and corporate strategies adopted by key players
This report includes estimations of market sizes for value (USD million). Both, top-down and bottom-up approaches have been used to estimate and validate the size of the global center pivot irrigation systems market and to estimate the size of various other dependent submarkets in the overall market. This research study involved the usage of extensive secondary sources such as press releases, paid databases such as Factiva and Bloomberg, annual reports, and financial journals in collating the required information and to analyze the market.
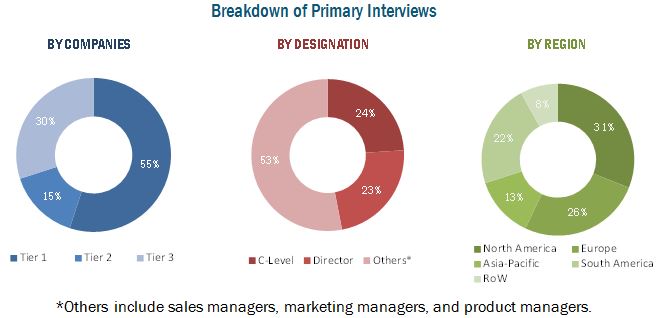
All percentage shares, splits, and breakdowns have been determined using secondary sources and were verified through primary sources. Several primary interviews were conducted with market experts from the demand (farmers/crop producers, government, and infrastructure developers) and supply side (raw material suppliers, manufacturers, and exporters) across four major regions. The figure below shows the breakdown of profiles of industry experts who participated in the primary discussions.
To know about the assumptions considered for the study, download the pdf brochure
Key participants in the supply chain of center pivot irrigation systems are raw material suppliers, center pivot irrigation systems manufacturers, distributors, and end users such as government, farmers/crop producers, and researchers. The major key players that are profiled in the report include Lindsay Corporation (U.S.), Valmont Industries, Incorporated (U.S.), T-L Irrigation Company (U.S.), Alkhorayef Group (Saudi Arabia), Reinke Manufacturing Company, Incorporated (U.S.), Rainfine (Dalian) Irrigation Company, Limited (China), Bauer GmbH, Roehren- und-Pumpenwork (Austria), and Grupo Fockink (Brazil).
This report is targeted at the existing players in the industry, which include
- Agricultural producers
- Distributors of center pivot irrigation systems
- Manufacturers of center pivot irrigation systems
- Government organization and agencies
�The study answers several questions for stakeholders, primarily which market segments to focus on in the next two to five years for prioritizing efforts and investments.�
Scope of the Report
On the basis of Field Size, the market is segmented as follows:
- Small field (up to 3 hectares)
- Medium field (3 hectares to 25 hectares)
- Large field (more than 25 hectares)
On the basis of Crop Type, the market is segmented as follows:
- Cereals
- Oilseeds and pulses
- Others
On the basis of Mobility, the market is segmented as follows:
- Stationary
- Mobile
On the basis of Components, the market is segmented as follows:
- Pivot points
- Control panels
- Span
- Sprinkler drop
- Tower drive wheels
- Drive train
On the basis of Region, the market is segmented as follows:
- North America
- Europe
- Asia-Pacific
- South America
- RoW
Available Customizations
With the given market data, MarketsandMarkets offers customizations according to the client-specific needs.
The following customization options are available for the report:
Regional Analysis
- Further country-specific data and its regulations
Company Information
- Detailed analysis and profiling of additional market players (up to five)
The center pivot irrigation systems market is projected to grow at a CAGR of 14.9% from 2016 to 2021, to reach a projected value of USD 1,734.4 Million by 2021. Center pivot irrigation systems are gaining significance because unirrigated lands are being converted into mechanized irrigation, shrinking arable land, and higher production as compared to rain-fed crops.
The global center pivot irrigation systems market is led by the cereal crops segment, followed by the oilseeds & pulses segment. Rapid growth in the demand for cereal crops from increasing population and use of cereals in animal feed and biofuels are driving the application of center pivot irrigation systems in cereal crops. Higher yield requirement from limited area has also led to the growth in its application.
Among the field type on which center pivot irrigation systems are employed, the large field segment accounted for the largest market share in 2015. Center pivot irrigation is widely used in large fields because of the high returns of investment and reduction in per acre cost. Stationary center pivot irrigation systems have a larger market share as compared to mobile systems, since in large fields, the use of stationary systems is more feasible.
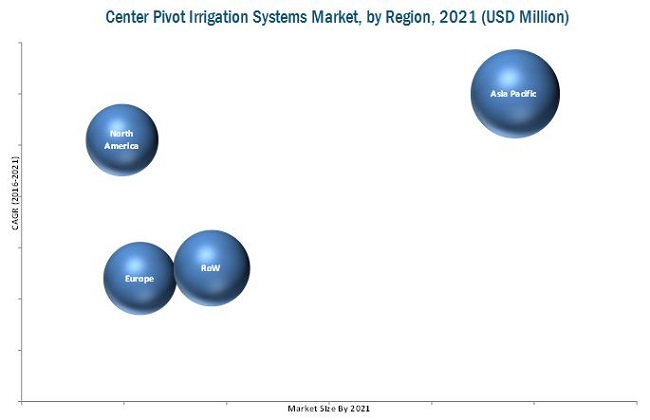
North America accounted for the largest market share for center pivot irrigation systems, U.S. being the fastest growing and having the largest market share in this region from 2016 to 2021. There is shifting of cropland to larger farms as better financial returns are realized through larger crop farms. Europe is projected to be the second-largest market for the period considered for this study. The Rest of World (RoW) region is projected to grow at the highest CAGR between the forecast period 2016�2021. The development of corporate farming in African and Middle Eastern countries is a major market driver in these regions.
High investment required at the time of installation of center pivot irrigation systems is one of the restraints for the center pivot irrigation systems market. The continuous maintenance requirement is also hindering the growth of this market.
Valmont Industries is a pioneer in the field of center pivot irrigation systems. A major strategy of the company has been new product launches for addressing the needs of the growers and modernizing irrigation techniques. Valmont has strategically entered into a number of agreements and partnerships that has helped the company to reach a greater number of users and improve its product offerings. It is strategically acquiring companies in the same industry and constantly launching new products to stay ahead of its competitors. For instance, Valmont acquired AgSense (U.S.) which would aid in expanding its offerings in remote monitoring and control technology for agriculture.
To speak to our analyst for a discussion on the above findings, click Speak to Analyst
 Exclusive indicates content/data unique to MarketsandMarkets and not available with any competitors.
Table of Contents
1 Introduction (Page No. - 14)
1.1 Objectives of the Study
1.2 Market Definition
1.3 Study Scope
1.3.1 Markets Covered
1.3.2 Periodization
1.4 Units
1.5 Stakeholders
1.6 Limitations
2 Research Methodology (Page No. - 17)
2.1 Research Data
2.1.1 Secondary Data
2.1.1.1 Key Data From Secondary Sources
2.1.2 Primary Data
2.1.2.1 Key Data From Primary Sources
2.1.2.2 Key Industry Insights
2.1.2.3 Breakdown of Primary Interviews
2.2 Macroeconomic Factor Analysis
2.2.1 Introduction
2.3 Reduction in Arable Land
2.4 Increase in Area Equipped for Irrigation
2.5 Increase in Demand for Food
2.6 Global Fresh Water Shortage and Preference for Conservation
2.7 Market Size Estimation
2.7.1 Bottom-Up Approach
2.7.2 Top-Down Approach
2.8 Market Breakdown & Data Triangulation
2.9 Research Assumptions & Limitation
2.9.1 Assumptions
2.9.2 Limitations
3 Executive Summary (Page No. - 31)
4 Premium Insights (Page No. - 36)
4.1 Attractive Opportunities in the Center Pivot Irrigation Systems Market
4.2 Center Pivot Irrigation Systems Market, By Field Size
4.3 Market in North America
4.4 Market by Major Countries
4.5 Market By Crop Type and Region
4.6 Market : Life Cycle Analysis, By Region
5 Market Overview (Page No. - 41)
5.1 Introduction
5.2 Evolution
5.3 Market Segmentation
5.3.1 Crop Type
5.3.2 Field Size
5.3.3 Component
5.3.4 Mobility
5.3.5 Region
5.4 Market Dynamics
5.4.1 Drivers
5.4.1.1 Need for Higher Yield and Better Quality Crops
5.4.1.2 Efficiency in Usage of Water Resources in Case of Drought
5.4.1.3 High Return on Investment as Compared to Alternatives
5.4.1.4 Technological Advancements in Center Pivot Irrigation Systems
5.4.2 Restraints
5.4.2.1 High Initial Investment
5.4.2.2 Continuous Maintenance Requirement
5.4.2.3 Depressed Commodity Prices and Lower Farm Incomes
5.4.2.4 Unfavorable Currency Exchange Rates
5.4.3 Opportunities
5.4.3.1 Conversion of Unirrigated Lands to Mechanized Irrigation
5.4.3.2 Shift From Flood Irrigation to Center Pivot Systems
5.4.3.3 Strong Growth Potential in New and Emerging Markets
5.4.3.4 Increasing Demand for Biofuels
5.4.4 Challenges
5.4.4.1 Lower Demand From Labor-Intensive Economies
5.4.4.2 Lack of Subsidies for Center Pivot Irrigation
6 Industry Trends (Page No. - 54)
6.1 Introduction
6.2 Value Chain Analysis
6.3 Supply Chain Analysis
6.3.1 Prominent Companies
6.3.2 Small & Medium Enterprises
6.3.3 End Users
6.4 Porter�s Five Forces Analysis
6.4.1 Threat of New Entrants
6.4.2 Threat of Substitutes
6.4.3 Bargaining Power of Buyers
6.4.4 Bargaining Power of Suppliers
6.4.5 Intensity of Competitive Rivalry
7 Center Pivot Irrigation Systems Market, By Crop Type (Page No. - 61)
7.1 Introduction
7.2 Cereals
7.2.1 Corn
7.3 Oilseeds & Pulses
7.3.1 Soybean
7.4 Others
8 Center Pivot Irrigation Systems Market, By Field Size (Page No. - 70)
8.1 Introduction
8.2 Small Fields
8.3 Medium Fields
8.4 Large Fields
9 Center Pivot Irrigation Systems Market, By Mobility (Page No. - 76)
9.1 Introduction
9.2 Stationary
9.3 Mobile
10 Center Pivot Irrigation Systems Market, By Component (Page No. - 81)
10.1 Introduction
10.2 Spans
10.3 Pivot Points
10.4 Drive Trains
10.5 Control Panels
10.6 Sprinkler Drops
10.7 Others
11 Center Pivot Irrigation Systems Market, By Region (Page No. - 85)
11.1 Introduction
11.2 North America
11.2.1 U.S.
11.2.2 Canada
11.2.3 Mexico
11.3 Europe
11.3.1 Russia
11.3.2 France
11.3.3 Italy
11.3.4 Germany
11.3.5 Ukraine
11.3.6 U.K.
11.3.7 Rest of Europe
11.4 Asia-Pacific
11.4.1 China
11.4.2 Australia
11.4.3 Japan
11.4.4 India
11.4.5 Rest of Asia-Pacific
11.5 South America
11.5.1 Brazil
11.5.2 Argentina
11.5.3 Rest of South America
11.6 Rest of the World (RoW)
11.6.1 South Africa
11.6.2 Saudi Arabia
11.6.3 Egypt
11.6.4 Others in RoW
12 Competitive Landscape (Page No. - 121)
12.1 Overview
12.2 Competitive Situations & Trends
12.2.1 New Product Launches & Developments
12.2.2 Expansions
12.2.3 Agreements & Partnerships
12.2.4 Acquisitions
13 Company Profiles (Page No. - 128)
(Company at A Glance, Business Overview, Products Offered, Key Strategy, Recent Developments, SWOT Analysis & MnM View)*
13.1 Introduction
13.2 Lindsay Corporation
13.3 Valmont Industries, Inc.
13.4 T-L Irrigation Company
13.5 Alkhorayef Group
13.6 Reinke Manufacturing Company, Inc.
13.7 Vodar (Tianjin) Co., Ltd
13.8 Pierce Corporation
13.9 Rainfine (Dalian) Irrigation Co., Ltd.
13.10 Bauer GmbH, RoEhren- Und Pumpenwerk
13.11 Grupo Fockink
*Details on Company at A Glance, Recent Financials, Products Offered, Strategies & Insights, & Recent Developments Might Not Be Captured in Case of Unlisted Companies.
14 Appendix (Page No. - 148)
14.1 Insights of Industry Experts
14.2 Discussion Guide
14.3 Knowledge Store: Marketsandmarkets� Subscription Portal
14.4 Introducing RT: Real-Time Market Intelligence
14.5 Available Customizations
14.6 Related Reports
List of Tables (70 Tables)
Table 1 Comparison of Irrigation System Costs for 125 Acre/50 Ha System
Table 2 Comparison of Return on Investment From Different Irrigation Systems for A Field Size of 50.6 Hectares/125 Acres
Table 3 Capital Requirements: Pivot vs Flood Irrigation Systems
Table 4 Comparison of Costs Between Pivot & Flood Operations
Table 5 Comparison of Center Pivot Irrigation System With Flood Irrigation
Table 6 Savings With Center Pivot Irrigation System
Table 7 Center Pivot Irrigation Systems Market Size, By Crop Type, 2014�2021 (USD Million)
Table 8 Cereals Market Size, By Type, 2014�2021 (USD Million)
Table 9 Cereals Market Size, By Region, 2014�2021 (USD Million)
Table 10 Corn Market Size, By Region, 2014�2021 (USD Million)
Table 11 Oilseeds & Pulses Market Size, By Type, 2014�2021 (USD Million)
Table 12 Oilseeds & Pulses Market Size, By Region, 2014�2021 (USD Million)
Table 13 Soybean Market Size, By Region, 2014�2021 (USD Million)
Table 14 Other Crops Market Size, By Type, 2014�2021 (USD Million)
Table 15 Other Crops Market Size, By Region, 2014�2021 (USD Million)
Table 16 Center Pivot Irrigation Systems Market Size, By Field Size, 2014�2021 (USD Million)
Table 17 Small Fields Market Size, By Region, 2014�2021 (USD Million)
Table 18 Medium Fields Market Size, By Region, 2014�2021 (USD Million)
Table 19 Large Fields Market Size, By Region, 2014�2021 (USD Million)
Table 20 Center Pivot Irrigation Systems Market Size, By Mobility, 2014�2021 (USD Million)
Table 21 Stationary Center Pivot Irrigation System Market Size, By Region, 2014�2021 (USD Million)
Table 22 Mobile Center Pivot Irrigation Systems Market Size, By Region, 2014�2021 (USD Million)
Table 23 Center Pivot Irrigation System Market Size, By Component, 2014�2021 (USD Million)
Table 24 Center Pivot Irrigation Systems Market Size, By Region, 2014�2021 (USD Million)
Table 25 North America: Center Pivot Irrigation System Market Size, By Country, 2014�2021 (USD Million)
Table 26 North America: Market Size, By Crop Type, 2014�2021 (USD Million)
Table 27 North America: Market Size, By Mobility, 2014�2021 (USD Million)
Table 28 North America: Market Size, By Field Size, 2014�2021 (USD Million)
Table 29 U.S.: Center Pivot Irrigation System Market Size, By Crop Type, 2014�2021 (USD Million)
Table 30 Canada: Center Pivot Irrigation System Market Size, By Crop Type, 2014�2021 (USD Million)
Table 31 Mexico: Center Pivot Irrigation System Market Size, By Crop Type, 2014�2021 (USD Million)
Table 32 Europe: Center Pivot Irrigation System Market Size, By Country, 2014�2021 (USD Million)
Table 33 Europe: Market Size, By Crop Type, 2014�2021 (USD Million)
Table 34 Europe: Market Size, By Mobility, 2014�2021 (USD Million)
Table 35 Europe: Market Size, By Field Size, 2014�2021 (USD Million)
Table 36 Russia: Center Pivot Irrigation Systems Market Size, By Crop Type, 2014�2021 (USD Million)
Table 37 France: Center Pivot Irrigation System Market Size, By Crop Type, 2014�2021 (USD Million)
Table 38 Italy: Center Pivot Irrigation Systems Market Size, By Crop Type, 2014�2021 (USD Million)
Table 39 Germany: Center Pivot Irrigation System Market Size, By Crop Type, 2014�2021 (USD Million)
Table 40 Ukraine: Center Pivot Irrigation System Market Size, By Crop Type, 2014�2021 (USD Million)
Table 41 U.K.: Center Pivot Irrigation System Market Size, By Crop Type, 2014�2021 (USD Million)
Table 42 Rest of Europe: Center Pivot Irrigation Systems Market Size, By Crop Type, 2014�2021 (USD Million)
Table 43 Asia-Pacific: Center Pivot Irrigation Systems Market Size, By Country, 2014�2021 (USD Million)
Table 44 Asia-Pacific: Market Size, By Crop Type, 2014�2021 (USD Million)
Table 45 Asia-Pacific: Market Size, By Mobility, 2014�2021 (USD Million)
Table 46 Asia-Pacific: Market Size, By Field Size, 2014�2021 (USD Million)
Table 47 China: Center Pivot Irrigation System Market Size, By Crop Type, 2014�2021 (USD Million)
Table 48 Australia: Center Pivot Irrigation System Market Size, By Crop Type, 2014�2021 (USD Million)
Table 49 Japan: Center Pivot Irrigation Systems Market Size, By Crop Type, 2014�2021 (USD Million)
Table 50 India: Center Pivot Irrigation System Market Size, By Crop Type, 2014-2021 (USD Million)
Table 51 Rest of Asia-Pacific: Center Pivot Irrigation System Market Size, By Crop Type, 2014�2021 (USD Million)
Table 52 South America: Center Pivot Irrigation System Market Size, By Country, 2014�2021 (USD Million)
Table 53 South America: Market Size, By Crop Type, 2014�2021 (USD Million)
Table 54 South America: Market Size, By Mobility, 2014�2021 (USD Million)
Table 55 South America: Market Size, By Field Size, 2014�2021 (USD Million)
Table 56 Brazil: Center Pivot Irrigation Systems Market Size, By Crop Type, 2014�2021 (USD Million)
Table 57 Argentina: Center Pivot Irrigation System Market Size, By Crop Type, 2014�2021 (USD Million)
Table 58 Rest of South America: Center Pivot Irrigation System Market Size, By Crop Type, 2014�2021 (USD Million)
Table 59 RoW: Center Pivot Irrigation Systems Market Size, By Country, 2014-2021 (USD Million)
Table 60 RoW: Market Size, By Crop Type, 2014-2021 (USD Million)
Table 61 RoW: Market Size, By Mobility, 2014-2021 (USD Million)
Table 62 RoW: Market Size, By Field Size, 2014-2021 (USD Million)
Table 63 South Africa: Center Pivot Irrigation Systems Market Size, By Crop Type, 2014-2021 (USD Million)
Table 64 Saudi Arabia: Market Size, By Crop Type, 2014-2021 (USD Million)
Table 65 Egypt: Center Pivot Irrigation Systems Market Size, By Crop Type, 2014-2021 (USD Million)
Table 66 Others in RoW: Center Pivot Irrigation System Market Size, By Crop Type, 2014-2021 (USD Million)
Table 67 New Product Launches & Developments, 2010�2016
Table 68 Expansions, 2012�2016
Table 69 Agreements & Partnerships, 2011�2016
Table 70 Acquisitions, 2010�2015
List of Figures (58 Figures)
Figure 1 Center Pivot Irrigation Systems Market Segmentation
Figure 2 Research Design
Figure 3 Breakdown of Primary Interviews: By Company Type, Designation and Region
Figure 4 Per Capita Arable Land, 1950�2020
Figure 5 Share of Agricultural Land Under Irrigation, 1961�2011
Figure 6 Population Growth, 1950�2014
Figure 7 Fresh Water Shortage Per Capita (Liters/Day)
Figure 8 Market Size Estimation Methodology: Bottom-Up Approach
Figure 9 Market Size Estimation Methodology: Top-Down Approach
Figure 10 Data Triangulation
Figure 11 Center Pivot Irrigation System Market Segmentation
Figure 12 Center Pivot Irrigation System Market Size, By Field Size, 2016 vs 2021 (USD Million)
Figure 13 Cereals Segment is Estimated to Account for the Largest Market Share in 2016
Figure 14 North America to Be the Largest Market for Center Pivot Irrigation Systems From 2016 to 2021
Figure 15 Key Players Adopted New Product Launches as Their Key Strategy From 2011 to 2016
Figure 16 Developing Countries Offer Attractive Opportunities in the Center Pivot Irrigation Systems Market
Figure 17 The Use of Center Pivot Irrigation Systems on Large Fields to Grow at the Highest Rate
Figure 18 North America Was the Largest Market for Center Pivot Irrigation Systems in 2015
Figure 19 Australia is Projected to Be the Fastest-Growing Country-Level Market for Center Pivot Irrigation Systems From 2016 to 2021
Figure 20 North America Dominated the Center Pivot Irrigation Systems Market in 2015
Figure 21 The Center Pivot Irrigation System Market in South America is Experiencing High Growth
Figure 22 Evolution of Center Pivot Irrigation Systems
Figure 23 Center Pivot Irrigation System Market, By Crop Type
Figure 24 Center Pivot Irrigation System Market, By Field Size
Figure 25 Center Pivot Irrigation System Market, By Component
Figure 26 Center Pivot Irrigation System Market, By Mobility
Figure 27 Center Pivot Irrigation System Market, By Region
Figure 28 Center Pivot Irrigation System: Drivers, Restraints, Opportunities, and Challenges
Figure 29 U.S. Annual Farm Income, 2000�2016 (USD Billion)
Figure 30 Manufacturing Process Contributes Major Value to the Overall Price of Center Pivot Irrigation Systems
Figure 31 Distributors Play A Crucial Role in Supplying Center Pivot Irrigation Systems to Farmers
Figure 32 Porter�s Five Forces Analysis: Center Pivot Irrigation Systems Market
Figure 33 Cereals is Projected to Be the Largest Segment Through 2021 (USD Million)
Figure 34 Cereals Market Size, By Region, 2016 vs 2021
Figure 35 Oilseeds & Pulses Market Size, By Region, 2016 vs 2021
Figure 36 Other Crops Market Size, By Region, 2016 vs 2021
Figure 37 Large Field is Projected to Be the Largest Segment Through 2021
Figure 38 Asia-Pacific to Dominate the Center Pivot Irrigation Systems Market for Small Fields Through 2021
Figure 39 North America is Projected to Be the Largest Market for Center Pivot Irrigation Systems for Medium Fields Through 2021
Figure 40 RoW is Projected to Grow at the Highest Rate for Center Pivot Irrigation Systems for Large Fields Through 2021
Figure 41 Stationary is Projected to Be the Largest Segment Through 2021
Figure 42 North America is Projected to Be the Largest Market Through 2021
Figure 43 South America to Be an Emerging Market Through 2021
Figure 44 The Spans Segment is Projected to Be the Largest Through 2021
Figure 45 Countries With Largest Area Equipped for Irrigation in Various Regions
Figure 46 Regional Snapshot (2015): Markets in South Africa & Australia are Emerging as New Hotspots
Figure 47 North American Center Pivot Irrigation Systems Market Snapshot: the U.S. is Projected to Be the Leader Between 2016 & 2021
Figure 48 European Center Pivot Irrigation System Market Snapshot: Russia Was the Largest Market in 2015
Figure 49 Asia-Pacific Center Pivot Irrigation Systems Market Snapshot: China is the Leading Market
Figure 50 South America Center Pivot Irrigation System Market Snapshot: China is the Leading Market
Figure 51 New Product Launches & Developments Were Preferred By Key Center Pivot Irrigation Systems Companies in the Last Seven Years
Figure 52 Expansion Strategy Adopted for Increasing the Customer Base Between 2012 and 2016
Figure 53 New Product Launches & Developments Were the Key Strategies Between 2010 and 2016
Figure 54 Geographical Revenue Mix of Leading Market Players, 2015
Figure 55 Lindsay Corporation: Company Snapshot
Figure 56 Lindsay Corporation: SWOT Analysis
Figure 57 Valmont Industries, Inc.: Company Snapshot
Figure 58 Valmont Industries: SWOT Analysis


Growth opportunities and latent adjacency in Center Pivot Irrigation Systems Market