Irrigation Controllers Market by Type (Weather-based and Sensor-based), Product (Smart Controllers, Tap Timers, and Basic Controllers), Application (Non-agriculture and Agriculture), Irrigation Type, and Region - Global Forecast to 2022


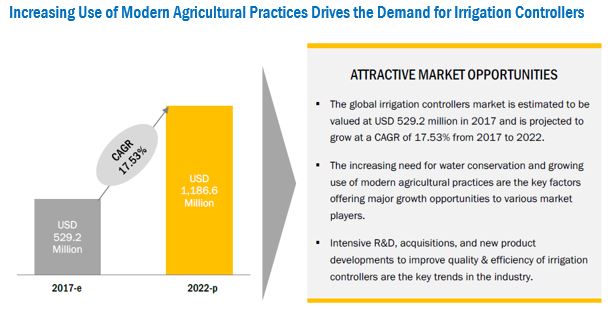
[135 Pages Report] The irrigation controllers market was valued at USD 450.6 Million in 2016 and is projected to reach 1,186.6 Million by 2022, at a CAGR of 17.53% during the forecast period.
For more details on this research, Request Free Sample Report
The years considered for the study are as follows:
- Base year – 2016
- Estimated year – 2017
- Projected year – 2022
- Forecast period – 2017 to 2022
The objectives of the report
- Determining and projecting the size of irrigation controllers market with respect to the type, product, application, irrigation type, and regional markets, over the period ranging from 2017 to 2022.
- Identifying attractive opportunities in the market by determining the largest and fastest-growing segments across regions.
-
Analyzing the demand-side factors on the basis of the following:
- Impact of macroeconomic and microeconomic factors on the market
- Shifts in demand patterns across different subsegments and regions
Research Methodology:
- Major regions were identified, along with countries contributing the maximum share
- Secondary research was conducted to find the value of irrigation controllers market for regions such as North America, Europe, Asia Pacific, South America, and RoW
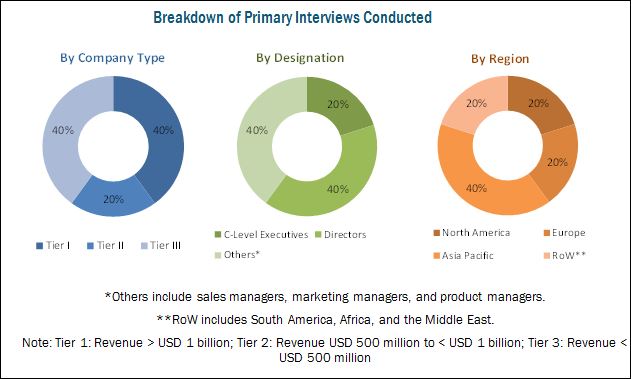
- The key players have been identified through secondary sources such as the US Department of Agriculture (USDA), the Food and Agriculture Organization (FAO), International Commission on Irrigation and Drainage (ICID), the World Bank, and the Organization for Economic Co-operation and Development (OECD), while their market share in respective regions was determined through both, primary and secondary research. The research methodology includes the study of annual and financial reports of top market players, as well as interviews with industry experts (such as CEOs, VPs, directors, and marketing executives) for key insights (both quantitative and qualitative) for the irrigation controllers market.
To know about the assumptions considered for the study, download the pdf brochure
The various contributors involved in the value chain of the irrigation controllers market include R&D institutes; irrigation controllers manufacturing companies such as Valmont Industries (US), Toro (US), Lindsay Corporation (US), and Hunter Industries (US); and government bodies & regulatory associations such as the US Department of Agriculture (USDA) and the Food and Agriculture Organization (FAO).
Target Audience:
The stakeholders for the report are as follows:
- Supply side: Irrigation controller producers, suppliers, distributors, importers, and exporters
- Demand-side: Landscape maintenance personnel, OEMs, turnkey contractors, irrigation designers, farmers, farmer’s organizations, and component suppliers
- Regulatory side: Concerned government authorities, commercial research & development (R&D) institutions, and other regulatory bodies
- Other related associations, research organizations, and industry bodies: The Food and Agriculture Organization (FAO) and the US Food & Drug Administration (FDA)
Scope of the Report:
This research report categorizes the irrigation controllers market based on type, product, application, irrigation type, and region.
Based on Type, the market has been segmented as follows:
- Weather-based
- Sensor-based
Based on Product, the market has been segmented as follows:
- Smart controllers
- Tap timers
- Basic controllers
Based on Application, the market has been segmented as follows:
-
Non-agriculture
- Sports ground/golf course
- Residential
- Others (Pastures, parks, school or university campuses, industrial commercial buildings, and cemeteries)
-
Agriculture
-
Open field
- Cereals & grains
- Oilseeds & pulses
- Fruits & vegetables
- Others (sugarcane, tea, coffee, turf, forage, and ornamental crops)
- Controlled environment agriculture
-
Open field
Based on Irrigation Type, the market has been segmented as follows:
Based on Region, the market has been segmented as follows:
- North America
- Europe
- Asia Pacific
- South America
- RoW (the Middle East and Africa)
Available Customizations
With the given market data, MarketsandMarkets offers customizations according to the company’s specific scientific needs.
The following customization options are available for the report:
Product Analysis
- Product matrix, which gives a detailed comparison of the product portfolio of each company
Geographic Analysis
- Further breakdown of the Rest of Asia Pacific irrigation controllers market into Southeast Asian countries
- Further breakdown of the Rest of the Europe irrigation controller market into Ukraine, the Netherlands, and Belgium
Application Breakdown
- Further breakdown of the open field applications of irrigation controllers
Company Information
- Detailed analyses and profiling of additional market players (up to five)
The irrigation controllers market is driven by the increasing need for water conversation and growing use of modern farming practices. Furthermore, factors such as rapid growth in the lawn and garden equipment market are expected to increase the demand for irrigation controllers. However, the high initial investment cost and declining farm incomes are expected to restrict the market growth. Additionally, design challenges are resulting in low demand from labor-intensive economies and are expected to pose a challenge to the global market.
The irrigation controllers market, based on type, has been segmented into weather-based and sensor-based. The sensor-based irrigation controllers segment is expected to grow at the highest CAGR during the forecast period. Sensors help in obtaining real-time soil moisture level and determining the irrigation requirements.
The market, based on product, has been segmented into smart controllers, tap timers, and basic controllers. The multi-functionality of smart irrigation controllers and ability to generate weather and farm reports are expected to increase their demand.
The irrigation controllers market, by application, has been segmented into agriculture and non-agriculture. The non-agriculture segment covered the largest market share as irrigation controllers are most widely used in sports grounds, golf courses, and residential lawns & gardens. The growing trend of controlled environment agriculture is expected to increase the demand for irrigation controllers in the agriculture segment.
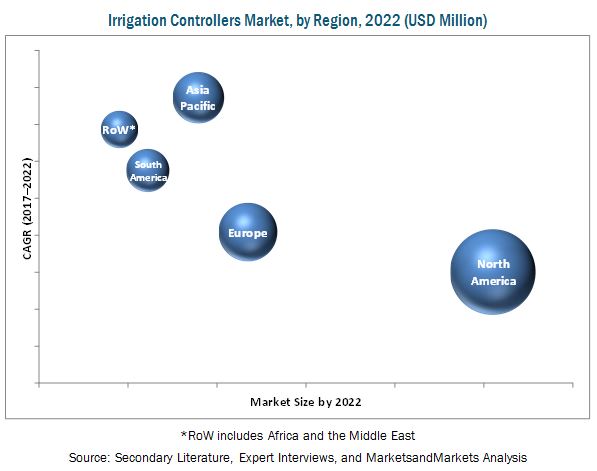
Asia Pacific is projected to be the fastest-growing irrigation controllers market over the next five years. The major drivers for the growth of the Asia Pacific market include the climatic conditions, strong government support, increased productivity, and increased need for reducing wastage of water. The key countries considered under this region are China, Japan, Australia & New Zealand, India, and the Rest of Asia Pacific which includes Thailand, Vietnam, Indonesia, Malaysia, the Philippines, and South Korea.
The high cost of installation of irrigation controllers and its peripherals and globally declining farm income are expected to restrict the market growth in the near future. Furthermore, the challenges regarding design and operations are also expected to hamper the market growth.
The global market for irrigation controllers is dominated by large players such as Valmont Industries (US), Lindsay Corporation (US), Toro (US), Hunter Industries (US), and Rain Bird (US). HydroPoint Data Systems (US), Netafim (Israel), Calsense (US), Glacon (Israel), Rachio (US), Weathermatic (US), Green IQ (Israel), and Nelson Irrigation (US) are a few other key market players that also have a significant share in the irrigation controllers market.
To speak to our analyst for a discussion on the above findings, click Speak to Analyst
 Exclusive indicates content/data unique to MarketsandMarkets and not available with any competitors.
Table of Contents
1 Introduction (Page No. - 14)
1.1 Objectives of the Study
1.2 Market Definition
1.3 Study Scope
1.4 Periodization Considered
1.5 Currency
1.6 Stakeholders
2 Research Methodology (Page No. - 17)
2.1 Research Data
2.1.1 Secondary Data
2.1.2 Primary Data
2.1.2.1 Key Industry Insights
2.1.2.2 Breakdown of Primaries
2.2 Market Size Estimation
2.3 Data Triangulation
2.4 Research Assumptions & Limitations
2.4.1 Research Assumptions
2.4.2 Limitations
3 Executive Summary (Page No. - 25)
4 Premium Insights (Page No. - 30)
4.1 Opportunities in the Irrigation Controllers Market
4.2 Irrigation Controllers Market, By Region
4.3 North America: Irrigation Controllers Market, By Product & Country
4.4 Irrigation Controllers Market, By Type
4.5 Irrigation Controllers Market, By Irrigation Type
4.6 Irrigation Controllers Market, By Application
4.7 Irrigation Controllers Market, By Region
5 Market Overview (Page No. - 34)
5.1 Introduction
5.2 Market Dynamics
5.2.1 Drivers
5.2.1.1 Increasing Need for Water Conservation
5.2.1.2 Use of Modern Agriculture Practices
5.2.1.3 Increasing Global Demand for Lawn and Garden Equipment
5.2.2 Restraints
5.2.2.1 High Initial Cost of Installation
5.2.2.2 Declining Farm Income
5.2.3 Opportunities
5.2.3.1 Advancement in Communication Technologies
5.2.3.2 Shift From Flood Irrigation to Mechanized Irrigation
5.2.4 Challenges
5.2.4.1 Design Challenges - Resulting in Low Demand From Developing Economies
6 Irrigation Controllers Market, By Type (Page No. - 40)
6.1 Introduction
6.2 Weather-Based
6.2.1 Types of Weather-Based Controllers
6.3 Sensor-Based
7 Irrigation Controllers Market, By Product (Page No. - 44)
7.1 Introduction
7.2 Smart Controllers
7.3 Tap Timers
7.4 Basic Controllers
8 Irrigation Controllers Market, By Application (Page No. - 49)
8.1 Introduction
8.2 Non-Agriculture
8.2.1 Sports Grounds/Golf Courses
8.2.2 Residential
8.2.3 Other Non-Agriculture Applications
8.3 Agriculture
8.3.1 Open Field Agriculture
8.3.1.1 Cereals & Grains
8.3.1.2 Oilseed & Pulses
8.3.1.3 Fruits & Vegetables
8.3.1.4 Other Open Field Applications
8.3.2 Controlled-Environment Agriculture
9 Irrigation Controllers Market, By Irrigation Type (Page No. - 61)
9.1 Introduction
9.2 Drip/Trickle
9.3 Sprinkler
10 Irrigation Controllers Market, By Region (Page No. - 65)
10.1 Introduction
10.2 North America
10.2.1 US
10.2.2 Canada
10.2.3 Mexico
10.3 Europe
10.3.1 France
10.3.2 UK
10.3.3 Germany
10.3.4 Russia
10.3.5 Italy
10.3.6 Spain
10.3.7 Rest of Europe
10.4 Asia Pacific
10.4.1 China
10.4.2 Australia-New Zealand
10.4.3 Japan
10.4.4 India
10.4.5 Rest of Asia Pacific
10.5 South America
10.5.1 Brazil
10.5.2 Argentina
10.5.3 Rest of South America
10.6 RoW
10.6.1 Africa
10.6.2 Middle East
11 Competitive Landscape (Page No. - 99)
11.1 Overview
11.2 Market Ranking, By Key Player
11.3 Competitive Scenario
11.3.1 Acquisitions
11.3.2 New Product Development/Launches & Product Enhancements
11.3.3 Expansions
11.3.4 Partnerships, Agreements, and Contracts
12 Company Profiles (Page No. - 103)
(Business overview, Products offered, Recent developments, MNM view, SWOT analysis)*
12.1 Valmont Industries
12.2 Lindsay Corporation
12.3 Toro
12.4 Rain Bird
12.5 Hunter Industries
12.6 Netafim
12.7 Hydropoint Data Systems
12.8 Calsense
12.9 Galcon
12.10 Rachio
12.11 Weathermatic
12.12 Greeniq
12.13 Nelson Irrigation
*Business overview, Products offered, Recent developments, MNM view, SWOT analysis might not be captured in case of unlisted companies.
13 Appendix (Page No. - 126)
13.1 Discussion Guide
13.2 Company Developments
13.2.1 Acquisitions
13.2.2 New Product Development/Launches & Product Enhancements
13.3 Knowledge Store: Marketsandmarkets’ Subscription Portal
13.4 Introducing RT: Real-Time Market Intelligence
13.5 Available Customizations
13.6 Related Reports
13.7 Author Details
List of Tables (93 Tables)
Table 1 Global Water Availability, 2012 (Million Cubic Km)
Table 2 Prices of Different Types of Irrigation Controllers By Brand
Table 3 Irrigation Controllers Market Size, By Type, 2015–2022 (USD Million)
Table 4 Weather-Based Irrigation Controllers Market Size, By Region, 2015–2022 (USD Million)
Table 5 Sensor-Based Irrigation Controllers Market Size, By Region, 2015–2022 (USD Million)
Table 6 Irrigation Controllers Market Size, By Product, 2015–2022 (USD Million)
Table 7 Smart Controllers: Irrigation Controllers Market Size, By Region, 2015–2022 (USD Million)
Table 8 Tap Timers: Irrigation Controllers Market Size, By Region, 2015–2022 (USD Million)
Table 9 Basic Controllers: Irrigation Controllers Market Size, By Region, 2015–2022 (USD Million)
Table 10 Irrigation Controllers Market Size, By Application, 2015–2022 (USD Million)
Table 11 Non-Agricultural Irrigation Controllers Market Size, By Region, 2015–2022 (USD Million)
Table 12 Irrigation Controllers Market Size, By Non-Agriculture Application, 2015–2022 (USD Million)
Table 13 Sports Ground/Golf Course: Irrigation Controllers Market Size, By Region, 2015–2022 (USD Million)
Table 14 Residential Irrigation Controllers Market Size, By Region, 2015–2022 (USD Million)
Table 15 Other Non-Agricultural Irrigation Controllers Market Size, By Region, 2015–2022 (USD Million)
Table 16 Agriculture: Irrigation Controllers Market Size, By Region, 2015–2022 (USD Million)
Table 17 Irrigation Controllers Market Size, By Agriculture Application, 2015–2022 (USD Million)
Table 18 Open Field Agriculture: Irrigation Controllers Market Size, By Region, 2015–2022 (USD Million)
Table 19 Irrigation Controllers Market Size, By Open Field Agriculture, 2015–2022 (USD Million)
Table 20 Cereals & Grains: Irrigation Controllers Market Size, By Region, 2015–2022 (USD Million)
Table 21 Oilseeds & Pulses: Irrigation Controllers Market Size, By Region, 2015–2022 (USD Million)
Table 22 Fruits & Vegetables: Irrigation Controllers Market Size, By Region, 2015–2022 (USD Thousand)
Table 23 Other Open Field Applications: Irrigation Controllers Market Size, By Region, 2015–2022 (USD Million)
Table 24 Controlled Environment Agriculture: Irrigation Controllers Market Size, By Region, 2015–2022 (USD Million)
Table 25 Irrigation Controllers Market Size, By Irrigation Type, 2015–2022 (USD Million)
Table 26 Drip/Trickle: Irrigation Controllers Market Size, By Region, 2015–2022 (USD Million)
Table 27 Sprinkler: Irrigation Controllers Market Size, By Region, 2015–2022 (USD Million)
Table 28 Irrigation Controllers Market, By Region, 2015–2022 (USD Million)
Table 29 North America: Irrigation Controllers Market, By Type, 2015–2022 (USD Million)
Table 30 North America: Market, By Product, 2015–2022 (USD Million)
Table 31 North America: Market, By Application, 2015–2022 (USD Million)
Table 32 North America: Market, By Non-Agriculture Application, 2015–2022 (USD Million)
Table 33 North America: Market, By Agriculture Application, 2015–2022 (USD Million)
Table 34 North America: Market, By Open Field Application, 2015–2022 (USD Million)
Table 35 North America: Market, By Irrigation Type, 2015–2022 (USD Million)
Table 36 North America: Market, By Country, 2015–2022 (USD Million)
Table 37 US: Market, By Type, 2015–2022 (USD Million)
Table 38 Canada: Market Size, By Type, 2015–2022 (USD Million)
Table 39 Mexico: Market Size, By Type, 2015–2022 (USD Million)
Table 40 Europe: Irrigation Controllers Market, By Type, 2015–2022 (USD Million)
Table 41 Europe: Market, By Product, 2015–2022 (USD Million)
Table 42 Europe: Market, By Application, 2015–2022 (USD Million)
Table 43 Europe: Market, By Non-Agriculture-Application, 2015–2022 (USD Million)
Table 44 Europe: Market, By Agriculture Application, 2015–2022 (USD Million)
Table 45 Europe: Market, By Open Field Application, 2015–2022 (USD Million)
Table 46 Europe: Market, By Irrigation Type, 2015–2022 (USD Million)
Table 47 Europe: Market Size, By Country, 2015–2022 (USD Million)
Table 48 France: Market Size, By Type, 2015–2022 (USD Million)
Table 49 UK: Market Size, By Type, 2015–2022 (USD Million)
Table 50 Germany: Market Size, By Type, 2015–2022 (USD Million)
Table 51 Russia: Market Size, By Type, 2015–2022 (USD Million)
Table 52 Italy: Market Size, By Type, 2015–2022 (USD Million)
Table 53 Spain: Market Size, By Type, 2015–2022 (USD Million)
Table 54 Rest of Europe: Market Size, By Type, 2015–2022 (USD Million)
Table 55 Asia Pacific: Irrigation Controllers Market Size, By Type, 2015–2022 (USD Million)
Table 56 Asia Pacific: Market Size, By Product, 2015–2022 (USD Million)
Table 57 Asia Pacific: Market Size, By Application, 2015–2022 (USD Million)
Table 58 Asia Pacific: Market Size, By Non Agriculture Application, 2015–2022 (USD Million)
Table 59 Asia Pacific: Market Size, By Agriculture Application, 2015–2022 (USD Million)
Table 60 Asia Pacific: Market Size, By Open Field Application, 2015–2022 (USD Million)
Table 61 Asia Pacific: Market Size, By Irrigation Type, 2015–2022 (USD Million)
Table 62 Asia Pacific: Market Size, By Country, 2015–2022 (USD Million)
Table 63 China: Irrigation Controllers Market Size, By Type, 2015–2022 (USD Million)
Table 64 Australia-New Zealand: Irrigation Controllers Market Size, By Type, 2015–2022 (USD Million)
Table 65 Japan: Irrigation Controllers Market Size, By Type, 2015–2022 (USD Million)
Table 66 India: Irrigation Controllers Market Size, By Type, 2015–2022 (USD Million)
Table 67 Rest of Asia Pacific: Irrigation Controllers Market Size, By Type, 2015–2022 (USD Million)
Table 68 South America: Irrigation Controllers Market Size, By Type, 2015–2022 (USD Million)
Table 69 South America: Market Size, By Product, 2015–2022 (USD Million)
Table 70 South America: Market Size, By Application, 2015–2022 (USD Million)
Table 71 South America: Market Size, By Non-Agriculture Application, 2015–2022 (USD Million)
Table 72 South America: Market Size, By Agriculture Application, 2015–2022 (USD Million)
Table 73 South America: Market Size, By Open Field Application, 2015–2022 (USD Million)
Table 74 South America: Market Size, By Irrigation Type, 2015–2022 (USD Million)
Table 75 South America: Market Size, By Country, 2015–2022 (USD Million)
Table 76 Brazil: Market Size, By Type, 2015–2022 (USD Million)
Table 77 Argentina: Market Size, By Type, 2015–2022 (USD Million)
Table 78 Rest of South America: Irrigation Controllers Market Size, By Type, 2015–2022 (USD Million)
Table 79 RoW: Market Size, By Type, 2015–2022 (USD Million)
Table 80 RoW: Market Size, By Product, 2015–2022 (USD Million)
Table 81 RoW: Market Size, By Application, 2015–2022 (USD Million)
Table 82 RoW: Market Size, By Non-Agriculture Application, 2015–2022 (USD Million)
Table 83 RoW: Market Size, By Agriculture Application, 2015–2022 (USD Million)
Table 84 RoW: Market Size, By Open Field Application, 2015–2022 (USD Million)
Table 85 RoW: Market Size, By Irrigation Type, 2015–2022 (USD Million)
Table 86 RoW: Market Size, By Country, 2015–2022 (USD Million)
Table 87 Africa: Market Size, By Type, 2015–2022 (USD Million)
Table 88 Middle East: Irrigation Controllers Market Size, By Type, 2015–2022 (USD Million)
Table 89 Market Ranking, 2016
Table 90 Acquisitions, 2014–2016
Table 91 New Product Development/Launches & Product Enhancements, 2014–2017
Table 92 Expansions, 2013–2016
Table 93 Partnerships, Agreements, and Contracts, 2013–2015
List of Figures (41 Figures)
Figure 1 Irrigation Controllers Market Segmentation
Figure 2 Irrigation Controllers Market, Regional Scope
Figure 3 Irrigation Controllers Market: Research Design
Figure 4 Breakdown of Primary Interviews: By Company Type, Designation, and Region
Figure 5 Market Size Estimation: Bottom-Up Approach
Figure 6 Market Size Estimation Methodology: Top-Down Approach
Figure 7 Data Triangulation
Figure 8 Market, By Type
Figure 9 Market, By Product
Figure 10 Market, By Application
Figure 11 Market, By Agriculture Application
Figure 12 Markets, By Irrigation Type
Figure 13 Market, By Region
Figure 14 Increasing Use of Modern Agricultural Practices Drives the Demand for Irrigation Controllers
Figure 15 Asia Pacific is Projected to Grow at the Highest Rate During the Forecast Period
Figure 16 Smart Controllers and US Accounted for the Largest Share in the Global Irrigation Controllers Market in 2016
Figure 17 Weather-Based Irrigation Controllers Segment to Account for A Larger Share Through 2022
Figure 18 Drip/Trickle Segment to Dominate the Irrigation Controllers Market Through 2022
Figure 19 Non-Agricultural Segment Dominated the Irrigation Controllers Market Across All Regions in 2016
Figure 20 Asia Pacific Market to Grow at the Highest Rate Between 2017 and 2022
Figure 21 Irrigation Controllers Market Dynamics
Figure 22 Total Water Withdrawal, By Sector and Region, 2010
Figure 23 US: Net Farm Income, 2010 to 2017
Figure 24 Weather-Based Segment to Dominate the Irrigation Controllers Market Through 2022
Figure 25 Smart Controllers Segment to Dominate the Irrigation Controllers Market, 2017 vs 2022
Figure 26 Non-Agriculture Segment to Dominate the Irrigation Controllers Market, 2017 vs 2022
Figure 27 Drip/Trickle Irrigation Segment to Dominate the Irrigation Controllers Market Through 2022
Figure 28 North America is Expected to Dominate the Irrigation Controllers Market By 2022
Figure 29 Japan to Be the Most Attractive Market for Irrigation Controllers Manufacturers (2017–2022)
Figure 30 North America Snapshot: Irrigation Controllers Market
Figure 31 Asia Pacific Snapshot: Irrigation Controllers Market
Figure 32 Companies Adopted New Product Development/Launches and Product Enhancement as Their Key Growth Strategies From 2013 to 2017
Figure 33 Market Evaluation Framework
Figure 34 Valmont Industries: Company Snapshot
Figure 35 Valmont Industries: SWOT Analysis
Figure 36 Lindsay Corporation: Company Snapshot
Figure 37 Lindsay Corporation: SWOT Analysis
Figure 38 Toro: Company Snapshot
Figure 39 Toro: SWOT Analysis
Figure 40 Rain Bird: SWOT Analysis
Figure 41 Hunter Industries: SWOT Analysis


Growth opportunities and latent adjacency in Irrigation Controllers Market