
Chiplet Market Size, Share & Trends

Chiplet Market Size, Share & Trends by Processor (Field-Programmable Gate Array (FPGA), Central Processing Unit (CPU), Graphics Processing Unit (GPU), SOC, AI ASIC Co-Processor), Packaging Technology (SiP, FCCSP, FCBGA,2.5D/3D, WLCSP, Fan-Out) - Global Forecast to 2030


CHIPLET MARKET SIZE, SHARE & TRENDS
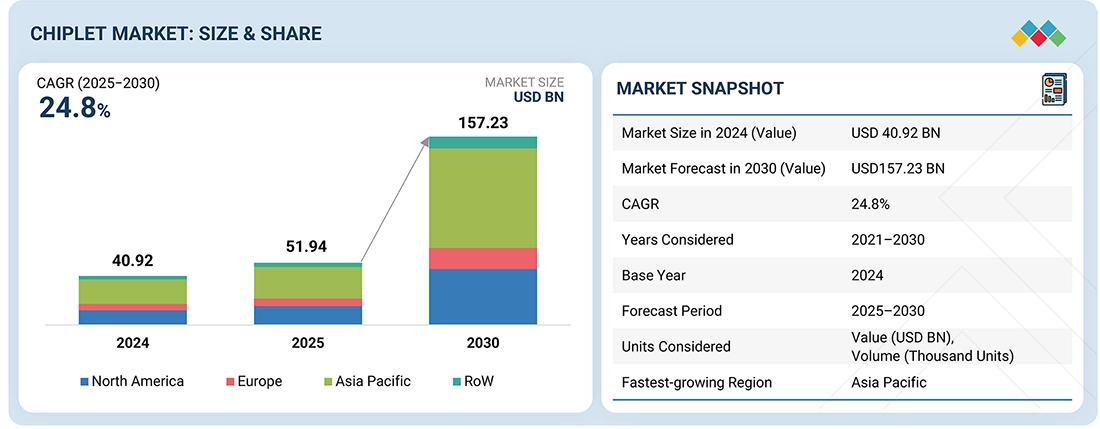
According to Marketsandmarkets, The global Chiplet market size was valued at USD 51.94 billion in 2025 and is projected to reach USD 157.23 billion by 2030, growing at a CAGR of 24.8%. from 2025 to 2030. The growth of the chiplet market is driven by rapid expansion of 5G infrastructure and adoption of advanced packaging technologies.
MARKET SNAPSHOT TABLE
| REPORT METRIC | DETAILS |
|---|---|
| Market Size in 2025 (Value) | USD 51.94 Billion |
| Market Forecast in 2030 (Value) | USD 157.23 Billion |
| Growth Rate | CAGR of 24.8% from 2025-2030 |
| Years Considered | 2021-2030 |
| Base Year | 2024 |
| Forecast Period | 2025-2030 |
| Units Considered | Value (USD Million/Billion), Volume (Thousand Units) |
| Report Coverage | Revenue forecast, company ranking, competitive landscape, growth factors, and trends |
| Top Companies |
|
| Growth Drivers |
|
| Segments Covered |
|
| Regions Covered | North America, Asia Pacific, Europe, RoW |
Market Size & Forecast
KEY TAKEAWAYS
-
BY PROCESSORThe AI ASIC co-processor segment is projected to experience the fastest growth during the forecast period because of its specialized design optimized for AI and machine learning workloads, providing superior performance and energy efficiency compared to general-purpose processors. Growing adoption of AI in industries such as data centers, autonomous vehicles, and edge computing increases demand for these custom accelerators.
-
BY END-USER INDUSTRYThe enterprise end-user industry is projected to hold the largest share of the chiplet market share during the forecast period. This growth is driven by the increasing demand for high-performance computing solutions in data centers, cloud computing, and AI workloads, which require scalable and energy-efficient chiplet architectures. Enterprises across sectors such as IT, telecommunications, and automotive are increasingly adopting chiplets to enhance performance and cut costs, thereby boosting market growth.
-
BY PACKAGING TECHNOLOGY2.5D/3D packaging is a transformative technology reshaping the chiplets landscape. By enabling vertical stacking of chiplets, it promises unparalleled levels of performance, bandwidth, and miniaturization. 2.5D/3D is a packaging methodology that enables the inclusion of multiple ICs into the same package. In a 2.5D structure, two or more active semiconductor chips are placed side-by-side on a silicon interposer to achieve extremely high die-to-die interconnect density. In a 3D structure, active chips are integrated by die stacking for the shortest interconnect and smallest package footprint. In recent years, 2.5D and 3D have gained momentum as the ideal chiplet integration platforms due to their merits in achieving extremely high packaging density and energy efficiency.
-
BY REGIONThe North American chiplet market is poised for significant growth, fueled by several key factors, including its strong technological ecosystem, high demand for advanced computing solutions, collaborative efforts between industry leaders and academic institutions, and supportive government policies and incentives. The region is a hub for cutting-edge semiconductor innovation, thriving on the ecosystem of semiconductor companies, research organizations, and technology giants.
-
COMPETITIVE LANDSCAPEMajor market players have adopted both organic and inorganic strategies, such as partnerships and investments. For instance, Intel announced a partnership with TSMC to manufacture chips for Intel's high-performance computing and graphics products. This partnership aims to help Intel reduce its reliance on external foundries.
The chiplet industry offers significant opportunities driven by increasing demand for high-performance and energy-efficient computing solutions in AI, 5G, and data center applications. The rise of open standards like UCIe is opening new paths for interoperability and collaboration among semiconductor vendors. Furthermore, growing use in consumer electronics, automotive, and edge computing expands the market’s application base. Ongoing advances in 2.5D/3D packaging and interconnect technologies create additional opportunities for innovation and cost-effective chip designs.
Source: Secondary Research, Interviews with Experts, MarketsandMarkets Analysis
TRENDS & DISRUPTIONS IMPACTING CUSTOMERS' CUSTOMERS
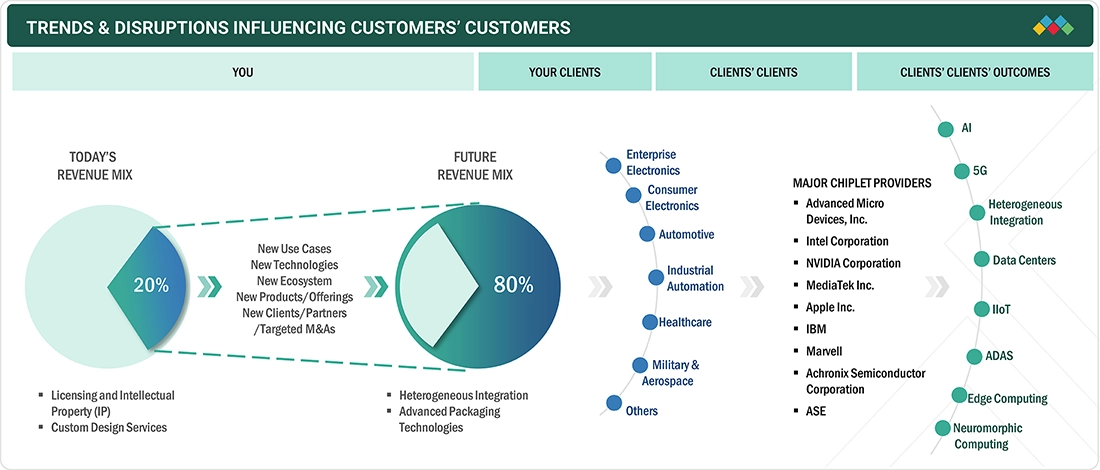
Chiplet providers primarily depend on technologies like heterogeneous integration and advanced packaging. Future revenue in this area is likely to be influenced by industry trends such as AI, 5G, heterogeneous integration, data centers, IIoT, advanced driver-assistance systems (ADAS), edge computing, and neuromorphic computing. Companies should also focus on how these trends are affecting their current clients and how the clients' revenue is changing. This analysis will help companies strategize their business initiatives and understand the impact of these evolving industry trends.
Source: Secondary Research, Interviews with Experts, MarketsandMarkets Analysis
CHIPLET MARKET DYNAMICS
Level
-
Adoption of high-performance computing (HPC) servers in various sectors

-
Proliferation of data centers worldwide

Level
-
Heat management issues

-
Lack of industry-wide interoperability standards

Level
-
Development of quantum chiplets

-
Rapid expansion of 5G infrastructure

Level
-
Challenges related to intellectual property (IP) protection and licensing

-
Cybersecurity and vulnerability issues associated with chiplet-based systems

Source: Secondary Research, Interviews with Experts, MarketsandMarkets Analysis
Driver: Adoption of high-performance computing (HPC) servers in various sectors
High-performance computing (HPC) servers, crucial in various sectors, leverage chiplet-based architectures for efficiency, scalability, and high-performance computing.
Restraint: Heat management issues
Thermal management is a restraint in the chiplet market due to rising power density, miniaturization, and heat generation, requiring precise solutions.
Opportunity: Development of quantum chiplets
Quantum chiplets offer exponential performance gains, diversifying applications and attracting investors while aligning with eco-friendly trends, ensuring long-term market relevance.
Challenge: Challenges related to intellectual property (IP) protection and licensing
Industry players are expected to develop strategies and agreements to navigate intellectual property issues, allowing for more efficient collaboration and growth in the chiplets market.
Chiplet Market: COMMERCIAL USE CASES ACROSS INDUSTRIES
| COMPANY | USE CASE DESCRIPTION | BENEFITS |
|---|---|---|
 |
Integration of multiple compute and I/O chiplets using Foveros and EMIB packaging technologies | Enhances performance scalability, reduces latency, and improves power efficiency in CPUs and AI accelerators |
 |
Modular chiplet architecture in Ryzen and EPYC processors connected through Infinity Fabric | Reduces manufacturing cost, increases yield, and enables high-performance, scalable computing |
Logos and trademarks shown above are the property of their respective owners. Their use here is for informational and illustrative purposes only.
CHIPLET MARKET ECOSYSTEM
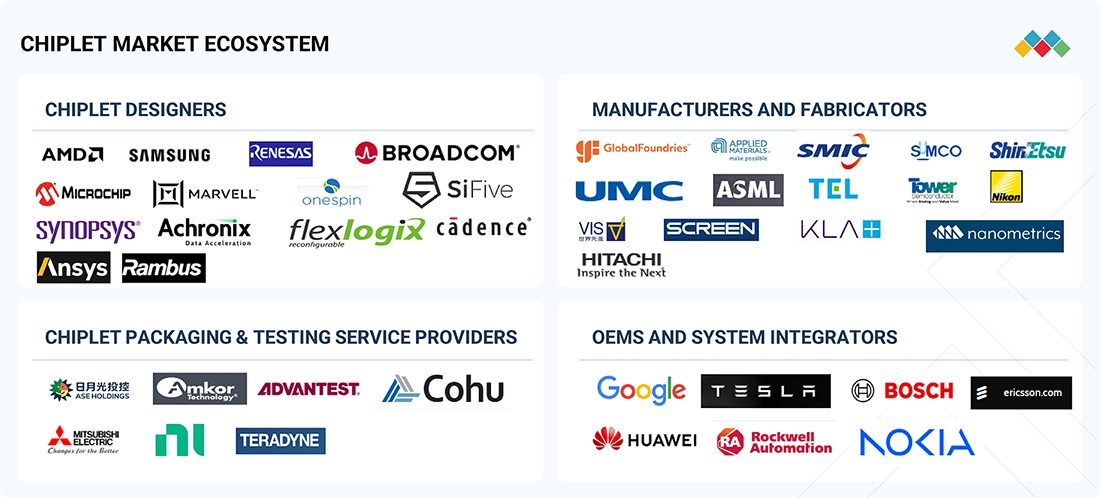
The figure shows the diverse ecosystem of the chiplet market growth , including designers, manufacturers, packaging service providers, and OEMs. Top chiplet designers such as AMD, Samsung, and Marvell focus on creating advanced architectures and interconnect technologies. Manufacturers and fabricators like TSMC, GlobalFoundries, and UMC play key roles in wafer production and advanced packaging. Moreover, companies like Amkor, ASE, and Teradyne offer testing and packaging services, while OEMs such as Google, Tesla, and Huawei incorporate chiplet-based solutions into end-user products, boosting overall market adoption.
Logos and trademarks shown above are the property of their respective owners. Their use here is for informational and illustrative purposes only.
CHIPLET MARKET SEGMENTS
Source: Secondary Research, Interviews with Experts, MarketsandMarkets Analysis
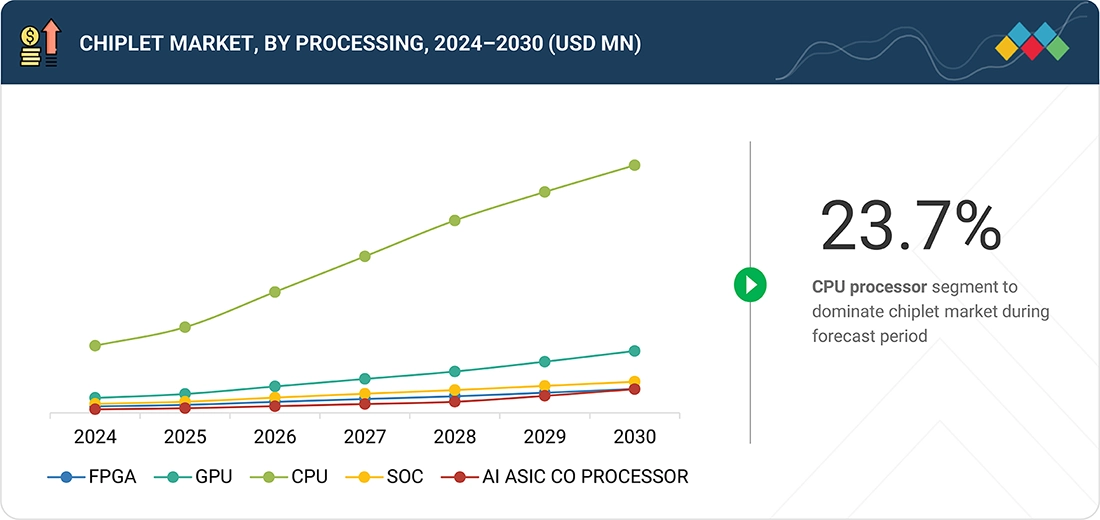
Chiplet Market, By Processsor
The CPU segment is expected to grow significantly due to its vital role in powering many computing devices. As the demand for higher processing power, energy efficiency, and scalability increases, chiplet-based CPU designs are likely to become more popular. Chiplets allow CPU manufacturers to optimize and modularize their designs by including specialized chiplets for different functions such as cores, cache, and memory controllers. This approach improves overall CPU performance, efficiency, and flexibility, serving a wide range of applications from consumer electronics to data centers.
Chiplet Market, By End-user Industry
Chiplets are transforming various enterprise electronics, such as data center servers, AI accelerators, high-performance computing (HPC) systems, networking equipment, and storage systems. They provide better performance, efficiency, cost savings, and scalability compared to traditional monolithic chips. The interconnectivity of chiplets allows for more powerful and specialized chips, reducing power use and manufacturing costs. As chiplet technology advances, its demand in enterprise electronics is likely to grow to improve capabilities.
Chiplet Market, By Technology
2.5D/3D packaging has emerged as a transformative technology in the chiplet landscape. By allowing vertical stacking of chiplets, it ensures high performance, bandwidth, and miniaturization. It allows multiple ICs to be combined into the same package. In a 2.5D design, two or more active semiconductor chips are placed side-by-side on a silicon interposer to achieve very high die-to-die interconnect density. In a 3D design, active chips are stacked for minimal interconnect length and a smaller package footprint. Recently, 2.5D and 3D have gained popularity as the preferred platforms for chiplet integration due to their advantages in delivering extremely high packaging density and energy efficiency.
Chiplet Market, By Region
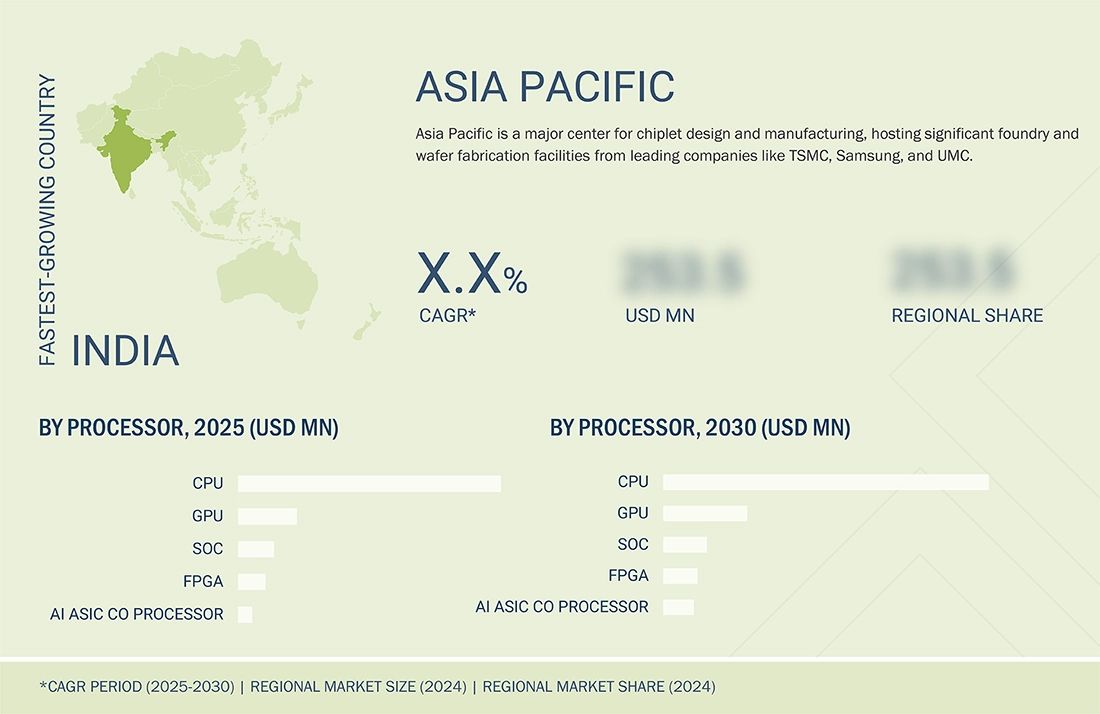
The semiconductor industry in the Asia Pacific region boasts a powerful network of foundries, manufacturers, and technology innovators, driving significant advancements in chiplet-based designs. The region is also witnessing high demand for advanced electronic devices, particularly in populous countries such as China and India, making it a prime target for chiplet technology. Moreover, the rapid rollout of 5G networks across the region drives the need for efficient, high-performance computing, aligning seamlessly with chiplet capabilities in power efficiency and heterogeneous integration. Asia Pacific governments' substantial investments in research & development, notably in South Korea, Taiwan, and Singapore, underscore their commitment to fostering innovation.
CHIPLET MARKET BY REGION
Asia Pacific to be fastest-growing region in global chiplet market during forecast period
The Asia Pacific chiplet market size is expected to grow significantly. The semiconductor industry in the region has a strong network of foundries, manufacturers, and technology innovators, driving major advances in chiplet-based designs. The region also sees high demand for advanced electronic devices, especially in populous countries like China and India, making it a key focus for chiplet technology. Additionally, the quick rollout of 5G networks across the area increases the need for efficient, high-performance computing, which aligns well with chiplet features like power efficiency and heterogeneous integration. Governments in Asia Pacific are making substantial investments in research and development, especially in South Korea, Taiwan, and Singapore, highlighting their dedication to fostering innovation.
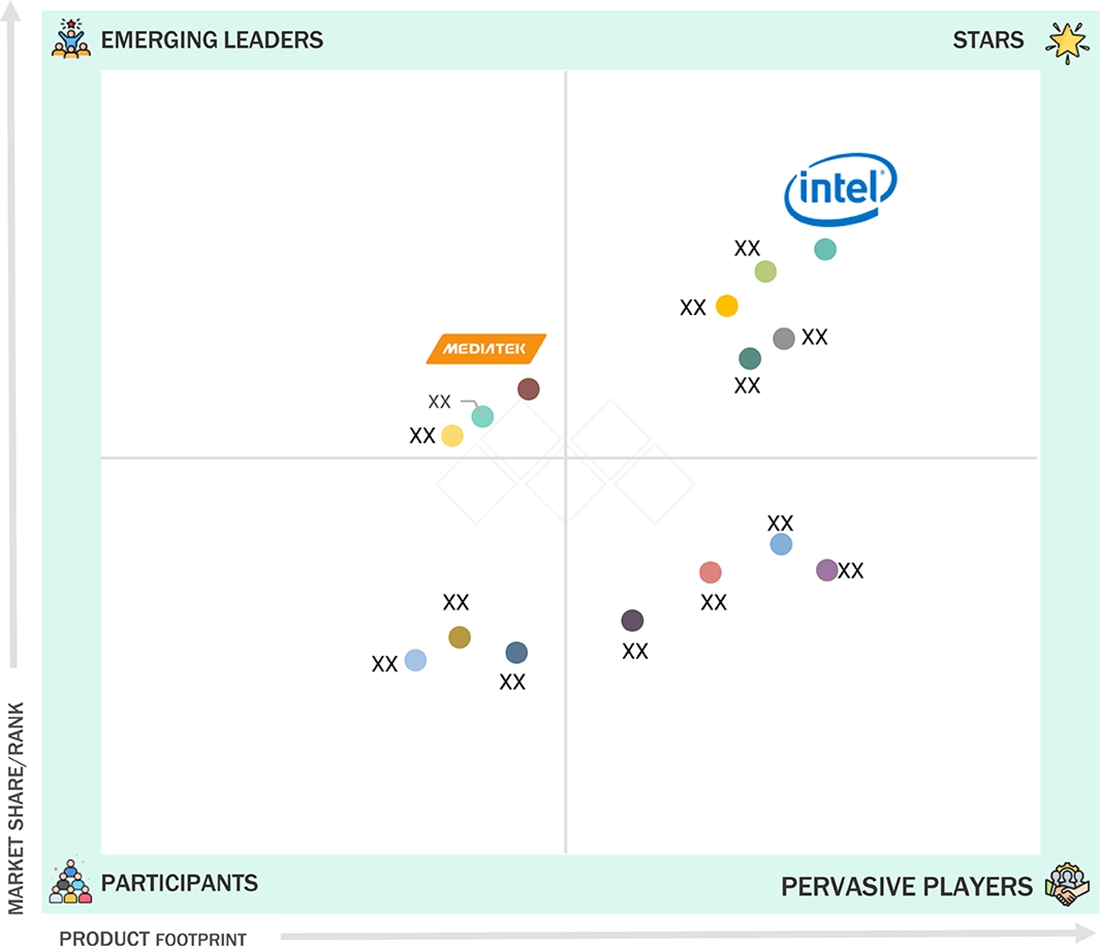
Chiplet Market: COMPANY EVALUATION MATRIX
In the chiplet companies matrix, prominent entities are recognized as the leading market players owing to their advancements such as product launches, innovative technologies, and strategic growth initiatives. These entities possess extensive product portfolios, pioneering offerings, and a worldwide operational footprint. They maintain well-established partnership networks across the entire value chain. The paramount entity in the chiplet market is Intel Corporation (US). Emerging leaders are distinguished vendors with effective business strategies and a robust market presence. They emulate the strategies of the leading entities and possess the potential to ascend to the top tier within the market. Several organizations within the chiplet market trends rely heavily on their partnership networks. MediaTek (Taiwan) exemplifies this category.
Source: Secondary Research, Interviews with Experts, MarketsandMarkets Analysis
KEY MARKET PLAYERS
WHAT IS IN IT FOR YOU: Chiplet Market REPORT CONTENT GUIDE
DELIVERED CUSTOMIZATIONS
We have successfully delivered the following deep-dive customizations:
| CLIENT REQUEST | CUSTOMIZATION DELIVERED | VALUE ADDS |
|---|---|---|
| Chiplet Market by Processor Type and Packaging Technology | Detailed segmentation of the market by processor type (CPU, GPU, AI ASIC, FPGA) and packaging technology (2.5D, 3D, and 2D) | Identified the fastest-growing processor segments driving market demand |
| Regional Analysis of Chiplet Adoption in Data Centers | Assessment of chiplet deployment across data center applications in North America, Europe, and Asia Pacific | Provided regional competitiveness mapping and ecosystem analysis |
RECENT DEVELOPMENTS IN CHIPLET MARKET
- May 2025 : MediaTek announced the development and September 2025 tape-out of its first 2-nanometer chip, manufactured by TSMC. This product is a custom ASIC designed for high-volume applications beyond smartphones, with a strong focus on AI acceleration and real-time inference, leveraging modular, flexible chiplet-inspired design principles.
- June 2024 : IBM expanded its collaboration with Rapidus, a Japanese semiconductor manufacturer, to include chiplet packaging technology. This partnership aims to establish mass production technologies for chiplet packages, focusing on high-performance semiconductors for 2nm-generation devices.
- February 2023 : Marvell and AWS teamed up to lead in cloud-first silicon design, addressing the unique needs of cloud computing environments. Chiplets, which provide scalability, flexibility, and quick development, are essential to this strategy, enabling customized solutions for evolving cloud workloads. Marvell's chiplet expertise combined with AWS's cloud proficiency promises to advance the development of cloud-optimized silicon.
- March 2022 : Apple unveiled the M1 Ultra, a powerful SoC for the Mac Studio, featuring an innovative UltraFusion packaging that links two M1 Max chips. With 114 billion transistors and up to 128 GB of unified memory, it delivers exceptional performance for developers, 3D artists, and video professionals, vastly surpassing previous systems in tasks like video transcoding. This technology maintains impressive performance per watt, setting a new standard for personal computer chips.
Table of Contents
 Exclusive indicates content/data unique to MarketsandMarkets and not available with any competitors.
Methodology
The study involved four main activities in estimating the size of the chiplet market. Exhaustive secondary research was conducted to gather information on the market, related markets, and parent markets. The next step was to validate these findings, assumptions, and size estimates with industry experts across the value chain through primary research. The bottom-up approach was used to calculate the overall market size. The market breakdown and data triangulation were then applied to estimate the size of segments and subsegments.
Secondary Research
In the secondary research process, sources such as annual reports, press releases, investor presentations of companies, white papers, and articles by recognized authors were referenced. Secondary research was conducted to gather essential information about the market’s supply chain, the market's value chain, the pool of key market players, and market segmentation based on industry trends, region, and developments from both market and technology perspectives.
Primary Research
Extensive primary research was conducted after understanding and analyzing the chiplet market scenario through secondary research. Several interviews were held with key opinion leaders from both demand- and supply-side vendors across four major regions—North America, Europe, Asia Pacific, and RoW. About 25% of these interviews involved demand-side participants, and 75% involved supply-side participants. The primary data were collected through telephone interviews, questionnaires, and emails.

Note: “Others” include sales personnel, marketing specialists, and product managers. The 3 tiers of the companies are defined based on their total revenue as of 2024;
tier 1: Revenue greater than USD 1 billion, tier 2: Revenue between USD 500 million and USD 1 billion, and tier 3: Revenue less than USD 500 million
To know about the assumptions considered for the study, download the pdf brochure
Market Size Estimation
Throughout the entire market engineering process, the top-down and bottom-up approaches, along with various data triangulation methods, have been used to estimate and project the market size across all segments and subsegments outlined in this report. Comprehensive qualitative and quantitative analyses have been carried out throughout the market engineering process to gather key information and insights for this report.
The key players within the market were identified through secondary research, and their respective market share across various regions was ascertained utilizing both primary and secondary research methodologies. This process encompasses the review of annual and financial reports of leading corporations, as well as the conduction of comprehensive interviews with industry specialists such as CEOs, VPs, directors, and marketing executives to collect essential insights—both quantitative and qualitative—pertaining to the chiplet market. All percentage shares, segments, and breakdowns was derived from secondary sources and subsequently verified through primary sources. All pertinent parameters influencing the markets encompassed in this study were meticulously examined, corroborated through primary research, and analyzed to produce accurate final quantitative and qualitative data. This data was compiled and augmented with detailed inputs and analyses from MarketsandMarkets and is presented within this report.
Chiplet Market: Top-Down and Bottom-Up Approach
In the top-down approach, the overall market size is used to estimate the sizes of individual markets (mentioned in the market segmentation) through percentage splits derived from secondary and primary research. For calculating specific market segments, the most appropriate immediate parent market size is used to apply the top-down approach. The bottom-up approach is also used with data obtained from secondary research to validate the market sizes of various segments. Each company’s market share is estimated to verify the revenue share used earlier in the bottom-up approach. Through data triangulation and validation with primary data, the overall parent market size and each individual market size are determined and confirmed in this study.

Data Triangulation
After determining the overall market size through the above process, the market has been divided into several segments. To complete the overall market analysis and obtain precise data for all segments, market breakdown and data triangulation methods have been used where applicable. The data has been triangulated by examining various factors and trends from both demand and supply perspectives. The market validation has been conducted using both top-down and bottom-up approaches.
Market Definition
A chiplet is a discrete hardware component integrated into a heterogeneous integrated circuit (IC). Its purpose is to enhance the overall functionality of the final IC, ensuring it matches or exceeds the performance of a monolithic die, usually by optimizing specific functions in a cost-effective or physical manner. Chiplets mark a major shift in semiconductor design and manufacturing, moving away from the traditional monolithic approach where all semiconductor device components are combined into a single die.
Key Stakeholders
- Chiplet manufacturers
- Semiconductor foundries
- Original equipment manufacturers (OEMs)
- Fabless semiconductor companies
- Electronic design automation (EDA) providers
- Packaging and interconnect suppliers
- Material suppliers
- Test and inspection equipment manufacturers
- Industry associations and standards bodies
- Research and development institutions
- Government regulatory bodies
- Investors and financial institutions
- Competitive analysis firms
Report Objectives
- To describe and forecast the chiplet market based on processor, packaging technology, end-use application, and region
- To forecast the size of the market segments for major regions—North America, Europe, Asia Pacific, and the Rest of the World (RoW)
- To provide detailed information regarding the major factors influencing the growth of the market (drivers, restraints, opportunities, and challenges)
- To provide an ecosystem analysis, case study analysis, patent analysis, technology analysis, indicative pricing analysis, Porter’s Five Forces analysis, and regulatory landscape pertaining to the chiplet market
- To provide a detailed overview of the value chain of the chiplet market
- To strategically analyze micromarkets1 with respect to individual growth trends, prospects, and contributions to the total market
- To strategically profile the key players and comprehensively analyze their market share and core competencies2
- To analyze opportunities in the market for stakeholders and describe the competitive landscape of the market
- To analyze competitive developments such as collaborations, agreements, partnerships, product developments, and research & development (R&D) in the market
Available Customization
Based on the available market data, MarketsandMarkets provides tailored options to meet the specific needs of each company. The report offers the following customization choices:
Company Information:
- Detailed analysis and profiling of 25 market players
Key Questions Addressed by the Report
What is the current size of the Chiplet Market?
The global Chiplet Market was valued at USD 51.94 billion in 2025.
What is the projected market size of the Chiplet Market by 2030?
The market is projected to grow from USD 51.94 billion in 2025 to USD 157.23 billion by 2030.
What CAGR is expected for the Chiplet Market during 2025–2030?
The Chiplet Market is expected to register a CAGR of 24.8% during the forecast period.
What are the key trends shaping the Chiplet Market?
Major trends include AI-driven semiconductor demand, high-performance computing (HPC), heterogeneous integration, advanced 2.5D/3D packaging technologies, and adoption of open standards such as UCIe.
What is a major growth driver for the Chiplet Market?
A key growth driver is the adoption of high-performance computing (HPC) servers across industries, along with increasing demand for AI, cloud computing, and data center applications requiring scalable and energy-efficient chip architectures.
Which companies are leading the Chiplet Market?
Key players include Intel Corporation, Advanced Micro Devices (AMD), Apple Inc., IBM, and Marvell Technology.
Which industry segment is expected to drive significant demand for chiplets?
The enterprise electronics sector is expected to hold the largest market share due to increasing demand for AI infrastructure, cloud computing, data centers, and high-performance computing solutions.
Which packaging technology is gaining the most traction in the Chiplet Market?
2.5D/3D packaging technology is projected to experience the highest growth due to its ability to provide superior performance, bandwidth, miniaturization, and power efficiency.
Which region is expected to dominate the Chiplet Market?
Asia Pacific is expected to hold the largest market share due to the presence of major semiconductor manufacturing hubs such as China, Taiwan, South Korea, and Japan, along with growing investments in AI and 5G technologies.
What does the report analysis indicate about the future of the Chiplet Market?
The report highlights strong growth opportunities driven by AI workloads, data center expansion, advanced packaging innovation, semiconductor investments, and increasing adoption of modular chip architectures. The market is expected to become a key enable
Need a Tailored Report?
Customize this report to your needs
Get 10% FREE Customization
Customize This ReportPersonalize This Research
- Triangulate with your Own Data
- Get Data as per your Format and Definition
- Gain a Deeper Dive on a Specific Application, Geography, Customer or Competitor
- Any level of Personalization
Let Us Help You
- What are the Known and Unknown Adjacencies Impacting the Chiplet Market
- What will your New Revenue Sources be?
- Who will be your Top Customer; what will make them switch?
- Defend your Market Share or Win Competitors
- Get a Scorecard for Target Partners

Custom Market Research Services
We Will Customise The Research For You, In Case The Report Listed Above Does Not Meet With Your Requirements
Get 10% Free CustomisationTESTIMONIALS

Tetsuya Ohhira
Business Development Manager-Technology Business
Nikon Corporation,
Leading Japanese MNC specializing in optics and imaging productswww.nikon.com
MarketsandMarkets™ response
is quick. Their attitude is flexible and positive. Analyst Insights are globally considered and
significant. Client Services quickly respond to our inquiry and demand. Their wide range of global
surveys help us make our strategic plan.
We hope Knowledge Store will be easier to search
for a report.
VP - Marketing & Business Development
Leading Provider of Process Control Solutions
We engaged with MarketsandMarkets on a study to perform an analysis and recommend a Go-To-Market strategy for metrology and process control in the semiconductor market. The study was tailored to our targets and needs with well-defined milestones. Our overall experience with the MarketsandMarkets team was very good throughout the project in all aspects including the analysis methodologies used, the quality and depth of primary and secondary data sets, the professionalism and flexibility of the team and the ability to meet the target schedule and milestones. We want to thank MarketsandMarkets team for a job well done.
Growth opportunities and latent adjacency in Chiplet Market


Elijah
Apr, 2026
Does the report analyze the impact of geopolitical factors, tariffs, and trade regulations on supply chains and investment decisions?.
Joe
Apr, 2026
Will the report analyze how chiplet adoption is transforming performance efficiency and cost optimization in next-generation semiconductors?.