Cloud Applications Market by Application (ERP, CRM, HCM, SCM, Content Management, BI and Analytics), Organization Size, Vertical (BFSI, Manufacturing, Government & Public Sector, and Telecommunications), and Region Global Forecast to 2025


Updated on : March 20, 2024
Cloud Applications Market Analysis
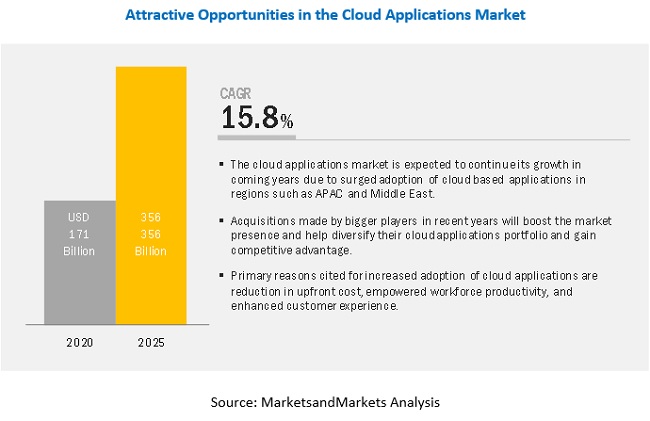
[166 Pages Report] The Cloud Applications Market size in terms of revenue was estimated to be worth around USD 171 billion in 2020 and is anticipated to rise to USD 356 billion by 2025, exhibits CAGR of 15.8% during the forecast period. The scalability and flexibility of cloud applications along with the customization provided by various cloud service providers, are helping enterprises in adopting cloud applications. Cloud services help in reducing the cost of deploying IT infrastructure, hardware, and hiring skilled resources. These benefits help enterprises focus on their core businesses and are expected to drive the adoption of cloud applications across the globe.
Cloud Applications Market Dynamics
Among applications, the supply management segment to witness high growth during the forecast period
The adoption of cloud Supply chain Management (SCM) among SMEs and large enterprises has increased to manage and oversee the supply chain activities in the most effective manner to reduce the cost as well as enhance and guarantee efficient operations. Cloud SCM applications provides enterprises real-time access to the enterprise data, which facilitates rapid decision-making and enhanced business processes. Cloud SCM removes the geographical barriers, as many cloud providers rely on common practices for accessing, storage, and retrieval of cloud data. Thus, enterprises have freedom of accessing data and getting updates related to SCM activities from anywhere at any device. The real-time visibility of data makes supply chain more dynamic, secure, and interactive.
Among verticals, the BFSI vertical to hold the highest market share in 2020
The Banking, Financial Services, and Insurance (BFSI) vertical is adopting digitalization initiatives at a rapid pace to meet the rising customer expectations and sustain the highly competitive market. Vendors provide an array of cloud services for banks to implement operating models for improving revenue generation, increasing customer insights, delivering market-relevant products quickly and efficiently, and helping in monetizing enterprise data assets. The banking sector needs to store and manage customers’ confidential information, such as credit card details, transaction details, and personal information. This data needs to be securely stored as losing such data might result in customer loss and may create a negative brand value in the market. This is leading to the growing adoption of cloud applications.
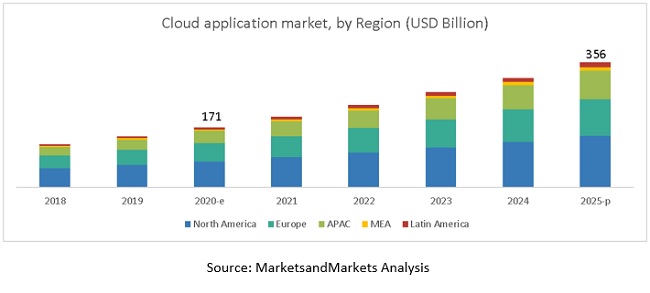
North America to hold the largest market size during the forecast period
North America is one of the leading investors in IT technologies. The presence of major economies, such as US and Canada, in the region is expected to contribute in the cloud applications market. Higher penetration rate of internet developed IT infrastructure system, and presence of highest number of cloud service providers have made the region the topmost adopter of cloud applications solutions. The enterprises operating in North American region have realized the benefit of using cloud services at earlier stage making it the key contributor in the global market during the forecast period.
Key Market Players
Major vendors in the cloud applications market include Microsoft (US), Salesforce (US), Oracle (US), SAP (Germany), Google (US), Workday (US), Adobe (US), IBM (US), Infor (US), Sage Group (UK), Intuit (US), Epicor (US), IFS (Sweden), ServiceNow (US), OpenText (US), Cisco (US), Box (US), Zoho (US), Citrix (US), LogMeIn (US), and Upland Software (US). The research report also studies strategic alliances and lucrative acquisitions among various global and local players in the cloud ecosystem. These players have majorly adopted the strategy of partnerships to enhance their business in the market. They have also launched new products to cater to the needs of diverse end users across regions.
Scope of Report
|
Report Metric |
Details |
|
Market size available for years |
2018-2025 |
|
Base year considered |
2019 |
|
Forecast period |
2020-2025 |
|
Forecast units |
Value (Billion USD) |
|
Cloud Applications Market Drivers |
|
|
Cloud Applications Market Opportunities |
|
|
Segments covered |
Applications, Organization Size, Verticals, and Regions |
|
Regions covered |
North America, Europe, APAC, MEA and Latin America |
|
Companies covered |
Microsoft (US), Salesforce (US), Oracle (US), SAP (Germany), Google (US), Workday (US), Adobe (US), IBM (US), Infor (US), Sage Group (UK), Intuit (US), Epicor (US), , IFS (Sweden), ServiceNow (US), OpenText (US), Cisco (US), Box (US), Zoho (US), Citrix (US), LogMeIn (US), and Upland Software (US). |
This research report categorizes the market to forecast revenue and analyze trends in each of the following submarkets:
Based on applications, the cloud applications market has been segmented as follows:
- Customer Relationship Management (CRM)
- Enterprise Resource Management (ERM)
- Human Capital Management (HCM)
- Content Management
- Collaboration and Productive Suites
- Supply Chain Management (SCM)
- Business Intelligence (BI) and Analytics
- Others (Project and Portfolio Management and operations and manufacturing applications)
Based on organization size, the cloud applications market has been segmented as follows:
- Small and Medium-sized Enterprises (SMEs)
- Large Enterprises
Based on verticals, the market has been segmented as follows:
- Banking, Financial Services, and Insurance (BFSI)
- Energy and Utilities
- Government and Public Sector
- Healthcare and Life Sciences
- Manufacturing
- Retail and Consumer Goods
- Telecommunications
- Transportation and Logistics
- Travel and Hospitality
- Others (education, and media and entertainment)
Based on regions, the cloud applications market has been segmented as follows:
- North America
- Europe
- APAC
- MEA
- Latin America
Key questions addressed by the report
- How is the adoption trend of cloud applications across the world?
- What are the challenges faced by the vendors operating in the cloud application market space?
- What are various developments happened in the cloud applications market?
- What are regional specific trends and developments that are shaping the adoption of cloud applications?
- What are key strategies adopted by leading vendors in the market to increase customer base?
Frequently Asked Questions (FAQ):
How big is the cloud applications market?
The global cloud applications market size was estimated at USD 171 billion in 2020 and is expected to reach USD 356 billion by 2025.
What is the cloud applications market growth?
The global cloud applications market is expected to grow at a compound annual growth rate of 15.8% from 2020 to 2025 to reach USD 356 billion by 2025.
Which region has the highest market share in the cloud applications market?
North America and Europe region have the highest market share in the cloud applications market, where these two regions together contribute more than 70% of the global cloud applications market in the year 2020.
Which application is expected to witness high adoption in the coming years?
Supply Chain Management (SCM) is expected to witness the highest adoption in the coming five years, as cloud SCM applications provides various benefits, such as real-time visibility to the enterprise data, reduced geographical barriers using remote access, rapid decision-making, multi-device compatibility, and enhanced business processes.
Who are the major vendors in the cloud applications market?
Despite the presence of a large number of vendors, the market is dominated mainly by vendors such as Microsoft (US), Salesforce (US), Oracle (US), SAP (Germany), Google (US), Workday (US), Adobe (US), IBM (US).
What are some of the latest trends that will shape the cloud applications market in the future?
The growing demand for cloud-based services and advanced technologies, increasing need to engage with customers, flexibility to work from anywhere, and deliver an enriched experience continuously are few trends that are expected to shape the market in the coming years. .
To speak to our analyst for a discussion on the above findings, click Speak to Analyst
 Exclusive indicates content/data unique to MarketsandMarkets and not available with any competitors.
TABLE OF CONTENTS
1 INTRODUCTION (Page No. - 18)
1.1 OBJECTIVES OF THE STUDY
1.2 MARKET DEFINITION
1.2.1 INCLUSIONS AND EXCLUSIONS
1.3 MARKET SCOPE
1.3.1 MARKET SEGMENTATION
1.4 YEARS CONSIDERED FOR THE STUDY
1.5 CURRENCY CONSIDERED
1.6 STAKEHOLDERS
2 RESEARCH METHODOLOGY (Page No. - 22)
2.1 RESEARCH DATA
2.1.1 SECONDARY DATA
2.1.2 PRIMARY DATA
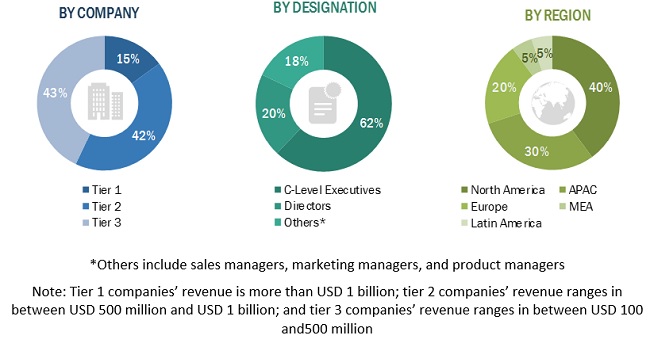
2.1.2.1 Breakup of primary profiles
2.1.2.2 Key industry insights
2.2 MARKET BREAKUP AND DATA TRIANGULATION
2.3 MARKET SIZE ESTIMATION
2.4 ASSUMPTIONS FOR THE STUDY
2.5 LIMITATIONS OF THE STUDY
3 EXECUTIVE SUMMARY (Page No. - 29)
4 PREMIUM INSIGHTS (Page No. - 33)
4.1 ATTRACTIVE OPPORTUNITIES IN THE MARKET
4.2 CLOUD APPLICATIONS MARKET, BY APPLICATION (2020 VS. 2025)
4.3 MARKET, BY ORGANIZATION SIZE (2020 VS. 2025)
4.4 MARKET, BY VERTICAL (2020 VS. 2025)
5 MARKET OVERVIEW AND INDUSTRY TRENDS (Page No. - 35)
5.1 INTRODUCTION
5.2 MARKET DYNAMICS
5.2.1 DRIVERS
5.2.1.1 Growing focus on delivering enhanced customer experience
5.2.1.2 Business expansions by large vendors across different geographies to acquire untapped customer base
5.2.1.3 Increased awareness of the benefits of cloud and its adjacent technologies among enterprises
5.2.1.4 Need for lower operational costs, scalability, and simplified application updates
5.2.2 RESTRAINTS
5.2.2.1 Data security concerns and threats from cyber attacks
5.2.2.2 Limited bandwidth providers and lack of access to high-speed internet in large number of countries
5.2.3 OPPORTUNITIES
5.2.3.1 Rising number of start-ups and SMEs in economically developing countries to create new revenue streams for cloud vendors
5.2.3.2 Telecom service providers leveraging existing infrastructure to offer cloud-based services
5.2.4 CHALLENGES
5.2.4.1 Difficulty in managing regulatory frameworks and compliance policy needs
5.2.4.2 Higher possibilities of vendor lock-in
6 CLOUD APPLICATIONS MARKET, BY APPLICATION (Page No. - 39)
6.1 INTRODUCTION
6.2 CUSTOMER RELATIONSHIP MANAGEMENT
6.2.1 CUSTOMER RELATIONSHIP MANAGEMENT: MARKET DRIVERS
6.3 ENTERPRISE RESOURCE MANAGEMENT
6.3.1 ENTERPRISE RESOURCE MANAGEMENT: MARKET DRIVERS
6.4 HUMAN CAPITAL MANAGEMENT
6.4.1 HUMAN CAPITAL MANAGEMENT: MARKET DRIVERS
6.5 CONTENT MANAGEMENT
6.5.1 CONTENT MANAGEMENT: MARKET DRIVERS
6.6 COLLABORATION AND PRODUCTIVITY SUITES
6.6.1 COLLABORATION AND PRODUCTIVITY SUITES: MARKET DRIVERS
6.7 SUPPLY CHAIN MANAGEMENT
6.7.1 SUPPLY CHAIN MANAGEMENT: MARKET DRIVERS
6.8 BUSINESS INTELLIGENCE AND ANALYTICS
6.8.1 BUSINESS INTELLIGENCE AND ANALYTICS: MARKET DRIVERS
6.9 OTHER APPLICATIONS
7 CLOUD APPLICATIONS MARKET, BY ORGANIZATION SIZE (Page No. - 52)
7.1 INTRODUCTION
7.2 LARGE ENTERPRISES
7.2.1 LARGE ENTERPRISES: MARKET DRIVERS
7.3 SMALL AND MEDIUM-SIZED ENTERPRISES
7.3.1 SMALL AND MEDIUM-SIZED ENTERPRISES: MARKET DRIVERS
8 CLOUD APPLICATIONS MARKET, BY VERTICAL (Page No. - 56)
8.1 INTRODUCTION
8.2 BANKING, FINANCIAL SERVICES, AND INSURANCE
8.2.1 BANKING, FINANCIAL SERVICES, AND INSURANCE: MARKET DRIVERS
8.3 ENERGY AND UTILITIES
8.3.1 ENERGY AND UTILITIES: MARKET DRIVERS
8.4 GOVERNMENT AND PUBLIC SECTOR
8.4.1 GOVERNMENT AND PUBLIC SECTOR: MARKET DRIVERS
8.5 HEALTHCARE AND LIFE SCIENCES
8.5.1 HEALTHCARE AND LIFE SCIENCES: MARKET DRIVERS
8.6 MANUFACTURING
8.6.1 MANUFACTURING: MARKET DRIVERS
8.7 RETAIL AND CONSUMER GOODS
8.7.1 RETAIL AND CONSUMER GOODS: MARKET DRIVERS
8.8 TELECOMMUNICATIONS
8.8.1 TELECOMMUNICATIONS: MARKET DRIVERS
8.9 TRANSPORTATION AND LOGISTICS
8.9.1 TRANSPORTATION AND LOGISTICS: MARKET DRIVERS
8.10 TRAVEL AND HOSPITALITY
8.10.1 TRAVEL AND HOSPITALITY: MARKET DRIVERS
8.11 OTHER VERTICALS
9 CLOUD APPLICATIONS MARKET, BY REGION (Page No. - 72)
9.1 INTRODUCTION
9.2 NORTH AMERICA
9.2.1 UNITED STATES
9.2.1.1 United States: market drivers
9.2.2 CANADA
9.2.2.1 Canada: market drivers
9.3 EUROPE
9.3.1 UNITED KINGDOM
9.3.1.1 United Kingdom: market drivers
9.3.2 GERMANY
9.3.2.1 Germany: market drivers
9.3.3 FRANCE
9.3.3.1 France: market drivers
9.3.4 SPAIN
9.3.5 ITALY
9.3.6 REST OF EUROPE
9.4 ASIA PACIFIC
9.4.1 CHINA
9.4.1.1 China: market drivers
9.4.2 JAPAN
9.4.2.1 Japan: market drivers
9.4.3 AUSTRALIA
9.4.3.1 Australia: market drivers
9.4.4 SINGAPORE
9.4.4.1 Singapore: market drivers
9.4.5 INDIA
9.4.5.1 India: Cloud applications market drivers
9.4.6 REST OF ASIA PACIFIC
9.5 MIDDLE EAST AND AFRICA
9.5.1 SAUDI ARABIA
9.5.1.1 Saudi Arabia: market drivers
9.5.2 UNITED ARAB EMIRATES
9.5.2.1 United Arab Emirates: market drivers
9.5.3 QATAR
9.5.3.1 Qatar: market drivers
9.5.4 SOUTH AFRICA
9.5.4.1 South Africa: market drivers
9.5.5 REST OF MIDDLE EAST AND AFRICA
9.6 LATIN AMERICA
9.6.1 BRAZIL
9.6.1.1 Brazil: market drivers
9.6.2 MEXICO
9.6.2.1 Mexico: market drivers
9.6.3 REST OF LATIN AMERICA
10 COMPETITIVE LANDSCAPE (Page No. - 115)
10.1 INTRODUCTION
10.2 COMPETITIVE SCENARIO
10.2.1 NEW PRODUCT LAUNCHES
10.2.2 ACQUISITIONS
10.2.3 PARTNERSHIPS
10.2.4 BUSINESS EXPANSIONS
11 COMPANY PROFILES (Page No. - 121)
11.1 INTRODUCTION
(Business Overview, Application, Key Insights, Recent Developments*
11.2 MICROSOFT
11.3 SALESFORCE
11.4 ORACLE
11.5 SAP
11.6 GOOGLE
11.7 WORKDAY
11.8 ADOBE
11.9 IBM
11.10 INFOR
11.11 SAGE
11.12 INTUIT
11.13 OPENTEXT
11.14 CISCO
11.15 BOX
11.16 ZOHO
11.17 CITRIX
11.18 EPICOR
11.19 UPLAND SOFTWARE
11.20 SERVICENOW
11.21 IFS
11.22 LOGMEIN
*Details on Business Overview, Application, Key Insights, Recent Developments, might not be captured in case of unlisted companies.
12 APPENDIX (Page No. - 159)
12.1 DISCUSSION GUIDE
12.2 KNOWLEDGE STORE: MARKETSANDMARKETS’ SUBSCRIPTION PORTAL
12.3 AVAILABLE CUSTOMIZATIONS
12.4 RELATED REPORTS
12.5 AUTHOR DETAILS
LIST OF TABLES (106 Tables)
TABLE 1 UNITED STATES DOLLAR EXCHANGE RATE, 2016–2018
TABLE 2 CLOUD APPLICATIONS MARKET SIZE, BY APPLICATION, 2018–2025 (USD MILLION)
TABLE 3 CUSTOMER RELATIONSHIP MANAGEMENT: CLOUD APPLICATIONS MARKET SIZE, BY REGION, 2018–2025 (USD MILLION)
TABLE 4 CUSTOMER RELATIONSHIP MANAGEMENT: MARKET SIZE, BY ORGANIZATION SIZE, 2018–2025 (USD MILLION)
TABLE 5 ENTERPRISE RESOURCE MANAGEMENT: MARKET SIZE, BY REGION, 2018–2025 (USD MILLION)
TABLE 6 ENTERPRISE RESOURCE MANAGEMENT: MARKET SIZE, BY ORGANIZATION SIZE, 2018–2025 (USD MILLION)
TABLE 7 HUMAN CAPITAL MANAGEMENT: MARKET SIZE, BY REGION, 2018–2025 (USD MILLION)
TABLE 8 HUMAN CAPITAL MANAGEMENT: MARKET SIZE, BY ORGANIZATION SIZE, 2018–2025 (USD MILLION)
TABLE 9 CONTENT MANAGEMENT: MARKET SIZE, BY REGION, 2018–2025 (USD MILLION)
TABLE 10 CONTENT MANAGEMENT: MARKET SIZE, BY ORGANIZATION SIZE, 2018–2025 (USD MILLION)
TABLE 11 COLLABORATION AND PRODUCTIVITY SUITES: MARKET SIZE, BY REGION, 2018–2025 (USD MILLION)
TABLE 12 COLLABORATION AND PRODUCTIVITY SUITES: MARKET SIZE, BY ORGANIZATION SIZE, 2018–2025 (USD MILLION)
TABLE 13 SUPPLY CHAIN MANAGEMENT: MARKET SIZE, BY REGION, 2018–2025 (USD MILLION)
TABLE 14 SUPPLY CHAIN MANAGEMENT: MARKET SIZE, BY ORGANIZATION SIZE, 2018–2025 (USD MILLION)
TABLE 15 BUSINESS INTELLIGENCE AND ANALYTICS: MARKET SIZE, BY REGION, 2018–2025 (USD MILLION)
TABLE 16 BUSINESS INTELLIGENCE AND ANALYTICS: MARKET SIZE, BY ORGANIZATION SIZE, 2018–2025 (USD MILLION)
TABLE 17 OTHER APPLICATIONS: MARKET SIZE, BY REGION, 2018–2025 (USD MILLION)
TABLE 18 OTHER APPLICATIONS: MARKET SIZE, BY ORGANIZATION SIZE, 2018–2025 (USD MILLION)
TABLE 19 CLOUD APPLICATIONS MARKET SIZE, BY ORGANIZATION SIZE, 2018–2025 (USD MILLION)
TABLE 20 LARGE ENTERPRISES: MARKET SIZE, BY REGION, 2018–2025 (USD MILLION)
TABLE 21 SMALL AND MEDIUM-SIZED ENTERPRISES: MARKET SIZE, BY REGION, 2018–2025 (USD MILLION)
TABLE 22 CLOUD APPLICATIONS MARKET SIZE, BY VERTICAL, 2018–2025 (USD MILLION)
TABLE 23 BANKING, FINANCIAL SERVICES, AND INSURANCE: MARKET SIZE, BY REGION, 2018–2025 (USD MILLION)
TABLE 24 BANKING, FINANCIAL SERVICES, AND INSURANCE: MARKET SIZE, BY ORGANIZATION SIZE, 2018–2025 (USD MILLION)
TABLE 25 ENERGY AND UTILITIES: MARKET SIZE, BY REGION, 2018–2025 (USD MILLION)
TABLE 26 ENERGY AND UTILITIES: MARKET SIZE, BY ORGANIZATION SIZE, 2018–2025 (USD MILLION)
TABLE 27 GOVERNMENT AND PUBLIC SECTOR: MARKET SIZE, BY REGION, 2018–2025 (USD MILLION)
TABLE 28 GOVERNMENT AND PUBLIC SECTOR: MARKET SIZE, BY ORGANIZATION SIZE, 2018–2025 (USD MILLION)
TABLE 29 HEALTHCARE AND LIFE SCIENCES: MARKET SIZE, BY REGION, 2018–2025 (USD MILLION)
TABLE 30 HEALTHCARE AND LIFE SCIENCES: MARKET SIZE, BY ORGANIZATION SIZE, 2018–2025 (USD MILLION)
TABLE 31 MANUFACTURING: MARKET SIZE, BY REGION, 2018–2025 (USD MILLION)
TABLE 32 MANUFACTURING: MARKET SIZE, BY ORGANIZATION SIZE, 2018–2025 (USD MILLION)
TABLE 33 RETAIL AND CONSUMER GOODS: MARKET SIZE, BY REGION, 2018–2025 (USD MILLION)
TABLE 34 RETAIL AND CONSUMER GOODS: MARKET SIZE, BY ORGANIZATION SIZE, 2018–2025 (USD MILLION)
TABLE 35 TELECOMMUNICATIONS: MARKET SIZE, BY REGION, 2018–2025 (USD MILLION)
TABLE 36 TELECOMMUNICATIONS: MARKET SIZE, BY ORGANIZATION SIZE, 2018–2025 (USD MILLION)
TABLE 37 TRANSPORTATION AND LOGISTICS: MARKET SIZE, BY REGION, 2018–2025 (USD MILLION)
TABLE 38 TRANSPORTATION AND LOGISTICS: MARKET SIZE, BY ORGANIZATION SIZE, 2018–2025 (USD MILLION)
TABLE 39 TRAVEL AND HOSPITALITY: MARKET SIZE, BY REGION, 2018–2025 (USD MILLION)
TABLE 40 TRAVEL AND HOSPITALITY: MARKET SIZE, BY ORGANIZATION SIZE, 2018–2025 (USD MILLION)
TABLE 41 OTHER VERTICALS: MARKET SIZE, BY REGION, 2018–2025 (USD MILLION)
TABLE 42 OTHER VERTICALS: MARKET SIZE, BY ORGANIZATION SIZE, 2018–2025 (USD MILLION)
TABLE 43 CLOUD APPLICATIONS MARKET SIZE, BY REGION, 2018–2025 (USD MILLION)
TABLE 44 NORTH AMERICA: CLOUD APPLICATIONS MARKET SIZE, BY APPLICATION, 2018–2025 (USD MILLION)
TABLE 45 NORTH AMERICA: MARKET SIZE, BY ORGANIZATION SIZE, 2018–2025 (USD MILLION)
TABLE 46 NORTH AMERICA: MARKET SIZE, BY VERTICAL, 2018–2025 (USD MILLION)
TABLE 47 NORTH AMERICA: MARKET SIZE, BY COUNTRY, 2018–2025 (USD MILLION)
TABLE 48 UNITED STATES: CLOUD APPLICATIONS MARKET SIZE, BY APPLICATION, 2018–2025 (USD MILLION)
TABLE 49 UNITED STATES: MARKET SIZE, BY ORGANIZATION SIZE, 2018–2025 (USD MILLION)
TABLE 50 CANADA: MARKET SIZE, BY APPLICATION, 2018–2025 (USD MILLION)
TABLE 51 CANADA: MARKET SIZE, BY ORGANIZATION SIZE, 2018–2025 (USD MILLION)
TABLE 52 EUROPE: MARKET SIZE, BY APPLICATION, 2018–2025 (USD MILLION)
TABLE 53 EUROPE: MARKET SIZE, BY ORGANIZATION SIZE, 2018–2025 (USD MILLION)
TABLE 54 EUROPE: MARKET SIZE, BY VERTICAL, 2018–2025 (USD MILLION)
TABLE 55 EUROPE: MARKET SIZE, BY COUNTRY, 2018–2025 (USD MILLION)
TABLE 56 UNITED KINGDOM: CLOUD APPLICATIONS MARKET SIZE, BY APPLICATION, 2018–2025 (USD MILLION)
TABLE 57 UNITED KINGDOM: MARKET SIZE, BY ORGANIZATION SIZE, 2018–2025 (USD MILLION)
TABLE 58 GERMANY: MARKET SIZE, BY APPLICATION, 2018–2025 (USD MILLION)
TABLE 59 GERMANY: MARKET SIZE, BY ORGANIZATION SIZE, 2018–2025 (USD MILLION)
TABLE 60 FRANCE: MARKET SIZE, BY APPLICATION, 2018–2025 (USD MILLION)
TABLE 61 FRANCE: MARKET SIZE, BY ORGANIZATION SIZE, 2018–2025 (USD MILLION)
TABLE 62 SPAIN: MARKET SIZE, BY APPLICATION, 2018–2025 (USD MILLION)
TABLE 63 SPAIN: MARKET SIZE, BY ORGANIZATION SIZE, 2018–2025 (USD MILLION)
TABLE 64 ITALY: CLOUD APPLICATIONS MARKET SIZE, BY APPLICATION, 2018–2025 (USD MILLION)
TABLE 65 ITALY: MARKET SIZE, BY ORGANIZATION SIZE, 2018–2025 (USD MILLION)
TABLE 66 REST OF EUROPE: MARKET SIZE, BY ORGANIZATION SIZE, 2018–2025 (USD MILLION)
TABLE 67 ASIA PACIFIC: MARKET SIZE, BY APPLICATION, 2018–2025 (USD MILLION)
TABLE 68 ASIA PACIFIC: MARKET SIZE, BY ORGANIZATION SIZE, 2018–2025 (USD MILLION)
TABLE 69 ASIA PACIFIC: MARKET SIZE, BY VERTICAL, 2018–2025 (USD MILLION)
TABLE 70 ASIA PACIFIC: MARKET SIZE, BY COUNTRY, 2018–2025 (USD MILLION)
TABLE 71 CHINA: MARKET SIZE, BY APPLICATION, 2018–2025 (USD MILLION)
TABLE 72 CHINA: MARKET SIZE, BY ORGANIZATION SIZE, 2018–2025 (USD MILLION)
TABLE 73 JAPAN: CLOUD APPLICATIONS MARKET SIZE, BY APPLICATION, 2018–2025 (USD MILLION)
TABLE 74 JAPAN: MARKET SIZE, BY ORGANIZATION SIZE, 2018–2025 (USD MILLION)
TABLE 75 AUSTRALIA: MARKET SIZE, BY APPLICATION, 2018–2025 (USD MILLION)
TABLE 76 AUSTRALIA: MARKET SIZE, BY ORGANIZATION SIZE, 2018–2025 (USD MILLION)
TABLE 77 SINGAPORE: MARKET SIZE, BY APPLICATION, 2018–2025 (USD MILLION)
TABLE 78 SINGAPORE: MARKET SIZE, BY ORGANIZATION SIZE, 2018–2025 (USD MILLION)
TABLE 79 INDIA: MARKET SIZE, BY APPLICATION, 2018–2025 (USD MILLION)
TABLE 80 INDIA: MARKET SIZE, BY ORGANIZATION SIZE, 2018–2025 (USD MILLION)
TABLE 81 REST OF ASIA PACIFIC: MARKET SIZE, BY ORGANIZATION SIZE, 2018–2025 (USD MILLION)
TABLE 82 MIDDLE EAST AND AFRICA: MARKET SIZE, BY APPLICATION, 2018–2025 (USD MILLION)
TABLE 83 MIDDLE EAST AND AFRICA: MARKET SIZE, BY ORGANIZATION SIZE, 2018–2025 (USD MILLION)
TABLE 84 MIDDLE EAST AND AFRICA: MARKET SIZE, BY VERTICAL, 2018–2025 (USD MILLION)
TABLE 85 MIDDLE EAST AND AFRICA: MARKET SIZE, BY COUNTRY, 2018–2025 (USD MILLION)
TABLE 86 SAUDI ARABIA: MARKET SIZE, BY ORGANIZATION SIZE, 2018–2025 (USD MILLION)
TABLE 87 UNITED ARAB EMIRATES: CLOUD APPLICATIONS MARKET SIZE, BY ORGANIZATION SIZE, 2018–2025 (USD MILLION)
TABLE 88 QATAR: MARKET SIZE, BY ORGANIZATION SIZE, 2018–2025 (USD MILLION)
TABLE 89 SOUTH AFRICA: MARKET SIZE, BY APPLICATION, 2018–2025 (USD MILLION)
TABLE 90 SOUTH AFRICA: MARKET SIZE, BY ORGANIZATION SIZE, 2018–2025 (USD MILLION)
TABLE 91 REST OF MIDDLE EAST AND AFRICA: MARKET SIZE, BY APPLICATION, 2018–2025 (USD MILLION)
TABLE 92 REST OF MIDDLE EAST AND AFRICA: MARKET SIZE, BY ORGANIZATION SIZE, 2018–2025 (USD MILLION)
TABLE 93 LATIN AMERICA: MARKET SIZE, BY APPLICATION, 2018–2025 (USD MILLION)
TABLE 94 LATIN AMERICA: MARKET SIZE, BY ORGANIZATION SIZE, 2018–2025 (USD MILLION)
TABLE 95 LATIN AMERICA: MARKET SIZE, BY VERTICAL, 2018–2025 (USD MILLION)
TABLE 96 LATIN AMERICA: MARKET SIZE, BY COUNTRY, 2018–2025 (USD MILLION)
TABLE 97 BRAZIL: CLOUD APPLICATIONS MARKET SIZE, BY APPLICATION, 2018–2025 (USD MILLION)
TABLE 98 BRAZIL: MARKET SIZE, BY ORGANIZATION SIZE, 2018–2025 (USD MILLION)
TABLE 99 MEXICO: MARKET SIZE, BY APPLICATION, 2018–2025 (USD MILLION)
TABLE 100 MEXICO: MARKET SIZE, BY ORGANIZATION SIZE, 2018–2025 (USD MILLION)
TABLE 101 REST OF LATIN AMERICA: MARKET SIZE, BY APPLICATION, 2018–2025 (USD MILLION)
TABLE 102 REST OF LATIN AMERICA: MARKET SIZE, BY ORGANIZATION SIZE, 2018–2025 (USD MILLION)
TABLE 103 NEW PRODUCT LAUNCHES, 2018–2020
TABLE 104 ACQUISITIONS, 2018–2019
TABLE 105 PARTNERSHIPS, 2018–2020
TABLE 106 BUSINESS EXPANSIONS, 2018–2020
LIST OF FIGURES (32 Figures)
FIGURE 1 CLOUD APPLICATIONS MARKET: RESEARCH DESIGN
FIGURE 2 MARKET: TOP-DOWN AND BOTTOM-UP APPROACHES
FIGURE 3 MARKET SIZE ESTIMATION METHODOLOGY – APPROACH 1 (TOP-DOWN): REVENUE GENERATED THROUGH DIFFERENT CLOUD COMPUTING DELIVERY MODELS
FIGURE 4 MARKET SIZE ESTIMATION METHODOLOGY – APPROACH 2 (BOTTOM-UP): REVENUE GENERATED BY VENDORS FROM EACH CLOUD APPLICATION SEGMENT
FIGURE 5 CLOUD APPLICATIONS MARKET SNAPSHOT, 2018–2025
FIGURE 6 TOP SEGMENTS WITH HIGH GROWTH RATES DURING THE FORECAST PERIOD
FIGURE 7 CUSTOMER RELATIONSHIP MANAGEMENT SEGMENT TO HOLD THE LARGEST MARKET SIZE DURING THE FORECAST PERIOD
FIGURE 8 LARGE ENTERPRISES SEGMENT TO HOLD A LARGER MARKET SIZE DURING THE FORECAST PERIOD
FIGURE 9 BANKING, FINANCIAL SERVICES, AND INSURANCE VERTICAL TO HOLD THE LARGEST MARKET SIZE DURING THE FORECAST PERIOD
FIGURE 10 NORTH AMERICA TO ACCOUNT FOR THE LARGEST MARKET SHARE IN 2020
FIGURE 11 REDUCED APPLICATION DEPLOYMENT COSTS, SIMPLIFIED CONSUMPTION OF CLOUD APPLICATIONS, AND DIGITAL INITIATIVES BY REGIONAL GOVERNMENTS AND BUSINESS EXPANSIONS BY WELL-ESTABLISHED PLAYERS TO DRIVE ADOPTION OF CLOUD APPLICATIONS WORLDWIDE
FIGURE 12 CUSTOMER RELATIONSHIP MANAGEMENT SEGMENT TO ACCOUNT FOR THE HIGHEST MARKET SHARE DURING THE FORECAST PERIOD
FIGURE 13 LARGE ENTERPRISES SEGMENT TO ACCOUNT FOR A HIGHER MARKET SHARE DURING THE FORECAST PERIOD
FIGURE 14 BANKING, FINANCIAL SERVICES, AND INSURANCE VERTICAL TO HOLD THE HIGHEST MARKET SHARE DURING THE FORECAST PERIOD
FIGURE 15 DRIVERS, RESTRAINTS, OPPORTUNITIES, AND CHALLENGES: CLOUD APPLICATIONS MARKET
FIGURE 16 CUSTOMER RELATIONSHIP MANAGEMENT SEGMENT TO GROW AT THE HIGHEST RATE DURING THE FORECAST PERIOD
FIGURE 17 SMALL AND MEDIUM-SIZED ENTERPRISES SEGMENT TO GROW AT A HIGHER GROWTH RATE DURING THE FORECAST PERIOD
FIGURE 18 RETAIL AND CONSUMER GOODS VERTICAL TO GROW AT THE HIGHEST GROWTH RATE DURING THE FORECAST PERIOD
FIGURE 19 ASIA PACIFIC TO GROW AT THE HIGHEST GROWTH RATE DURING THE FORECAST PERIOD
FIGURE 20 NORTH AMERICA: MARKET SNAPSHOT
FIGURE 21 ASIA PACIFIC: MARKET SNAPSHOT
FIGURE 22 KEY DEVELOPMENTS BY THE LEADING PLAYERS IN THE CLOUD APPLICATIONS MARKET DURING 2018–2020
FIGURE 23 MICROSOFT: COMPANY SNAPSHOT
FIGURE 24 SALESFORCE: COMPANY SNAPSHOT
FIGURE 25 ORACLE: COMPANY SNAPSHOT
FIGURE 26 SAP: COMPANY SNAPSHOT
FIGURE 27 GOOGLE: COMPANY SNAPSHOT
FIGURE 28 WORKDAY: COMPANY SNAPSHOT
FIGURE 29 ADOBE: COMPANY SNAPSHOT
FIGURE 30 IBM: COMPANY SNAPSHOT
FIGURE 31 INFOR: COMPANY SNAPSHOT
FIGURE 32 SAGE: COMPANY SNAPSHOT
The study involved four major activities in estimating the current market size of the cloud applications market. Exhaustive secondary research was done to collect information on the market. The next step was to validate these findings, assumptions, and sizing with industry experts across the value chain using primary research. Both top-down and bottom-up approaches were employed to estimate the total market size. After that, the market breakup and data triangulation procedures were used to estimate the market size of the segments and subsegments of the market.
Secondary Research
In the secondary research process, various secondary sources, such as D&B Hoovers, Bloomberg BusinessWeek, DiscoverOrg, and Factiva, have been referred to identify and collect information for this study. These secondary sources included annual reports, press releases, and investor presentations of companies; whitepapers, certified publications, and articles by recognized authors; gold standard and silver standard websites; regulatory bodies; trade directories; and databases.
Primary Research
The cloud applications market comprises several stakeholders, such as cloud application vendors, cloud solution providers, cloud service brokers, system integrators, consulting service providers, managed service providers, resellers and distributors, research organizations, government agencies, enterprise users, venture capitalists, private equity firms, and start-up companies. The demand side of the market consists of enterprises from different end users, such as Banking, Financial Services, and Insurance (BFSI); energy and utilities; government and public sector; healthcare and life sciences; manufacturing; retail and consumer goods; telecommunications; transportations and logistics; travel and hospitality; and others (education, and media and entertainment). The supply side includes cloud application and software providers offering cloud applications, software, and services. Various primary sources from both the supply and demand sides of the market were interviewed to obtain qualitative and quantitative information. Following is the breakup of the primary respondents:
To know about the assumptions considered for the study, download the pdf brochure
Market Size Estimation
Both top-down and bottom-up approaches were used to estimate and validate the total size of the cloud applications market. These methods were also used extensively to determine the extent of various subsegments in the market. The research methodology used to estimate the market size includes the following:
- The key players in different industries and markets have been identified through extensive secondary research.
- The industry’s supply chain and market size, in terms of value, have been determined through primary and secondary research processes.
- All percentage shares, splits, and breakups have been determined using secondary sources and verified through primary sources.
Data Triangulation
After arriving at the overall market size using the market size estimation processes as explained above, the market was split into several segments and subsegments. To complete the overall market engineering process and arrive at the exact statistics of each market segment and subsegment, the data triangulation and market breakup procedures were employed, wherever applicable. The data was triangulated by studying various factors and trends from both the demand and supply sides.
Report Objectives
- To define, describe, and forecast the cloud applications market by application, organization size, vertical, and region
- To provide detailed information related to the major factors (drivers, restraints, opportunities, and challenges) influencing the growth of the market
- To analyze micromarkets with respect to individual growth trends, prospects, and contributions to the total market
- To analyze the opportunities in the market for stakeholders by identifying the high-growth segments of the market
- To forecast the size of the market segments for regions, such as North America, Europe, Asia Pacific (APAC), Middle East and Africa (MEA) and Latin America
- To profile the key players of the global cloud applications market and comprehensively analyze their market size and core competencies in the market
- To track and analyze competitive developments, such as new product launches, business expansions, acquisitions, partnerships, and agreements, in the market
Available customizations
With the given market data, MarketsandMarkets offers customizations as per the company’s specific needs. The following customization options are available for the report:
Company Information:
- Detailed analysis and profiling of additional market players


Growth opportunities and latent adjacency in Cloud Applications Market