Cloud-based Quantum Computing Market by Offering, Technology (Trapped Ions, Quantum Annealing, Superconducting Qubits), Application (Optimization, Simulation and Modeling, Sampling, Encryption), Vertical and Region - Global Forecast to 2028
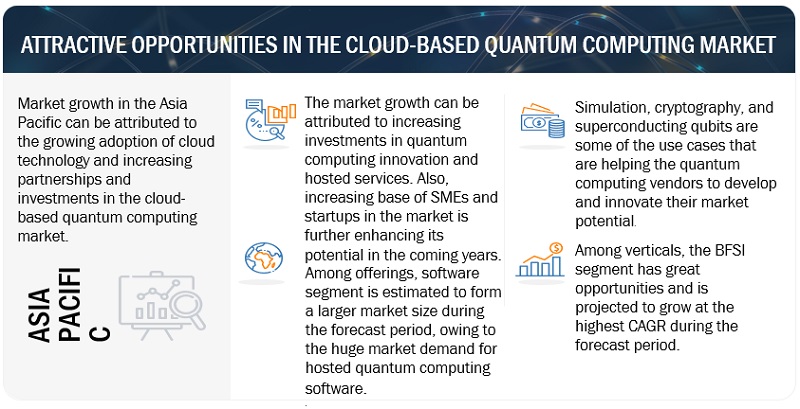
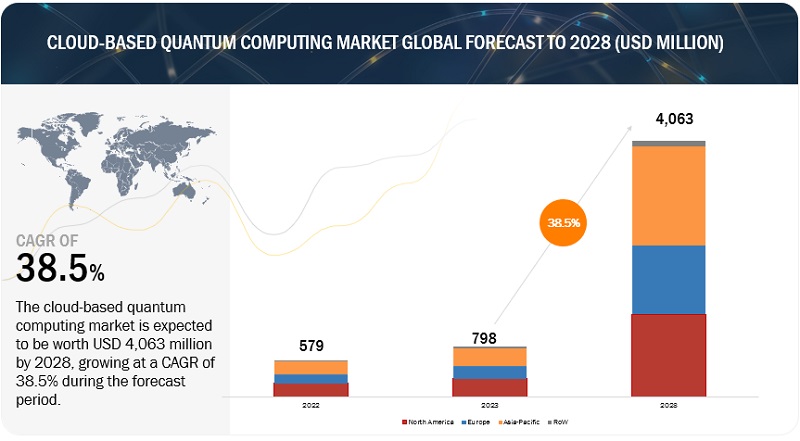
The global cloud-based quantum computing market size was estimated at USD 798 million in 2023 and is expected to reach USD 4,063 million in 2028, at a compound annual growth rate (CAGR) of 38.5%. Increasing accessibility of quantum computers using cloud technology is one of the factors expected to contribute to the growth of the cloud-based quantum computing market.
To know about the assumptions considered for the study, Request for Free Sample Report
To know about the assumptions considered for the study, download the pdf brochure
Cloud-based Quantum Computing Market Dynamics
Driver: Accessibility of quantum computers using cloud technology
The quantum computing field comprises aspects of mathematics, physics, and computer science and utilizes mechanics to solve problems. The time involved in solving complex issues is less than that of classical computers. Some applications where quantum computers can boost speed include machine learning, optimization, and simulation of physical systems. A cloud quantum computer is accessible in a cloud environment through a network. Quantum cloud computing enables users to connect directly to quantum processors, emulators, and simulators. Vendors provide programming languages and documentation for implementing quantum computing applications differently. Research and education are one of the verticals in which cloud-based quantum computing is utilized. Researchers use cloud-based quantum computing mainly to test their algorithms. Quantum algorithms are initially created on conventional computers and tested on real quantum computers via the cloud. Quantum computing has a high cost and technical barrier to entry; therefore, its deployment is limited. The systems are costly and time-consuming to develop, deploy, and maintain. Organizations already using quantum computing technology employ cloud-based quantum computing via their build platforms.
Restraint: Stability and error correction issues
Presently, quantum computers use error-prone physical qubits. It is estimated that 1,000 physical qubits are required to make a single logical qubit error-free. Till 2020, devices with 5,000 physical qubits have been developed. However, a commercially valuable quantum computer is expected to be a 200-logical qubit machine with 200,000 physical qubits. Commercializing quantum computers is a complex task. It is impossible to maintain the quantum mechanical state of qubits for a long time as they are delicate and can be easily disrupted by changes in environmental temperature, noise, and frequency.
Moreover, several blockchain-based technologies rely on the elliptic curve digital signature algorithm (ECDSA), which is currently not quantum-safe. Noise causes the information in the qubits to become randomized, leading to algorithm errors. The greater the influence of noise, the shorter the algorithm can run before it suffers an error and outputs an incorrect result. Instead of the trillions of operations needed to run a full-fledged quantum algorithm, performing dozens before noise causes a fatal error.
Opportunity: Growing adoption of quantum computing solutions across several verticals
Quantum computing is increasingly being deployed across different verticals. For instance, Accenture Lab’s and 1QBit collaborated with Biogen to develop a first-of-its-kind quantum-enabled molecular comparison application that could significantly improve advanced molecular design to speed up drug discovery for complex neurological conditions, such as multiple sclerosis. They collaborated to create a new application that enhances Biogen’s existing molecule comparison method with quantum capabilities. The new application provides novel insights into the molecular comparison process and much deeper contextual information about how, where, and why molecules match. Additionally, quantum computing is gaining traction in the banking, financial services, and insurance (BFSI) vertical, where companies increase the speed of trade activities, transactions, and data processing.
One of the potential applications of quantum computing is simulation. Quantum computing helps to identify effective and efficient ways to manage financial risks. High-quality solutions’ processing time and costs can increase exponentially if financial institutions use conventional computers. In contrast, quantum computers can carry out operations faster at optimized prices, resulting in cost savings and new opportunities for revenue generation. The increasing adoption of quantum computing in drug discovery and finance verticals drives the adoption of cloud-based quantum computing solutions.
Challenge: Lack of Standardization
Quantum computing is still in its initial stage, and software, hardware, and programming languages have no proper standardization, which means that different vendors may operate with several hardware architectures and programming models, making it difficult for developers and researchers to create software that works across other quantum computing platforms. Standardization enables better communication and collaboration across the quantum computing industry. Standardization can be implemented across different aspects of the quantum computing industry, including standards within quantum algorithms, hardware, and software. Standards within the technology development enable faster development and better benchmarking for the research and education vertical. Using standardized terminology in the quantum industry would lead to a common language allowing better internal and external communication with stakeholders. However, standardization should be made with exquisite care, as if wielded improperly, it can significantly hinder technology development.
Cloud-based quantum computing Market Ecosystem
By verticals, research and academia segment to hold the largest market size during the forecast period
Quantum computing is an area of research combing quantum physics and computer science. n Quantum computing research studies the physical limits of information processing. Researchers from academia, national laboratories, and the quantum computing field are expected to work together in the coming years to speed up the fundamental research related to quantum information science. Various partnerships are taking place in the cloud-based quantum computing market. In May 2021, IBM announced that it partnered with 11 top-tier academic institutions, including the IISc and IIT Kharagpur, to allow over-the-cloud access to its systems to accelerate advanced training & research in quantum computing. Companies in cloud-based quantum computing are taking several initiatives. For instance, IBM launched its Quantum Educators program, which provides professors and students access to IBM quantum computers and the latest learning resources to help them schedule and experiment on quantum computers. Moreover, the Amazon Braket quantum computing service enables researchers at universities and national labs to perform experimentation with different quantum hardware technologies in one place.
By offering services segment to grow at the highest CAGR during the forecast period
Cloud-based quantum computing services use quantum computing technology to perform various tasks such as analytics, optimization, and simulation. These services are provided by cloud-based providers that offer access to quantum computing capabilities and resources. The key providers of cloud-based quantum computing services include IBM, AWS, Google, Huawei, Baidu, Microsoft, and others. Enterprises are adopting cloud-based quantum computing services to enable the efficient adoption of their solutions. Increasing the number of companies offering cloud-based quantum computing services led to its growing demand. For instance, IBM offers the Qiskit Runtime tool in the cloud-based quantum computing market. It is a quantum computing service and programming model for building, optimizing, and executing workloads at scale.
By services, professional services segment to hold the largest market size during the forecast period
Professional services are typically offered on-demand or are project-based. They provide various services, including digital transformation, business strategy, management consulting, data architecture and visualization, UX/UI design, and more. An organization uses professional services in areas such as consulting, cloud migration, deployment, and advanced troubleshooting, which are provided by consultants and industry experts by implementing cloud-based quantum computing technology.
By region, North America accounts for the largest market size during the forecast period.
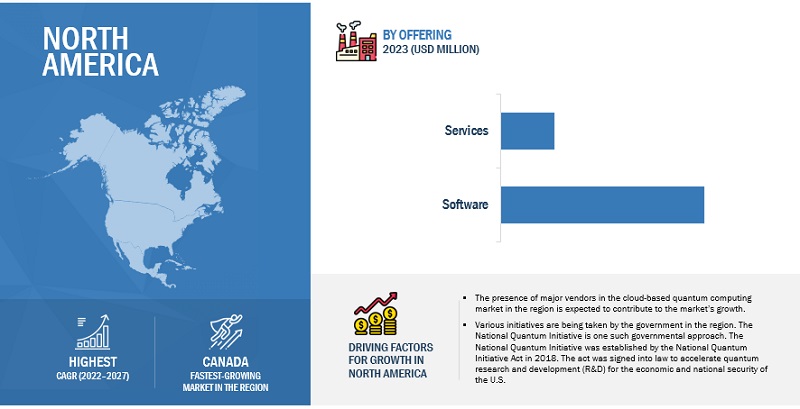
North America is one of the most advanced regions regarding security technology adoption and infrastructure. Several standards and regulations also govern this region’s cloud-based quantum computing market. Implementing such private laws has prompted organizations to adopt cloud-based quantum computing solutions. Additionally, the region has witnessed several partnerships and initiatives between organizations and governments concerning cloud-based quantum computing in recent years. The National Quantum Initiative is one such governmental approach. It aims at ensuring the continued leadership of the US in QIS and its technology applications. The National Quantum Initiative was established by the National Quantum Initiative Act in 2018. The act was signed into law to accelerate quantum R&D for the economic and national security of the United States. Increasing initiatives and partnerships are taking place in the cloud-based quantum computing market by solution vendors. For instance, in 2020, D-Wave Systems announced the availability of free access to its quantum systems via the leap quantum cloud service for anyone working on responses to the Covid-19 pandemic. This initiative came as a response to a request from the Canadian government for solutions to the pandemic across industries.
Key Market Players
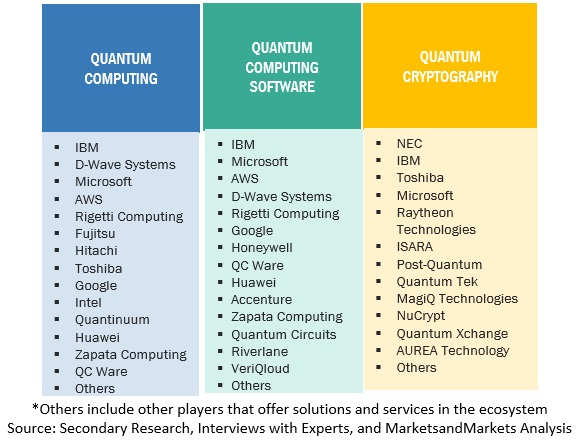
The major vendors in cloud-based quantum computing include IBM (US), Microsoft (US), Google (US), AWS (US), Baidu (China), Rigetti Computing (US), Xanadu (Canada), Oxford Quantum Circuits (UK), IonQ (US), and Zapata Computing (US).
Scope of the Report
|
Report Metrics |
Details |
|
Market size available for years |
2019-2028 |
|
Base year considered |
2022 |
|
Forecast period |
2023–2028 |
|
Market value in 2028 |
USD 4,063 Million |
|
Market value in 2023 |
USD 798 Million |
|
Market Growth Rate |
38.5% CAGR |
|
Segments Covered |
Offering, Technology, Application, and Verticals |
|
Geographies covered |
North America, Europe, Asia Pacific, Middle East & Africa, and Latin America |
|
Major companies covered |
IBM (US), Microsoft (US), Google (US), AWS (US), Baidu (China), Huawei (China), Rigetti Computing (US), Xanadu (Canada), D-Wave Systems (Canada), Oxford Quantum Circuits (UK), IonQ (US), PASQAL (France), Zapata Computing (US), Quandela (France), QpiCloud (India), ColdQuanta (US), SpinQ (China), Qilimanjaro (Spain), Arqit (UK), Terra Quantum (Switzerland), and Quantum Computing Inc. (US) |
Market Segmentation
The study categorizes the cloud-based quantum computing market based on offering, technology, application, verticals, and region.
Offering
- Software
-
Services
- Professional Services
- Managed Services
Technology
- Trapped Ions
- Quantum Annealing
- Superconducting Qubits
- Other Technologies
Application
- Optimization
- Simulation and Modeling
- Sampling
- Encryption
- Other Applications
Verticals
- Research and Academia
- BFSI
- Healthcare and Pharmaceuticals
- Aerospace and Defense
- Manufacturing
- Transportation and Logistics
- Chemicals
- Other Verticals
Region
- North America
- Europe
- Asia Pacific
- Middle East & Africa
- Latin America
Recent Developments
- In August 2022, AWS announced the general availability of Amazon Braket, a fully managed AWS service that helps customers explore and design quantum algorithms. It can be used to test and troubleshoot quantum algorithms on simulated computers running on computing resources in AWS to help them verify their implementation.
- In April 2021, AWS announced a partnership with the Hebrew University of Jerusalem. Through the AWS Cloud Credit for Research Program, AWS supports independent research using Amazon Braket at the university. Amazon Braket enables research organizations to explore quantum, classical high-performance computing (HPC), and quantum-inspired approaches to problems from the same console. In March 2023, IBM announced its partnership with T-Systems. T-Systems can now provide its customers with cloud access to IBM’s quantum systems, including multiple quantum computers powered by the 127-qubit IBM Eagle processor.
Frequently Asked Questions (FAQ):
What is the definition of Cloud-based Quantum Computing?
MarketsandMarkets defines it: “Cloud-based quantum computing typically refers to a model where a cloud provider offers access to quantum computing resources through a cloud-based platform or API. The user can access these resources remotely, but they are responsible for programming and executing their quantum algorithms. In other words, the cloud provider offers access to the hardware, but the user is responsible for the software”.
What is the projected market value of the global cloud-based quantum computing market?
The global cloud-based quantum computing market is projected to grow from an estimated value of USD 798 million in 2023 to USD 4,063 million by 2028 at a Compound Annual Growth Rate (CAGR) of 38.5% from 2023 to 2028.
Who are the key companies influencing market growth?
IBM (US), Microsoft (US), Google (US), AWS (US), Baidu (China), and Huawei (China) are the leaders in the cloud-based quantum computing market, recognized as the star players.
Which emerging startups/SMEs are significantly supporting market growth?
ColdQuanta, SpinQ, Qilimanjaro, Arqit, and Terra Quantum are emerging startups/SMEs that nurture market growth with their technical skills and expertise.
What are the technologies being used for the cloud-based quantum computing market?
High-performance computing, hybrid quantum computing, artificial intelligence, and cryptography are some technologies used in the cloud-based quantum computing market.
To speak to our analyst for a discussion on the above findings, click Speak to Analyst


- 5.1 INTRODUCTION
-
5.2 MARKET DYNAMICSDRIVERS- Accessibility of quantum computers using cloud technology- Rapid digitalization to increase use of cloud-based quantum computingRESTRAINTS- Stability and error correction issues- Limited skilled expertise for deployment and usage of cloud-based quantum computing solutionsOPPORTUNITIES- Growing adoption of quantum computing solutions across several verticals- Emergence of startups to provide cloud-based quantum computing solutionsCHALLENGES- Lack of standardization
-
5.3 ECOSYSTEM
-
5.4 TECHNOLOGY ANALYSISHIGH-PERFORMANCE COMPUTING (HPC)HYBRID QUANTUM COMPUTINGAI/MLCRYPTOGRAPHY
-
5.5 REGULATORY IMPLICATIONSP1913- SOFTWARE-DEFINED QUANTUM COMMUNICATIONP7130- STANDARD FOR QUANTUM TECHNOLOGIES DEFINITIONSP7131- STANDARD FOR QUANTUM COMPUTING PERFORMANCE METRICS AND BENCHMARKINGNATIONAL QUANTUM INITIATIVE ACTOPENQKDQUANTUM COMPUTING GOVERNANCE PRINCIPLESREGULATORY BODIES, GOVERNMENT AGENCIES, AND OTHER ORGANIZATIONS
-
5.6 PATENT ANALYSIS
-
5.7 USE CASESUSE CASE 1: OTI LUMIONICS TO ACCELERATE MATERIAL DESIGN USING MICROSOFT AZURE QUANTUMUSE CASE 2: CERN PARTNERS WITH IBM QUANTUM TO SEEK NEW WAYS OF PATTERNS IN LHC DATAUSE CASE 3: MICROSOFT COLLABORATES WITH WILLIS TOWERS WATSON TO TRANSFORM RISK-MANAGEMENT SOLUTIONS
- 5.8 PRICING ANALYSIS
-
5.9 VALUE CHAINQUANTUM COMPUTING HARDWARE MANUFACTURERSQUANTUM COMPUTING SOFTWARE VENDORSCLOUD INFRASTRUCTURE VENDORSINDEPENDENT SOFTWARE VENDORSSYSTEM INTEGRATORSEND USERS
-
5.10 PORTER'S FIVE FORCES ANALYSISTHREAT OF NEW ENTRANTSTHREAT OF SUBSTITUTESBARGAINING POWER OF SUPPLIERSBARGAINING POWER OF BUYERSINTENSITY OF COMPETITIVE RIVALRY
- 5.11 TRENDS AND DISRUPTIONS IMPACTING CUSTOMERS
-
5.12 KEY STAKEHOLDERS AND BUYING CRITERIAKEY STAKEHOLDERS IN BUYING PROCESS
- 5.13 KEY CONFERENCES AND EVENTS IN 2023–2024
- 6.1 INTRODUCTION
-
6.2 SOFTWAREINITIATIVES TO BE TAKEN BY ORGANIZATIONSSOFTWARE: MARKET DRIVERS
-
6.3 SERVICESEFFICIENT DEPLOYMENT OF CLOUD-BASED QUANTUM COMPUTING SOFTWARESERVICES: CLOUD-BASED QUANTUM COMPUTING MARKET DRIVERSPROFESSIONAL SERVICESMANAGED SERVICES
- 7.1 INTRODUCTION
-
7.2 SUPERCONDUCTING QUBITUTILIZATION OF SUPERCONDUCTING QUBITS IN QUANTUM PROCESSORS DEVELOPMENT
-
7.3 TRAPPED IONADOPTION OF TRAPPED ION TECHNOLOGY IN CLOUD QUANTUM COMPUTING
-
7.4 QUANTUM ANNEALINGQUANTUM ANNEALING TO SOLVE OPTIMIZATION PROBLEMS IN LESSER TIME
- 7.5 OTHERS
- 8.1 INTRODUCTION
-
8.2 OPTIMIZATIONGROWING USE OF QUANTUM ALGORITHMS TO TACKLE OPTIMIZATION PROBLEMS EFFECTIVELY
-
8.3 SIMULATION AND MODELINGINCREASING ADOPTION OF QUANTUM COMPUTING SIMULATION TO UNDERSTAND BEHAVIOR OF QUANTUM SYSTEMS AND DEVELOP QUANTUM ALGORITHMS
-
8.4 SAMPLINGEFFICIENT GENERATION OF RESULTS FROM DATASET
-
8.5 ENCRYPTIONINCREASING CYBERATTACKS AND RISING DEMAND FOR HYBRID AND FULLY REMOTE WORKING MODELS
- 8.6 OTHERS
- 9.1 INTRODUCTION
-
9.2 RESEARCH AND ACADEMIAGROWING INITIATIVES IN QUANTUM RESEARCHRESEARCH AND ACADEMIA: CLOUD-BASED QUANTUM COMPUTING MARKET DRIVERS
-
9.3 BFSICLOUD-BASED QUANTUM COMPUTING TO ENHANCE PROCESS OF SAFEGUARDING CUSTOMER FINANCIAL DATABFSI: CLOUD-BASED QUANTUM COMPUTING MARKET DRIVERS
-
9.4 HEALTHCARE AND PHARMACEUTICALSGROWING ADOPTION OF CLOUD TECHNOLOGYHEALTHCARE AND PHARMACEUTICALS: CLOUD-BASED QUANTUM COMPUTING MARKET DRIVERS
-
9.5 AEROSPACE AND DEFENSECLOUD-BASED QUANTUM COMPUTING TO ENHANCE PROCESS OF SECURED COMMUNICATIONSAEROSPACE AND DEFENSE: MARKET DRIVERS
-
9.6 MANUFACTURINGMANUFACTURING TO ENABLE PROCESS OPTIMIZATION AND PRODUCT DEVELOPMENTMANUFACTURING: MARKET DRIVERS
-
9.7 TRANSPORTATION AND LOGISTICSCLOUD-BASED QUANTUM COMPUTING TO OVERCOME CHALLENGES RELATED TO OPTIMIZATION OPERATIONSTRANSPORTATION AND LOGISTICS: MARKET DRIVERS
-
9.8 CHEMICALSCLOUD-BASED QUANTUM COMPUTING TO ENABLE DESIGNING OF EFFICIENT MOLECULES, POLYMERS, AND SOLIDSCHEMICALS: MARKET DRIVERS
- 9.9 OTHER VERTICALS
- 10.1 INTRODUCTION
-
10.2 NORTH AMERICANORTH AMERICA: MARKET DRIVERSNORTH AMERICA: REGULATORY LANDSCAPEUS- Presence of many cloud-based quantum computing solution vendorsCANADA- Increasing investments by government in quantum computing
-
10.3 EUROPEEUROPE: MARKET DRIVERSEUROPE: REGULATORY LANDSCAPEUK- Organizations to take initiative toward cloud-based quantum computingGERMANY- Investments by federal ministry for economic affairs and energy to develop quantum technologyFRANCE- Growing partnerships among cloud-based quantum computing solution provider organizationsREST OF EUROPE
-
10.4 ASIA PACIFICASIA PACIFIC: MARKET DRIVERSASIA PACIFIC: REGULATORY LANDSCAPECHINA- Growing use of cloud technologyJAPAN- Collaboration between universities and organizations for research and development in cloud-based quantum computingINDIA- Partnership between government and cloud service providers to develop quantum computing applications labREST OF ASIA PACIFIC
-
10.5 ROWROW: MARKET DRIVERSMIDDLE EAST AND AFRICA- Collaboration between tech-giants and academic institutions to drive growthLATIN AMERICA- Rising investment in education sector by quantum computing companies to drive growth

- 11.1 OVERVIEW
- 11.2 HISTORICAL REVENUE ANALYSIS
- 11.3 MARKET: RANKING OF KEY PLAYERS
- 11.4 MARKET SHARE ANALYSIS
-
11.5 COMPANY EVALUATION QUADRANTSTARSEMERGING LEADERSPERVASIVE PLAYERSPARTICIPANTS
-
11.6 COMPETITIVE BENCHMARKINGCOMPANY FOOTPRINT: OFFERINGCOMPANY FOOTPRINT: REGIONOVERALL COMPANY FOOTPRINT
-
11.7 STARTUPS/SMES EVALUATION QUADRANTPROGRESSIVE COMPANIESRESPONSIVE COMPANIESDYNAMIC COMPANIESSTARTING BLOCKSCOMPETITIVE BENCHMARKING FOR STARTUPS
-
11.8 COMPETITIVE SCENARIOS AND TRENDSPRODUCT LAUNCHES & ENHANCEMENTSDEALS
-
12.1 KEY PLAYERSIBM- Business overview- Products/Solutions/Services offered- Recent developments- MnM viewMICROSOFT- Business overview- Products/Solutions/Services offered- Recent developments- MnM viewGOOGLE- Business overview- Products/Solutions/Services offered- Recent developments- MnM viewAWS- Business overview- Products/Solutions/Services offered- Recent developments- MnM viewBAIDU- Business overview- Products/Solutions/Services offered- Recent developments- MnM viewHUAWEI- Business overview- Products/Solutions/Services offered- Recent developments
-
12.2 OTHER PLAYERSRIGETTI COMPUTINGXANADUD-WAVE SYSTEMSOXFORD QUANTUM CIRCUITSIONQPASQALZAPATA COMPUTINGQUANDELAQPICLOUDCOLDQUANTASPINQQILIMANJAROARQITTERRA QUANTUMQUANTUM COMPUTING INC
- 13.1 ADJACENT MARKETS
-
13.2 LIMITATIONSQUANTUM COMPUTING MARKETQUANTUM COMPUTING SOFTWARE MARKET
- 13.3 DISCUSSION GUIDE
- 13.4 KNOWLEDGESTORE: MARKETSANDMARKETS’ SUBSCRIPTION PORTAL
- 13.5 CUSTOMIZATION OPTIONS
- 13.6 RELATED REPORTS
- 13.7 AUTHOR DETAILS
- TABLE 1 USD EXCHANGE RATES, 2022
- TABLE 2 FACTOR ANALYSIS
- TABLE 3 CLOUD-BASED QUANTUM COMPUTING MARKET: ASSUMPTIONS
- TABLE 4 MARKET: LIMITATIONS
- TABLE 5 MARKET: ECOSYSTEM
- TABLE 6 LIST OF REGULATORY BODIES, GOVERNMENT AGENCIES, AND OTHER ORGANIZATIONS
- TABLE 7 MARKET: IMPACT OF PORTER'S FIVE FORCES
- TABLE 8 INFLUENCE OF STAKEHOLDERS ON BUYING PROCESS (%)
- TABLE 9 MARKET: LIST OF CONFERENCES AND EVENTS
- TABLE 10 MARKET, BY OFFERING, 2019–2022 (USD MILLION)
- TABLE 11 CLOUD-BASED QUANTUM COMPUTING MARKET, BY OFFERING, 2023–2028 (USD MILLION)
- TABLE 12 SOFTWARE: MARKET, BY REGION, 2019–2022 (USD MILLION)
- TABLE 13 SOFTWARE: MARKET, BY REGION, 2023–2028 (USD MILLION)
- TABLE 14 SERVICES: MARKET, BY REGION, 2019–2022 (USD MILLION)
- TABLE 15 SERVICES: MARKET, BY REGION, 2023–2028 (USD MILLION)
- TABLE 16 MARKET, BY SERVICE, 2019–2022 (USD MILLION)
- TABLE 17 MARKET, BY SERVICE, 2023–2028 (USD MILLION)
- TABLE 18 MARKET, BY VERTICAL, 2019–2022 (USD MILLION)
- TABLE 19 MARKET, BY VERTICAL, 2023–2028 (USD MILLION)
- TABLE 20 RESEARCH AND ACADEMIA: MARKET, BY REGION, 2019–2022 (USD MILLION)
- TABLE 21 RESEARCH AND ACADEMIA: MARKET, BY REGION, 2023–2028 (USD MILLION)
- TABLE 22 BFSI: MARKET, BY REGION, 2019–2022 (USD MILLION)
- TABLE 23 BFSI: MARKET, BY REGION, 2023–2028 (USD MILLION)
- TABLE 24 HEALTHCARE AND PHARMACEUTICALS: MARKET, BY REGION, 2019–2022 (USD MILLION)
- TABLE 25 HEALTHCARE AND PHARMACEUTICALS: MARKET, BY REGION, 2023–2028 (USD MILLION)
- TABLE 26 AEROSPACE AND DEFENSE: MARKET, BY REGION, 2019–2022 (USD MILLION)
- TABLE 27 AEROSPACE AND DEFENSE: MARKET, BY REGION, 2023–2028 (USD MILLION)
- TABLE 28 MANUFACTURING: MARKET, BY REGION, 2019–2022 (USD MILLION)
- TABLE 29 MANUFACTURING: MARKET, BY REGION, 2023–2028 (USD MILLION)
- TABLE 30 TRANSPORTATION AND LOGISTICS: MARKET, BY REGION, 2019–2022 (USD MILLION)
- TABLE 31 TRANSPORTATION AND LOGISTICS: MARKET, BY REGION, 2023–2028 (USD MILLION)
- TABLE 32 CHEMICALS: MARKET, BY REGION, 2019–2022 (USD MILLION)
- TABLE 33 CHEMICALS: MARKET, BY REGION, 2023–2028 (USD MILLION)
- TABLE 34 CLOUD-BASED QUANTUM COMPUTING MARKET, BY REGION, 2019–2022 (USD MILLION)
- TABLE 35 MARKET, BY REGION, 2023–2028 (USD MILLION)
- TABLE 36 NORTH AMERICA: MARKET, BY OFFERING, 2019–2022 (USD MILLION)
- TABLE 37 NORTH AMERICA: MARKET, BY OFFERING, 2023–2028 (USD MILLION)
- TABLE 38 NORTH AMERICA: MARKET, BY VERTICAL, 2019–2022 (USD MILLION)
- TABLE 39 NORTH AMERICA: MARKET, BY VERTICAL, 2023–2028 (USD MILLION)
- TABLE 40 NORTH AMERICA: MARKET, BY COUNTRY, 2019–2022 (USD MILLION)
- TABLE 41 NORTH AMERICA: MARKET, BY COUNTRY, 2023–2028 (USD MILLION)
- TABLE 42 US: MARKET, BY OFFERING, 2019–2022 (USD MILLION)
- TABLE 43 US: MARKET, BY OFFERING, 2023–2028 (USD MILLION)
- TABLE 44 US: MARKET, BY VERTICAL, 2019–2022 (USD MILLION)
- TABLE 45 US: CLOUD-BASED QUANTUM COMPUTING MARKET, BY VERTICAL, 2023–2028 (USD MILLION)
- TABLE 46 CANADA: MARKET, BY OFFERING, 2019–2022 (USD MILLION)
- TABLE 47 CANADA: MARKET, BY OFFERING, 2023–2028 (USD MILLION)
- TABLE 48 CANADA: MARKET, BY VERTICAL, 2019–2022 (USD MILLION)
- TABLE 49 CANADA: MARKET, BY VERTICAL, 2023–2028 (USD MILLION)
- TABLE 50 EUROPE: MARKET, BY OFFERING, 2019–2022 (USD MILLION)
- TABLE 51 EUROPE: MARKET, BY OFFERING, 2023–2028 (USD MILLION)
- TABLE 52 EUROPE: MARKET, BY VERTICAL, 2019–2022 (USD MILLION)
- TABLE 53 EUROPE: MARKET, BY VERTICAL, 2023–2028 (USD MILLION)
- TABLE 54 EUROPE: MARKET, BY COUNTRY, 2019–2022 (USD MILLION)
- TABLE 55 EUROPE: MARKET, BY COUNTRY, 2023–2028 (USD MILLION)
- TABLE 56 UK: MARKET, BY OFFERING, 2019–2022 (USD MILLION)
- TABLE 57 UK: MARKET, BY OFFERING, 2023–2028 (USD MILLION)
- TABLE 58 UK: MARKET, BY VERTICAL, 2019–2022 (USD MILLION)
- TABLE 59 UK: CLOUD-BASED QUANTUM COMPUTING MARKET, BY VERTICAL, 2023–2028 (USD MILLION)
- TABLE 60 GERMANY: MARKET, BY OFFERING, 2019–2022 (USD MILLION)
- TABLE 61 GERMANY: MARKET, BY OFFERING, 2023–2028 (USD MILLION)
- TABLE 62 GERMANY: MARKET, BY VERTICAL, 2019–2022 (USD MILLION)
- TABLE 63 GERMANY: MARKET, BY VERTICAL, 2023–2028 (USD MILLION)
- TABLE 64 FRANCE: MARKET, BY OFFERING, 2019–2022 (USD MILLION)
- TABLE 65 FRANCE: MARKET, BY OFFERING, 2023–2028 (USD MILLION)
- TABLE 66 FRANCE: MARKET, BY VERTICAL, 2019–2022 (USD MILLION)
- TABLE 67 FRANCE: MARKET, BY VERTICAL, 2023–2028 (USD MILLION)
- TABLE 68 REST OF EUROPE: CLOUD-BASED QUANTUM COMPUTING MARKET, BY OFFERING, 2019–2022 (USD MILLION)
- TABLE 69 REST OF EUROPE: MARKET, BY OFFERING, 2023–2028 (USD MILLION)
- TABLE 70 REST OF EUROPE: MARKET, BY VERTICAL, 2019–2022 (USD MILLION)
- TABLE 71 REST OF EUROPE: MARKET, BY VERTICAL, 2023–2028 (USD MILLION)
- TABLE 72 ASIA PACIFIC: MARKET, BY OFFERING, 2019–2022 (USD MILLION)
- TABLE 73 ASIA PACIFIC: MARKET, BY OFFERING, 2023–2028 (USD MILLION)
- TABLE 74 ASIA PACIFIC: MARKET, BY VERTICAL, 2019–2022 (USD MILLION)
- TABLE 75 ASIA PACIFIC: MARKET, BY VERTICAL, 2023–2028 (USD MILLION)
- TABLE 76 ASIA PACIFIC: MARKET, BY COUNTRY, 2019–2022 (USD MILLION)
- TABLE 77 ASIA PACIFIC: MARKET, BY COUNTRY, 2023–2028 (USD MILLION)
- TABLE 78 CHINA: CLOUD-BASED QUANTUM COMPUTING MARKET, BY OFFERING, 2019–2022 (USD MILLION)
- TABLE 79 CHINA: MARKET, BY OFFERING, 2023–2028 (USD MILLION)
- TABLE 80 CHINA: MARKET, BY VERTICAL, 2019–2022 (USD MILLION)
- TABLE 81 CHINA: MARKET, BY VERTICAL, 2023–2028 (USD MILLION)
- TABLE 82 JAPAN: MARKET, BY OFFERING, 2019–2022 (USD MILLION)
- TABLE 83 JAPAN: MARKET, BY OFFERING, 2023–2028 (USD MILLION)
- TABLE 84 JAPAN: MARKET, BY VERTICAL, 2019–2022 (USD MILLION)
- TABLE 85 JAPAN: MARKET, BY VERTICAL, 2023–2028 (USD MILLION)
- TABLE 86 INDIA: MARKET, BY OFFERING, 2019–2022 (USD MILLION)
- TABLE 87 INDIA: MARKET, BY OFFERING, 2023–2028 (USD MILLION)
- TABLE 88 INDIA: MARKET, BY VERTICAL, 2019–2022 (USD MILLION)
- TABLE 89 INDIA: MARKET, BY VERTICAL, 2023–2028 (USD MILLION)
- TABLE 90 REST OF ASIA PACIFIC: MARKET, BY OFFERING, 2019–2022 (USD MILLION)
- TABLE 91 REST OF ASIA PACIFIC: MARKET, BY OFFERING, 2023–2028 (USD MILLION)
- TABLE 92 REST OF ASIA PACIFIC: MARKET, BY VERTICAL, 2019–2022 (USD MILLION)
- TABLE 93 REST OF ASIA PACIFIC: MARKET, BY VERTICAL, 2023–2028 (USD MILLION)
- TABLE 94 ROW: CLOUD-BASED QUANTUM COMPUTING MARKET, BY REGION, 2019–2022 (USD MILLION)
- TABLE 95 ROW: MARKET, BY REGION, 2023–2028 (USD MILLION)
- TABLE 96 MARKET: DEGREE OF COMPETITION
- TABLE 97 LIST OF STARTUPS/SMES AND FUNDING
- TABLE 98 REGIONAL FOOTPRINT OF STARTUPS/SMES
- TABLE 99 MARKET: PRODUCT LAUNCHES & ENHANCEMENTS, 2020–2023
- TABLE 100 MARKET: DEALS, 2020–2023
- TABLE 101 IBM: BUSINESS OVERVIEW
- TABLE 102 IBM: PRODUCTS/SOLUTIONS/SERVICES OFFERED
- TABLE 103 IBM: PRODUCT LAUNCHES AND ENHANCEMENTS
- TABLE 104 IBM: DEALS
- TABLE 105 MICROSOFT: BUSINESS OVERVIEW
- TABLE 106 MICROSOFT: PRODUCTS/SOLUTIONS/SERVICES OFFERED
- TABLE 107 MICROSOFT: PRODUCT LAUNCHES AND ENHANCEMENTS
- TABLE 108 MICROSOFT: DEALS
- TABLE 109 GOOGLE: BUSINESS OVERVIEW
- TABLE 110 GOOGLE: PRODUCTS/SOLUTIONS/SERVICES OFFERED
- TABLE 111 GOOGLE: PRODUCT LAUNCHES AND ENHANCEMENTS
- TABLE 112 AWS: BUSINESS OVERVIEW
- TABLE 113 AWS: PRODUCTS/SOLUTIONS/SERVICES OFFERED
- TABLE 114 AWS: PRODUCT LAUNCHES AND ENHANCEMENTS
- TABLE 115 AWS: DEALS
- TABLE 116 BAIDU: BUSINESS OVERVIEW
- TABLE 117 BAIDU: PRODUCTS/SOLUTIONS/SERVICES OFFERED
- TABLE 118 BAIDU: PRODUCT LAUNCHES AND ENHANCEMENTS
- TABLE 119 HUAWEI: BUSINESS OVERVIEW
- TABLE 120 HUAWEI: PRODUCTS/SOLUTIONS/SERVICES OFFERED
- TABLE 121 HUAWEI: PRODUCT LAUNCHES AND ENHANCEMENTS
- TABLE 122 HUAWEI: DEALS
- TABLE 123 ADJACENT MARKETS AND FORECASTS
- TABLE 124 QUANTUM COMPUTING MARKET, BY OFFERING, 2019–2022 (USD MILLION)
- TABLE 125 QUANTUM COMPUTING MARKET, BY OFFERING, 2023–2028 (USD MILLION)
- TABLE 126 QUANTUM COMPUTING MARKET, BY DEPLOYMENT, 2019–2022 (USD MILLION)
- TABLE 127 QUANTUM COMPUTING MARKET, BY DEPLOYMENT, 2023–2028 (USD MILLION)
- TABLE 128 QUANTUM COMPUTING MARKET, BY APPLICATION, 2019–2022 (USD MILLION)
- TABLE 129 QUANTUM COMPUTING MARKET, BY APPLICATION, 2023–2028 (USD MILLION)
- TABLE 130 QUANTUM COMPUTING MARKET, BY END USER, 2019–2022 (USD MILLION)
- TABLE 131 QUANTUM COMPUTING MARKET, BY END USER, 2023–2028 (USD MILLION)
- TABLE 132 QUANTUM COMPUTING MARKET, BY REGION, 2019–2022 (USD MILLION)
- TABLE 133 QUANTUM COMPUTING MARKET, BY REGION, 2023–2028 (USD MILLION)
- TABLE 134 QUANTUM COMPUTING SOFTWARE MARKET, BY COMPONENT, 2017–2019 (USD MILLION)
- TABLE 135 QUANTUM COMPUTING SOFTWARE MARKET, BY COMPONENT, 2020–2026 (USD MILLION)
- TABLE 136 QUANTUM COMPUTING SOFTWARE MARKET, BY ORGANIZATION SIZE, 2017–2019 (USD MILLION)
- TABLE 137 QUANTUM COMPUTING SOFTWARE MARKET, BY ORGANIZATION SIZE, 2020–2026 (USD MILLION)
- TABLE 138 QUANTUM COMPUTING SOFTWARE MARKET, BY DEPLOYMENT MODE, 2017–2019 (USD MILLION)
- TABLE 139 QUANTUM COMPUTING SOFTWARE MARKET, BY DEPLOYMENT MODE, 2020–2026 (USD MILLION)
- TABLE 140 QUANTUM COMPUTING SOFTWARE MARKET, BY APPLICATION, 2017–2019 (USD MILLION)
- TABLE 141 QUANTUM COMPUTING SOFTWARE MARKET, BY APPLICATION, 2020–2026 (USD MILLION)
- TABLE 142 QUANTUM COMPUTING SOFTWARE MARKET, BY VERTICAL, 2017–2019 (USD MILLION)
- TABLE 143 QUANTUM COMPUTING SOFTWARE MARKET, BY VERTICAL, 2020–2026 (USD MILLION)
- TABLE 144 QUANTUM COMPUTING SOFTWARE MARKET, BY REGION, 2017–2019 (USD MILLION)
- TABLE 145 QUANTUM COMPUTING SOFTWARE MARKET, BY REGION, 2020–2026 (USD MILLION)
- FIGURE 1 CLOUD-BASED QUANTUM COMPUTING MARKET: RESEARCH DESIGN
- FIGURE 2 MARKET: DATA TRIANGULATION
- FIGURE 3 APPROACH 1 (SUPPLY-SIDE): REVENUE FROM SOFTWARE/SERVICES OF CLOUD-BASED QUANTUM COMPUTING VENDORS
- FIGURE 4 APPROACH 1 (SUPPLY-SIDE) ANALYSIS
- FIGURE 5 MARKET ESTIMATION: RESEARCH FLOW
- FIGURE 6 COMPANY EVALUATION QUADRANT: CRITERIA WEIGHTAGE
- FIGURE 7 COMPANY EVALUATION QUADRANT (STARTUPS): CRITERIA WEIGHTAGE
- FIGURE 8 MARKET TO WITNESS SIGNIFICANT GROWTH DURING FORECAST PERIOD GLOBALLY
- FIGURE 9 MARKET: SEGMENTS SNAPSHOT
- FIGURE 10 MARKET: REGIONAL SNAPSHOT
- FIGURE 11 INCREASING INVESTMENTS AND INNOVATIONS IN QUANTUM COMPUTING TECHNOLOGY T0 FUEL MARKET GROWTH
- FIGURE 12 CLOUD-BASED QUANTUM COMPUTING SOFTWARE TO HOLD LARGER MARKET DURING FORECAST PERIOD
- FIGURE 13 CLOUD-BASED QUANTUM COMPUTING PROFESSIONAL SERVICES TO HOLD LARGER MARKET SHARE DURING FORECAST PERIOD
- FIGURE 14 RESEARCH AND ACADEMIA SEGMENT TO HOLD LARGEST MARKET SIZE DURING FORECAST PERIOD
- FIGURE 15 ASIA PACIFIC TO EMERGE AS BEST MARKET FOR INVESTMENT IN NEXT FIVE YEARS
- FIGURE 16 MARKET: DRIVERS, RESTRAINTS, OPPORTUNITIES, AND CHALLENGES
- FIGURE 17 CLOUD-BASED QUANTUM COMPUTING MARKET: ECOSYSTEM
- FIGURE 18 MARKET: PATENT ANALYSIS
- FIGURE 19 VALUE CHAIN: MARKET
- FIGURE 20 MARKET: PORTER'S FIVE FORCES ANALYSIS
- FIGURE 21 MARKET: TRENDS AND DISRUPTIONS IMPACTING CUSTOMERS
- FIGURE 22 INFLUENCE OF STAKEHOLDERS ON BUYING PROCESS (%)
- FIGURE 23 SERVICES SEGMENT TO REGISTER HIGHEST CAGR DURING FORECAST PERIOD
- FIGURE 24 BFSI SEGMENT TO REGISTER HIGHEST CAGR DURING FORECAST PERIOD
- FIGURE 25 ASIA PACIFIC TO GROW AT HIGHEST CAGR DURING FORECAST PERIOD
- FIGURE 26 NORTH AMERICA: MARKET SNAPSHOT
- FIGURE 27 ASIA PACIFIC: MARKET SNAPSHOT
- FIGURE 28 HISTORICAL REVENUE ANALYSIS OF KEY CLOUD-BASED QUANTUM COMPUTING VENDORS, 2019–2022 (USD MILLION)
- FIGURE 29 RANKINGS OF KEY PLAYERS
- FIGURE 30 CLOUD-BASED QUANTUM COMPUTING MARKET SHARE, 2022
- FIGURE 31 MARKET: KEY COMPANY EVALUATION QUADRANT (2022)
- FIGURE 32 MARKET: STARTUP EVALUATION QUADRANT (2022)
- FIGURE 33 IBM: COMPANY SNAPSHOT
- FIGURE 34 MICROSOFT: COMPANY SNAPSHOT
- FIGURE 35 GOOGLE: COMPANY SNAPSHOT
- FIGURE 36 AWS: COMPANY SNAPSHOT
- FIGURE 37 BAIDU: COMPANY SNAPSHOT
- FIGURE 38 HUAWEI: COMPANY SNAPSHOT
The cloud-based quantum computing market research study used extensive secondary and primary research methodology. This research study used comprehensive secondary sources, directories, and databases, such as D&B Hoovers, Bloomberg Businessweek, and Factiva, to identify and collect information for a technical, market-oriented, and commercial study of the global cloud-based quantum computing market. Other market-related reports and analyses published by various industry associations and consortiums, such as the National Security Agency (NSA), were also considered while conducting the extensive secondary research.
The primary sources were industry experts from core and related industries, preferred suppliers, developers, distributors, service providers, technology developers, and technologists from companies and organizations related to all segments of the industry’s value chain. In-depth interviews were conducted with primary respondents, including key industry participants, subject-matter experts, C-level executives of key market players, and industry consultants, to obtain and verify critical qualitative and quantitative information and assess the market’s prospects.
Secondary Research
In the secondary research process, various secondary sources were referred for identifying and collecting information related to the study. Secondary sources included annual reports, press releases, and investor presentations of cloud-based quantum; computing software vendors, forums, certified publications, and whitepapers. The secondary research was used to obtain critical information on the industry’s value chain, total key players, market classification, and segmentation from the market and technology-oriented perspectives.
Primary Research
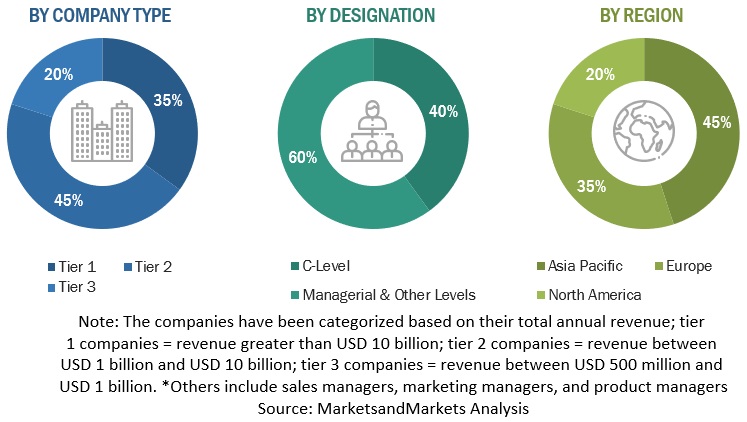
Various primary sources from the supply and demand sides were interviewed to obtain qualitative and quantitative information for this report. The primary sources from the supply side included various industry experts, including Chief Executive Officers (CEOs), Vice Presidents (VPs), marketing directors, technology and innovation directors, and related key executives from various key companies and organizations operating in the cloud-based quantum computing market.
Following is the breakup of primary respondents:
Market Size Estimation
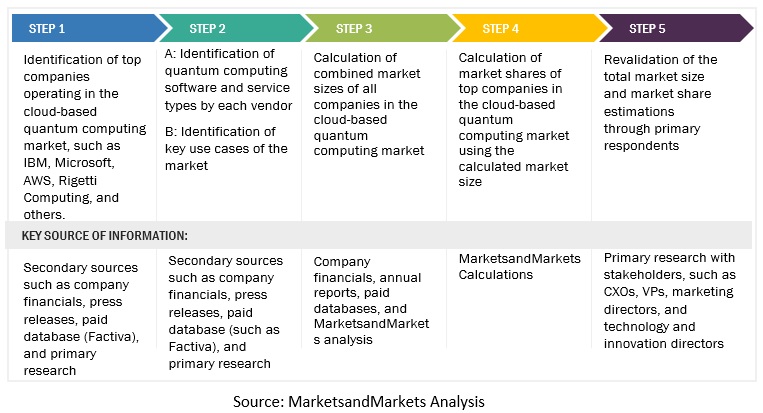
Multiple approaches were adopted to estimate and forecast the size of the cloud-based quantum computing market. In the market engineering process, the top-down and bottom-up approaches and several data triangulation methods were extensively used to perform market estimation and market forecasting for the overall segments and sub-segments listed in this report. Extensive qualitative and quantitative analyses were performed on the complete market engineering process to list key information/insights throughout the report. This procedure included studying top market players’ annual and financial reports and extensive interviews for key insights from industry leaders, such as CEOs, VPs, directors, and marketing executives. All percentage splits and breakups were determined using secondary sources and verified through primary sources. All possible parameters that affect the market covered in this research study have been accounted for, viewed in extensive detail, verified through primary research, and analyzed to get the final quantitative and qualitative data. This data is consolidated and added to detailed inputs and analysis from MarketsandMarkets.
Data Triangulation
After arriving at the overall market size using the market size estimation processes, as explained above, the market was split into several segments and subsegments. The data triangulation and market breakup procedures were employed, wherever applicable, to complete the overall engineering process and arrive at the exact statistics of each market segment and sub-segments. The data was triangulated by studying various factors and trends from the demand and supply sides.
Market Definition
MarketsandMarkets defines it: “Cloud-based quantum computing typically refers to a model where a cloud provider offers access to quantum computing resources through a cloud-based platform or application programming interface (API). The user can access these resources remotely, the cloud provider offers access to the hardware, but the user is responsible for the software.”
Key Stakeholders
- Internet service providers
- Independent software vendors
- Third-party providers
- System integrators
- Value-added resellers (VARs)
- Research organizations
- Consulting firms
- Distribution partners
- Research organizations and universities
- Original equipment manufacturers (OEMs)
- Technology standard organizations, forums, alliances, and associations
- Analysts and strategic business planners
- Government bodies, venture capitalists, and private equity firms
Report Objectives
- To describe and forecast the global cloud-based quantum computing market by offering, vertical, and region
- To analyze the global cloud-based quantum computing market by technology and applications, qualitatively
- To predict the market size of four main regions: North America, Europe, Asia Pacific (APAC), and the Rest of the World (RoW)
- To analyze the subsegments of the market concerning individual growth trends, prospects, and contributions to the overall market
- To provide detailed information related to significant factors (drivers, restraints, opportunities, and challenges) influencing the growth of the market
- To analyze the opportunities in the market for stakeholders and provide the competitive landscape details of major players
- To profile the key players of the cloud-based quantum computing market and comprehensively analyze their market shares and core competencies
- To track and analyze competitive developments, such as mergers and acquisitions (M&A), product developments, partnerships, and collaborations in the market
Customization Options
With the given market data, MarketsandMarkets offers customizations based on company-specific needs. The following customization options are available for the report:
Geographic Analysis
- Further breakup of the Asia Pacific market into countries contributing 75% to the regional market size
- Further breakup of the North American market into countries contributing 75% to the regional market size
- Further breakup of the Latin American market into countries contributing 75% to the regional market size
- Further breakup of the Middle Eastern and African market into countries contributing 75% to the regional market size
- Further breakup of the European market into countries contributing 75% to the regional market size
Company Information
- Detailed analysis and profiling of additional market players (up to 5)


 Generating Response ...


Growth opportunities and latent adjacency in Cloud-based Quantum Computing Market