Healthcare Cloud Computing Market

Healthcare Cloud Computing Market by Product (EMR/EHR, VNA, RIS, LIS, PIS), Deployment (Private Cloud, Hybrid Cloud, Public Cloud), Component (Software, Services), Pricing (Spot Pricing), Service (SaaS, IaaS, PaaS), End User - Global Forecasts to 2027

Report Code: HIT 3561 Apr, 2022, by marketsandmarkets.com

The global healthcare cloud computing market in terms of revenue was estimated to be worth $39.4 billion in 2022 and is poised to reach $89.4 billion by 2027, growing at a CAGR of 17.8% from 2022 to 2027. The growth of the global market is mainly driven by factors such as the growing adoption of EHR, e-prescribing, telehealth, mHealth, and other healthcare IT solutions due to COVID-19; the increasing adoption of big data analytics, wearable devices, and IoT; increasing cloud deployment in the healthcare industry; better storage, flexibility, and scalability of data offered by cloud computing; the proliferation of new payment models and cost-efficiency of the cloud; and the dynamic nature of health benefit plan designs. On the other hand, data & security concerns and complex regulations governing cloud data centers are factors expected to restrain the market growth to a certain extent.

In this report, the healthcare cloud computing market is classified into seven segments product, component, deployment model, service model, pricing model, end user, and region.

Healthcare Cloud Computing Market

To know about the assumptions considered for the study, Request for Free Sample Report

Healthcare Cloud Computing Market Dynamics

Drivers: Growing adoption of EHR, e-prescribing, telehealth, mHealth, and other healthcare IT solutions due to COVID-19

Globally, the prevalence of chronic diseases, such as cancer, CVD, and diabetes, has increased significantly over the last few decades. According to the WHO (2016), CVD is the leading cause of death globally, accounting for 17.3 million deaths per year. This figure is expected to grow to more than 23.6 million by 2030. Of these deaths, an estimated 7.4 million are due to coronary heart disease, and 6.7 million are due to stroke. Similarly, according to GLOBOCAN, the number of new cancer cases diagnosed per year is expected to increase to 19.3 million by 2025 from 14.1 million in 2012.

The rising geriatric population across the globe is one of the major factors responsible for the growth in the prevalence of these chronic diseases. According to the WHO estimates, between 2015 and 2050, the global geriatric population (aged above 60 years) is expected to nearly double from 12% to 22% of the total global population; this population is estimated to reach ~2 billion by 2050. According to the National Council on Aging, ~92% of older adults have at least one chronic disease, while 77% have at least two chronic diseases.

The COVID-19 pandemic has resulted in a significant increase in the burden on healthcare organizations across the globe. Healthcare facilities face immense pressure to create a well-coordinated environment where all clinical devices are connected internally and where the organization operates in coordination with other healthcare units. According to Worldometer, there were around 502 million confirmed COVID-19 cases and 6.2 million deaths globally as of April 2022. Considering the growing number of cases, the healthcare systems of several countries are facing a major shortage of hospital beds, healthcare providers, and basic medical equipment. This is compelling hospitals and other care facilities to deploy hospital capacity management solutions to track the COVID-19 patients alongside monitoring and managing disease progression.

As COVID-19 is highly contagious, the need for remote monitoring of affected patients is increasing. Temporary hospitals are being set up in several countries to deal with the increasing disease incidence. However, they lack the basic infrastructure required for facilitating communication between nurses and patients. Consequently, the spread of COVID-19 has greatly boosted the demand for hospital capacity management solutions, telehealth & mHealth solutions, e-prescribing, and EHR solutions, not only in the developed world but also in emerging economies such as the APAC region.

Consumer adoption of telehealth has shot up, from 11% of the US consumers using telehealth in 2019 to 46% of consumers using telehealth to replace canceled healthcare visits in 2020. Similarly, at MyDoc, a telemedicine platform headquartered in Singapore, the number of monthly active users grew by 272% from January 2019 to January 2021.

Restraints: Rising data security and privacy concerns

A major concern related to cloud solutions is that the data hosted by vendors is not as secure as data stored on-premise. Patient information is considered sensitive, and a high degree of privacy needs to be maintained so that this information is accessible to authorized users only. In various countries, patient information has come under the scanner of legal frameworks, such as HIPAA (Health Insurance Portability and Accountability Act) in the US. Similarly, the EU has several directives about data protection. In many countries, the Protected Health Information (PHI) of patients cannot be moved out of their country of origin. Canada’s Personal Information Protection and Electronic Documents Act (PIPEDA) protects personal information that is collected, used, or disclosed. Canadian organizations may face legal issues if found to be non-compliant with the Act.

Though the cloud offers various benefits and security measures, the data stored on the cloud is still prone to cyber-attacks. With the increasing volume of patient data and rising initiatives toward digital transformation in healthcare, data security and privacy concerns are increasing rapidly. Moreover, patients themselves are concerned about the security of their data, which adds to the necessity of maintaining security standards for data protection. Public clouds face similar security issues as traditional IT systems and are thus not preferred. Although private clouds offer more secure access protocols and systems, the healthcare industry is still skeptical about the data security of a private cloud.

Opportunities: Emergence of telecloud and telehealth consultations

The convergence of wireless technology and the cloud is proving to be a very strong mechanism for patient care delivery to remote locations. In several countries, most physicians and specialists work in metros and cities. Hence, advanced care facilities are only available in such places, leaving patients in rural areas unattended. This problem can be addressed through the use of a telecloud, as it enables physicians and healthcare specialists to diagnose and treat patients over large distances in real-time and at affordable costs.

Clinicians have been focusing on remote monitoring of affected patients due to the COVID-19 pandemic and the contagiousness of the disease. Physical assistance is taking a toll as there are increasing cases of doctors getting infected with the pandemic despite proper protection and care. The Italian Doctors Association stated that in March 2020, at least 50 doctors lost their lives treating COVID-19. It is, therefore, essential to minimize physical assistance and encourage telehealth. Thus, telehealth that includes remote monitoring of patients and the use of interactive medicines is expected to gain traction in the coming years.

In May 2018, the Centers for Medicare & Medicaid Services (CMS) made telehealth and telemedicine a cornerstone in its first Rural Health Strategy. CMS revealed its first-ever program, which included a five-point, eight-page initiative to improve access to care for Americans living in rural and underserved communities. Moreover, Cisco is supporting more than 17,000 healthcare organizations in 118 countries for telehealth and remote patient monitoring. With the rising awareness of telehealth among healthcare providers, the adoption of the telecloud is expected to increase in several countries and thereby offer potential growth opportunities to players operating in the healthcare cloud computing market.

Challenges: Rising interoperability and portability issues

One of the major requirements of any hospital or healthcare organization is easy and rapid access to patient data. When data is migrated to the cloud by a hospital, it is stored on systems and platforms maintained by the service vendor, who can create certain interoperability challenges. Cloud APIs and interfaces pose the main challenge to organizations attempting cloud computing interoperability. The lack of standardization among the cloud service providers limits the data sharing between different cloud tools leading to portability issues. For instance, if a patient’s data is stored by one physician who refers the patient to another hospital or specialty clinic, then, in such a case, the hospital should be able to access the patient’s health records stored on a different cloud. To maintain maximum efficiency, it is ideal if there is a high degree of interoperability and standardization between healthcare solutions for the cloud. Major companies such as Cerner and Amazon Web Services are trying to resolve this problem. In 2019, Cerner announced the launch of a cognitive healthcare platform to deal with interoperability issues by removing the need for manual steps. The platform is being developed under the name ‘Project Apollo.’

The healthcare provider solutions segment accounted for the largest market share in 2021.

In 2021, the healthcare provider segment accounted for the larger share of the healthcare cloud computing market. This is mainly due to the growing adoption of several healthcare IT solutions due to COVID-19, and increased uptake of technological advancements in health IT.

The SaaS segment accounted for the largest market share in 2021.

In 2021, the software-as-a-service segment was the largest segment of the global market. The key factors responsible for the growth of this segment are enhanced security, and limited up-front capital expenses associated with the SaaS model.

North America was the largest regional market for healthcare cloud computing market in 2021

In 2021, North America accounted for the largest share of the global market. Factors like technological advancements, EHR incentive programs by Medicaid & Medicare, and high healthcare expenditure contribute to the growth of this region.

Additionally, the fastest growing region in the global market is the Asia Pacific with a CAGR of 22.4% during the forecast period. This growth is driven by factors such as the increased adoption of digital health solutions in Asia, modernization of Chinese healthcare infrastructure, and the rapidly growing healthcare industry in India.

Healthcare Cloud Computing Market by Region

To know about the assumptions considered for the study, download the pdf brochure

Key players offering healthcare cloud computing products in this market include Amazon Web Services, Inc. (US), Microsoft Corporation (US), International Business Machines Corporation (US), athenahealth. Inc. (US), CareCloud, Inc. (US), Siemens Healthineers AG (Germany), eClinicalWorks (US), Koninklijke Philips N.V. (Netherlands), and Allscripts Healthcare Solutions, Inc. (US).

These companies adopted strategies such as service launches, business expansions, agreements, partnerships, collaborations, and acquisitions to strengthen their presence in the Healthcare cloud computing market.

Healthcare Cloud Computing Market Report Scope

Report Metric 

Details 

Market Revenue in 2022

$39.4 billion

Estimated Value by 2027

$89.4 billion

Growth Rate

Poised to grow at a CAGR of 17.8%

Largest Share Segments

  • Healthcare provider solutions segment and SaaS segment

Market Report Segmentation

Product, component, deployment model, pricing model, service model, end user, and region

Growth Drivers

  • Growing adoption of EHR, e-prescribing, telehealth, mhealth, and other healthcare IT solutions due to COVID-19
  • Increasing adoption of big data analytics, wearable devices, and IoT in healthcare
  • Better storage, flexibility, scalability, and collaboration of data offered by cloud computing
  • Increasing cloud deployment in the healthcare industry

Growth Opportunities
  • Emergence of telecloud and telehealth consultations
  • Use of blockchain in health cloud
  • Decrease in connectivity and accessibility gap
  • Formation of accountable care organizations

Geographies covered

North America, Europe, APAC, MEA, and Latin America

The research report categorizes the healthcare cloud computing market into the following segments and sub-segments:

By Products

  • Healthcare Provider Solutions
    • Clinical Information Systems
      • EHR/EMR
      • PACS and VNA
      • PHM solutions
      • Telehealth solutions
      • RIS
      • LIS
      • PIS
      • Other clinical information systems
    • Non-Clinical Information Systems
      • RCM solutions
      • Financial management solutions
      • HIE solutions
      • SCM solutions
      • Billings & accounts management solutions
      • Other non-clinical information systems
  • Healthcare Payer Solutions
    • Claims management solutions
    • Payment management solutions
    • CRM solutions
    • Provider network management solutions
    • Fraud management solutions

By Component

  • Services
  • Software

By Deployment model

  • Private cloud
  • Hybrid cloud
  • Public cloud

By Pricing Model

  • Pay-as-you-go
  • Spot pricing

By Service Model

  • Software-as-a-service
  • Platform-as-a-service
  • Infrastructure-as-a-service

By End User

  • Healthcare providers
  • Healthcare payers

By Region

  • North America
    • US
    • Canada
  • Europe
    • France
    • Germany
    • UK
    • Italy
    • Spain
    • Rest of Europe
  • Asia Pacific
    • Japan
    • China
    • India
    • Australia
    • Singapore
    • Rest of Asia Pacific
  • Latin America
    • Brazil
    • Mexico
    • Rest of Latin America
  • Middle East & Africa

Recent Developments

  • In February 2022, IBM (US) acquired Neudesic, LLC (US) which was aimed at expanding IBM's portfolio of hybrid multi-cloud services and further advance the company's hybrid cloud and AI strategy.
  • In February 2022, Lyniate (US) acquired SAP SE (Germany) which was aimed at providing technology and consulting expertise to make it easier for clients to embrace a hybrid cloud approach and move mission-critical workloads from SAP solutions to the cloud for regulated and non-regulated industries.
  • In January 2022 Francisco Partners (US) signed an agreement with IBM (US) to acquire healthcare data and analytics assets from IBM that are currently part of the Watson Health business, including Health Insights, MarketScan, Clinical Development, Social Program Management, Micromedex, and imaging software offerings.
  • In January 2022, IBM (US) acquired ENVIZI (Australia) which was aimed at building on IBM's growing investments in AI-powered software.

Frequently Asked Questions (FAQs):

To speak to our analyst for a discussion on the above findings, click Speak to Analyst

TABLE OF CONTENTS

1 INTRODUCTION (Page No. - 44)
    1.1 STUDY OBJECTIVES
    1.2 MARKET DEFINITION
           1.2.1 INCLUSIONS AND EXCLUSIONS
    1.3 MARKET SCOPE
           1.3.1 MARKETS COVERED
                    FIGURE 1 HEALTHCARE CLOUD COMPUTING MARKET
           1.3.2 YEARS CONSIDERED
    1.4 CURRENCY
    1.5 LIMITATIONS
    1.6 STAKEHOLDERS
    1.7 SUMMARY OF CHANGES

2 RESEARCH METHODOLOGY (Page No. - 49)
    2.1 RESEARCH APPROACH
    2.2 RESEARCH METHODOLOGY DESIGN
           FIGURE 2 HEALTHCARE CLOUD COMPUTING MARKET: RESEARCH DESIGN
           2.2.1 SECONDARY RESEARCH
                    2.2.1.1 Key data from secondary sources
           2.2.2 PRIMARY RESEARCH
                    FIGURE 3 PRIMARY SOURCES
                    2.2.2.1 Key data from primary sources
                    2.2.2.2 Insights from primary experts
                               FIGURE 4 BREAKDOWN OF PRIMARY INTERVIEWS: SUPPLY SIDE AND DEMAND SIDE PARTICIPANTS
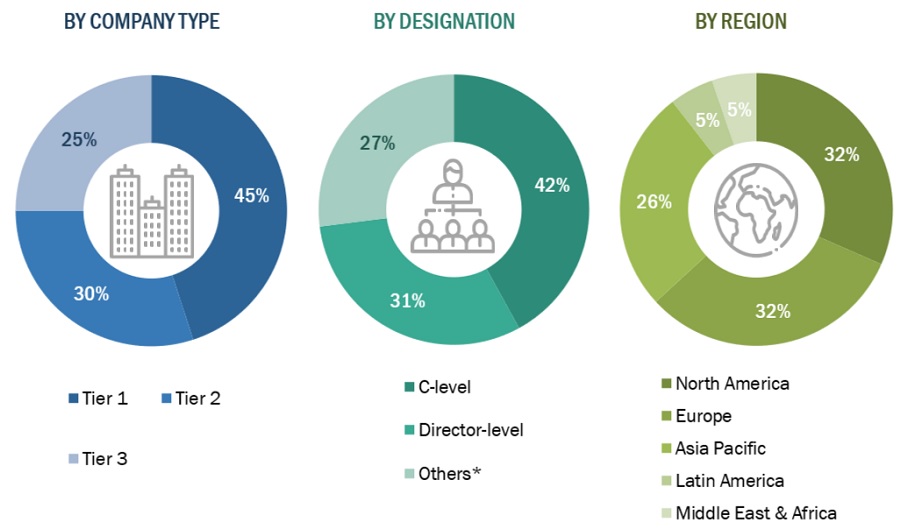
                               FIGURE 5 BREAKDOWN OF PRIMARY INTERVIEWS: BY COMPANY TYPE,  DESIGNATION, AND REGION
    2.3 MARKET SIZE ESTIMATION: GLOBAL MARKET
           FIGURE 6 SUPPLY SIDE MARKET SIZE ESTIMATION: REVENUE SHARE ANALYSIS
           FIGURE 7 MARKET SIZE ESTIMATION: GLOBAL MARKET
           FIGURE 8 TOP-DOWN APPROACH
           FIGURE 9 CAGR PROJECTIONS FROM ANALYSIS OF DRIVERS, RESTRAINTS, OPPORTUNITIES, AND CHALLENGES OF GLOBAL MARKET (2022–2027)
           FIGURE 10 CAGR PROJECTIONS: SUPPLY SIDE ANALYSIS
    2.4 MARKET BREAKDOWN & DATA TRIANGULATION
           FIGURE 11 DATA TRIANGULATION METHODOLOGY
    2.5 MARKET SHARE ESTIMATION
    2.6 STUDY ASSUMPTIONS
    2.7 LIMITATIONS
           2.7.1 METHODOLOGY-RELATED LIMITATIONS
           2.7.2 SCOPE-RELATED LIMITATIONS
    2.8 RISK ASSESSMENT
           TABLE 1 LIMITATIONS & ASSOCIATED RISKS

3 EXECUTIVE SUMMARY (Page No. - 64)
    FIGURE 12 HEALTHCARE CLOUD COMPUTING MARKET, BY PRODUCT, 2022 VS. 2027 (USD MILLION)
    FIGURE 13 GLOBAL MARKET, BY DEPLOYMENT MODEL, 2022 VS. 2027 (USD MILLION)
    FIGURE 14 GLOBAL MARKET, BY COMPONENT, 2022 VS. 2027 (USD MILLION)
    FIGURE 15 GLOBAL MARKET, BY PRICING MODEL,  2022 VS. 2027 (USD MILLION)
    FIGURE 16 GLOBAL MARKET, BY SERVICE MODEL, 2022 VS. 2027 (USD MILLION)
    FIGURE 17 GLOBAL MARKET, BY END USER, 2022 VS. 2027 (USD MILLION)
    FIGURE 18 GEOGRAPHICAL SNAPSHOT OF GLOBAL MARKET

4 PREMIUM INSIGHTS (Page No. - 69)
    4.1 HEALTHCARE CLOUD COMPUTING MARKET OVERVIEW
           FIGURE 19 GROWING ADOPTION OF EHR, E-PRESCRIBING, TELEHEALTH, MHEALTH, AND OTHER HEALTHCARE IT SOLUTIONS DUE TO COVID-19 TO DRIVE MARKET GROWTH
    4.2 GLOBAL MARKET: GEOGRAPHICAL GROWTH OPPORTUNITIES
           FIGURE 20 CHINA TO WITNESS HIGHEST GROWTH IN GLOBAL MARKET DURING FORECAST PERIOD
    4.3 NORTH AMERICA: MARKET, BY PRODUCT AND COUNTRY (2021)
           FIGURE 21 HEALTHCARE PROVIDER SEGMENT TO ACCOUNT FOR LARGEST SHARE OF GLOBAL MARKET IN NORTH AMERICA FOR 2021
    4.4 REGIONAL MIX: GLOBAL MARKET (2022–2027)
           FIGURE 22 ASIA PACIFIC REGION IS EXPECTED TO REGISTER HIGHEST GROWTH RATE DURING FORECAST PERIOD (2022–2027)
    4.5 GLOBAL MARKET: DEVELOPED VS. DEVELOPING MARKETS
           FIGURE 23 DEVELOPING MARKETS TO REGISTER HIGHER GROWTH DURING THE FORECAST PERIOD

5 MARKET OVERVIEW (Page No. - 73)
    5.1 INTRODUCTION
    5.2 MARKET DYNAMICS
           FIGURE 24 MARKET DYNAMICS: HEALTHCARE CLOUD COMPUTING MARKET
           5.2.1 DRIVERS
                    5.2.1.1 Growing adoption of EHR, e-prescribing, telehealth, mhealth, and other healthcare IT solutions due to COVID-19
                    5.2.1.2 Increasing adoption of big data analytics, wearable devices, and IoT in healthcare
                    5.2.1.3 Better storage, flexibility, scalability, and collaboration of data offered by cloud computing
                    5.2.1.4 Increasing cloud deployment in healthcare industry
                               TABLE 2 RECENT CLOUD DEPLOYMENTS
                    5.2.1.5 Proliferation of new payment models and cost-efficiency of cloud
                    5.2.1.6 Dynamic nature of health benefit plans
           5.2.2 RESTRAINTS
                    5.2.2.1 Rising data security and privacy concerns
                    5.2.2.2 Growing complex regulations governing cloud data centers
                    5.2.2.3 Increased IT infrastructural constraints
           5.2.3 OPPORTUNITIES
                    5.2.3.1 Emergence of telecloud and telehealth consultations
                    5.2.3.2 Use of blockchain in health cloud
                    5.2.3.3 Decrease in connectivity and accessibility gap
                    5.2.3.4 Formation of accountable care organizations
           5.2.4 CHALLENGES
                    5.2.4.1 Rising interoperability and portability issues
                    5.2.4.2 Limited technical expertise in developing geographies

6 INDUSTRY INSIGHTS (Page No. - 84)
    6.1 INTRODUCTION
    6.2 TECHNOLOGY TRENDS
           6.2.1 INTERNET OF THINGS
           6.2.2 ARTIFICIAL INTELLIGENCE
                    TABLE 3 AI IN HEALTHCARE MARKET, BY REGION, 2017–2026 (USD MILLION)
           6.2.3 BLOCKCHAIN
           6.2.4 BIG DATA AND PREDICTIVE ANALYTICS
    6.3 ADOPTION TRENDS
           6.3.1 INTRODUCTION
           6.3.2 NORTH AMERICA: ADOPTION TRENDS
                    TABLE 4 US: INPATIENT EMR ADOPTION MODEL (EMRAM), 2017
                    FIGURE 25 US: HOSPITAL EHR ADOPTION (2007–2018)
                    FIGURE 26 US: OUTPATIENT EMR ADOPTION, Q2 2017
           6.3.3 EUROPE: ADOPTION TRENDS
                    FIGURE 27 EUROPE: E-HEALTH PRIORITIES IN HEALTH FACILITIES, 2019
                    TABLE 5 EHEALTH PRIORITIES FOR HEALTHCARE PROVIDERS IN EUROPE, BY COUNTRY
                    FIGURE 28 EUROPE: EHEALTH CHALLENGES FACED BY HEALTHCARE PROVIDERS, 2019
           6.3.4 ASIA PACIFIC: ADOPTION TRENDS
                    FIGURE 29 ASIA PACIFIC: EMR & EHR ADOPTION RATES (2012 VS. 2015)
           6.3.5 REST OF THE WORLD: ADOPTION TRENDS
    6.4 PRICING ANALYSIS
           TABLE 6 AVERAGE SELLING PRICE OF SOME ON-PREMISE V/S CLOUD-BASED SOLUTIONS, BY PRODUCT, 2020
    6.5 ECOSYSTEM ANALYSIS
           FIGURE 30 ECOSYSTEM: HEALTHCARE CLOUD COMPUTING MARKET
    6.6 PORTER’S FIVE FORCES ANALYSIS
           TABLE 7 GLOBAL MARKET: PORTER’S FIVE FORCES ANALYSIS
           6.6.1 THREAT OF NEW ENTRANTS
                    6.6.1.1 Capital requirement
                    6.6.1.2 High preference for products from well-established brands
           6.6.2 THREAT OF SUBSTITUTES
                    6.6.2.1 Substitutes for healthcare cloud computing
           6.6.3 BARGAINING POWER OF SUPPLIERS
                    6.6.3.1 Presence of several raw material suppliers
                    6.6.3.2 Supplier switching costs
           6.6.4 BARGAINING POWER OF BUYERS
                    6.6.4.1 Few companies offer premium products at global level
           6.6.5 INTENSITY OF COMPETITIVE RIVALRY
                    6.6.5.1 Increasing demand for high quality and innovative products
                    6.6.5.2 Lucrative growth potential in emerging markets
    6.7 REGULATORY ANALYSIS
           6.7.1 NORTH AMERICA
           6.7.2 EUROPE
           6.7.3 ASIA PACIFIC
           6.7.4 MIDDLE EAST & AFRICA
           6.7.5 LATIN AMERICA
    6.8 PATENT ANALYSIS
           6.8.1 PATENT PUBLICATION TRENDS FOR HEALTHCARE CLOUD COMPUTING
                    FIGURE 31 GLOBAL PATENT PUBLICATION TRENDS IN MARKET, 2018–2022
           6.8.2 TOP APPLICANTS (COMPANIES) FOR HEALTHCARE CLOUD COMPUTING PATENTS
                    FIGURE 32 TOP COMPANIES THAT APPLIED FOR HEALTHCARE CLOUD COMPUTING PATENTS, 2018–2022
           6.8.3 JURISDICTION ANALYSIS: TOP APPLICANTS (COUNTRIES) FOR PATENTS IN GLOBAL MARKET
                    FIGURE 33 JURISDICTION ANALYSIS: TOP APPLICANT COUNTRIES FOR HEALTHCARE CLOUD COMPUTING PATENTS, 2018–2022
    6.9 IMPACT OF COVID-19 ON GLOBAL MARKET
           6.9.1 INTRODUCTION
           6.9.2 COVID-19 DRIVEN MARKET DYNAMICS
                    6.9.2.1 Drivers and opportunities
                    6.9.2.2 Restraints and challenges
           6.9.3 HEALTHCARE CLOUD COMPUTING: COVID-19 USE CASES

7 HEALTHCARE CLOUD COMPUTING MARKET, BY PRODUCT (Page No. - 107)
    7.1 INTRODUCTION
           TABLE 8 GLOBAL MARKET, BY PRODUCT, 2020–2027 (USD MILLION)
    7.2 HEALTHCARE PROVIDER SOLUTIONS
           TABLE 9 HEALTHCARE PROVIDER SOLUTIONS MARKET, BY TYPE, 2020–2027 (USD MILLION)
           TABLE 10 HEALTHCARE PROVIDER SOLUTIONS MARKET, BY COUNTRY, 2020–2027 (USD MILLION)
           7.2.1 CLINICAL INFORMATION SYSTEMS
           TABLE 11 CLINICAL INFORMATION SYSTEMS MARKET, BY TYPE, 2020–2027 (USD MILLION)
           TABLE 12 CLINICAL INFORMATIONCHAN SYSTEMS MARKET, BY COUNTRY, 2020–2027 (USD MILLION)
                    7.2.1.1 Electronic health records/electronic medical records (EHR/EMR)
                               7.2.1.1.1 EHR/EMR to dominate clinical information systems market
                               TABLE 13 COMPANIES PROVIDING EHR SOLUTIONS
                               TABLE 14 ELECTRONIC HEALTH RECORDS/ELECTRONIC MEDICAL RECORDS MARKET, BY COUNTRY, 2020–2027 (USD MILLION)
                    7.2.1.2 Picture archiving & communication systems and vendor-neutral archives (PACS AND VNA)
                               7.2.1.2.1 Growing image generation alongside need for scalability and easy sharing to drive PACS and VNA demand
                               TABLE 15 COMPANIES PROVIDING PACS AND VNA SOLUTIONS
                               TABLE 16 PICTURE ARCHIVING & COMMUNICATION SYSTEMS AND VENDOR-NEUTRAL ARCHIVES MARKET, BY COUNTRY, 2020–2027 (USD MILLION)
                    7.2.1.3 Population health management solutions
                               7.2.1.3.1 Rising prevalence of chronic diseases and need to reduce healthcare costs to drive PHM adoption
                               TABLE 17 COMPANIES PROVIDING PHM SOLUTIONS
                               TABLE 18 POPULATION HEALTH MANAGEMENT SOLUTIONS MARKET, BY COUNTRY, 2020–2027 (USD MILLION)
                    7.2.1.4 Telehealth solutions
                               7.2.1.4.1 Shortage of health professionals to drive market growth
                               TABLE 19 COMPANIES PROVIDING TELEHEALTH SOLUTIONS
                               TABLE 20 TELEHEALTH SOLUTIONS MARKET, BY COUNTRY, 2020–2027 (USD MILLION)
                    7.2.1.5 Radiology information systems (RIS)
                               7.2.1.5.1 RIS uses a cloud solution to help convert radiology to a virtual solution
                               TABLE 21 COMPANIES PROVIDING RIS SOLUTIONS
                               TABLE 22 RADIOLOGY INFORMATION SYSTEMS MARKET, BY COUNTRY, 2020–2027 (USD MILLION)
                    7.2.1.6 Laboratory information systems
                               7.2.1.6.1 High flexibility, interoperability, scalability, and cost-efficiency of cloud-based LIS to drive market demand
                               TABLE 23 COMPANIES PROVIDING LIS SOLUTIONS
                               TABLE 24 LABORATORY INFORMATION SYSTEMS MARKET, BY COUNTRY, 2020–2027 (USD MILLION)
                    7.2.1.7 Pharmacy information systems
                               7.2.1.7.1 Rising demand for automatic refills and the growing popularity of e-prescriptions to drive PIS use
                               TABLE 25 PHARMACY INFORMATION SYSTEMS MARKET, BY COUNTRY, 2020–2027 (USD MILLION)
                    7.2.1.8 Other clinical information systems
                               TABLE 26 OTHER CLINICAL INFORMATION SYSTEMS MARKET, BY COUNTRY, 2020–2027 (USD MILLION)
           7.2.2 NON-CLINICAL INFORMATION SYSTEMS
                    TABLE 27 NON-CLINICAL INFORMATION SYSTEMS MARKET, BY TYPE, 2020–2027 (USD MILLION)
                    TABLE 28 NONCLINICAL INFORMATION SYSTEMS MARKET, BY COUNTRY, 2020–2027 (USD MILLION)
                    7.2.2.1 Revenue cycle management (RCM) solutions
                               7.2.2.1.1 RCM solutions hold largest share of nonclinical information systems market
                               TABLE 29 COMPANIES PROVIDING RCM SOLUTIONS
                               TABLE 30 REVENUE CYCLE MANAGEMENT SOLUTIONS MARKET, BY COUNTRY, 2020–2027 (USD MILLION)
                    7.2.2.2 Financial management solutions
                               7.2.2.2.1 Cloud-based financial solutions to streamline and automate labor-intensive healthcare financial management functions
                               TABLE 31 COMPANIES PROVIDING FINANCIAL MANAGEMENT SOLUTIONS
                               TABLE 32 FINANCIAL MANAGEMENT SOLUTIONS MARKET, BY COUNTRY, 2020–2027 (USD MILLION)
                    7.2.2.3 Health information exchange (HIE) solutions
                               7.2.2.3.1 Need for timely sharing of vital patient information to drive HIE demand
                               TABLE 33 COMPANIES PROVIDING HIE SOLUTIONS
                               TABLE 34 HEALTH INFORMATION EXCHANGE SOLUTIONS MARKET, BY COUNTRY, 2020–2027 (USD MILLION)
                    7.2.2.4 Supply chain management solutions
                               7.2.2.4.1 Supply chain management solutions to help reduce operational and administrative expenses
                               TABLE 35 SUPPLY CHAIN MANAGEMENT SOLUTIONS MARKET, BY COUNTRY, 2020–2027 (USD MILLION)
                    7.2.2.5 Billing & accounts management solutions
                               7.2.2.5.1 Implementing cloud-based billing to reduce expenses, increase revenue, and improve customer service
                               TABLE 36 BILLING & ACCOUNTS MANAGEMENT SOLUTIONS MARKET, BY COUNTRY, 2020–2027 (USD MILLION)
                    7.2.2.6 Other nonclinical information systems
                               TABLE 37 OTHER NON-CLINICAL INFORMATION SYSTEMS MARKET, BY COUNTRY, 2020–2027 (USD MILLION)
    7.3 HEALTHCARE PAYER SOLUTIONS
           TABLE 38 HEALTHCARE PAYER SOLUTIONS MARKET, BY TYPE, 2020–2027 (USD MILLION)
           TABLE 39 HEALTHCARE PAYER SOLUTIONS MARKET, BY COUNTRY,  2020–2027 (USD MILLION)
           7.3.1 CLAIMS MANAGEMENT SOLUTIONS
                    7.3.1.1 Claims management solutions to help healthcare payers efficiently manage claims processing
                               TABLE 40 CLAIMS MANAGEMENT SOLUTIONS MARKET, BY COUNTRY, 2020–2027 (USD MILLION)
           7.3.2 PAYMENT MANAGEMENT SOLUTIONS
                    7.3.2.1 Payment management solutions connect payers, providers, members, and banks on a single integrated network
                               TABLE 41 PAYMENT MANAGEMENT SOLUTIONS MARKET, BY COUNTRY, 2020–2027 (USD MILLION)
           7.3.3 CUSTOMER RELATIONSHIP MANAGEMENT (CRM) SOLUTIONS
                    7.3.3.1 Healthcare payers to create CRM strategies to meet unique needs of their stakeholders
                               TABLE 42 CUSTOMER RELATIONSHIP MANAGEMENT SOLUTIONS MARKET, BY COUNTRY, 2020–2027 (USD MILLION)
           7.3.4 PROVIDER NETWORK MANAGEMENT (PRM) SOLUTIONS
                    7.3.4.1 PRM solutions to offer reliable and secure connection between provider-payer community
                               TABLE 43 PROVIDER NETWORK MANAGEMENT SOLUTIONS MARKET, BY COUNTRY, 2020–2027 (USD MILLION)
           7.3.5 FRAUD MANAGEMENT SOLUTIONS
                    7.3.5.1 Rising cases of insurance fraud to drive market growth
                               TABLE 44 FRAUD MANAGEMENT SOLUTIONS MARKET, BY COUNTRY, 2020–2027 (USD MILLION)

8 HEALTHCARE CLOUD COMPUTING MARKET, BY COMPONENT (Page No. - 141)
    8.1 INTRODUCTION
           TABLE 45 GLOBAL MARKET, BY COMPONENT, 2020–2027 (USD MILLION)
    8.2 SERVICES
           8.2.1 DEMAND FOR CONSULTING SERVICES TO GROW IN DEVELOPING REGIONS
                    TABLE 46 HEALTHCARE CLOUD COMPUTING SERVICES OFFERED BY KEY MARKET PLAYERS
                    TABLE 47 HEALTHCARE CLOUD COMPUTING SERVICES MARKET, BY COUNTRY, 2020–2027 (USD MILLION)
    8.3 SOFTWARE
           8.3.1 RISING HEALTHCARE COSTS DRIVE SOFTWARE ADOPTION
                    TABLE 48 HEALTHCARE CLOUD COMPUTING SOFTWARE MARKET, BY COUNTRY, 2020–2027 (USD MILLION)

9 HEALTHCARE CLOUD COMPUTING MARKET, BY DEPLOYMENT MODEL (Page No. - 146)
    9.1 INTRODUCTION
           TABLE 49 GLOBAL MARKET, BY DEPLOYMENT MODEL, 2020–2027 (USD MILLION)
    9.2 PRIVATE CLOUD
           9.2.1 PRIVATE CLOUD SEGMENT TO ACCOUNT FOR LARGEST SHARE OF MARKET
                    TABLE 50 PRIVATE CLOUD MARKET, BY COUNTRY, 2020–2027 (USD MILLION)
    9.3 HYBRID CLOUD
           9.3.1 HYBRID CLOUD SEGMENT TO REGISTER HIGHEST GROWTH
                    TABLE 51 HYBRID CLOUD MARKET, BY COUNTRY, 2020–2027 (USD MILLION)
    9.4 PUBLIC CLOUD
           9.4.1 DATA SECURITY AND PRIVACY CONCERNS TO RESTRICT SEGMENT GROWTH
                    TABLE 52 PUBLIC CLOUD MARKET, BY COUNTRY, 2020–2027 (USD MILLION)

10 HEALTHCARE CLOUD COMPUTING MARKET, BY SERVICE MODEL (Page No. - 151)
     10.1 INTRODUCTION
               TABLE 53 GLOBAL MARKET, BY SERVICE MODEL, 2020–2027 (USD MILLION)
     10.2 SOFTWARE-AS-A-SERVICE
             10.2.1 SOFTWARE-AS-A-SERVICE SEGMENT TO DOMINATE GLOBAL MARKET
             10.2.2 BENEFITS OF SOFTWARE-AS-A-SERVICE
                       TABLE 54 SOFTWARE-AS-A-SERVICE MARKET, BY COUNTRY, 2020–2027 (USD MILLION)
     10.3 INFRASTRUCTURE-AS-A-SERVICE
             10.3.1 INFRASTRUCTURE-AS-A-SERVICE SEGMENT TO REGISTER HIGHEST GROWTH DURING FORECAST PERIOD
             10.3.2 BENEFITS OF INFRASTRUCTURE-AS-A-SERVICE
                       TABLE 55 INFRASTRUCTURE-AS-A-SERVICE MARKET, BY COUNTRY, 2020–2027 (USD MILLION)
     10.4 PLATFORM-AS-A-SERVICE
             10.4.1 PLATFORM-AS-A-SERVICE SIMPLIFIES APPLICATION DEVELOPMENT AND DEPLOYMENT ON CLOUD
             10.4.2 BENEFITS OF PLATFORM-AS-A-SERVICE
                       TABLE 56 PLATFORM-AS-A-SERVICE MARKET, BY COUNTRY, 2020–2027 (USD MILLION)

11 HEALTHCARE CLOUD COMPUTING MARKET, BY PRICING MODEL (Page No. - 158)
     11.1 INTRODUCTION
               TABLE 57 GLOBAL MARKET, BY PRICING MODEL, 2020–2027 (USD MILLION)
     11.2 PAY-AS-YOU-GO PRICING MODEL
             11.2.1 PAY-AS-YOU-GO PRICING MODEL SEGMENT TO ACCOUNT FOR LARGEST SHARE DURING FORECAST PERIOD
                       TABLE 58 PAY-AS-YOU-GO PRICING MODEL MARKET, BY COUNTRY, 2020–2027 (USD MILLION)
     11.3 SPOT PRICING MODEL
             11.3.1 SPOT PRICING MODEL OFFERS FLEXIBILITY AND UNLIMITED UTILIZATION OF SERVICES
                       TABLE 59 SPOT PRICING MODEL MARKET, BY COUNTRY, 2020–2027 (USD MILLION)

12 HEALTHCARE CLOUD COMPUTING MARKET, BY END USER (Page No. - 162)
     12.1 INTRODUCTION
               TABLE 60 GLOBAL MARKET, BY END USER, 2020–2027 (USD MILLION)
     12.2 HEALTHCARE PROVIDERS
             12.2.1 HEALTHCARE PROVIDERS USE CLOUD-BASED EMRS TO REDUCE COSTS, ENHANCE PRIVACY, AND FACILITATE BETTER PATIENT CARE
                       TABLE 61 GLOBAL MARKET FOR HEALTHCARE PROVIDERS, BY COUNTRY, 2020–2027 (USD MILLION)
     12.3 HEALTHCARE PAYERS
             12.3.1 CLOUD COMPUTING ENABLES PAYERS TO ACCELERATE THEIR MEDICAL CLAIMS PROCESSING TASKS, ENHANCE CUSTOMER CARE, AND IMPROVE DOCUMENTATION ACTIVITIES
                       TABLE 62 GLOBAL MARKET FOR HEALTHCARE PAYERS, BY COUNTRY, 2020–2027 (USD MILLION)

13 HEALTHCARE CLOUD COMPUTING MARKET, BY REGION (Page No. - 167)
     13.1 INTRODUCTION
               TABLE 63 GLOBAL MARKET, BY REGION, 2020–2027 (USD MILLION)
     13.2 NORTH AMERICA
               FIGURE 34 NORTH AMERICA: HEALTHCARE CLOUD COMPUTING MARKET SNAPSHOT
               TABLE 64 NORTH AMERICA: MARKET, BY COUNTRY, 2020–2027 (USD MILLION)
               TABLE 65 NORTH AMERICA: MARKET, BY PRODUCT, 2020–2027 (USD MILLION)
               TABLE 66 NORTH AMERICA: HEALTHCARE PROVIDER SOLUTIONS MARKET, BY TYPE, 2020–2027 (USD MILLION)
               TABLE 67 NORTH AMERICA: CLINICAL INFORMATION SYSTEMS MARKET, BY TYPE, 2020–2027 (USD MILLION)
               TABLE 68 NORTH AMERICA: NONCLINICAL INFORMATION SYSTEMS MARKET, BY TYPE, 2020–2027 (USD MILLION)
               TABLE 69 NORTH AMERICA: HEALTHCARE PAYER SOLUTIONS MARKET, BY TYPE, 2020–2027 (USD MILLION)
               TABLE 70 NORTH AMERICA: MARKET, BY COMPONENT, 2020–2027 (USD MILLION)
               TABLE 71 NORTH AMERICA: MARKET, BY DEPLOYMENT MODEL, 2020–2027 (USD MILLION)
               TABLE 72 NORTH AMERICA: MARKET, BY SERVICE MODEL, 2020–2027 (USD MILLION)
               TABLE 73 NORTH AMERICA: MARKET, BY PRICING MODEL, 2020–2027 (USD MILLION)
               TABLE 74 NORTH AMERICA: MARKET, BY END USER, 2020–2027 (USD MILLION)
             13.2.1 US
                       13.2.1.1 Increasing healthcare costs and federal mandates encourage adoption of cloud solutions to propel market growth in US
                                   FIGURE 35 US: OFFICE-BASED PHYSICIAN AND HOSPITAL EHR ADOPTION (2008–2019)
                                   TABLE 75 US: MARKET, BY PRODUCT, 2020–2027 (USD MILLION)
                                   TABLE 76 US: HEALTHCARE PROVIDER SOLUTIONS MARKET, BY TYPE,  2020–2027 (USD MILLION)
                                   TABLE 77 US: CLINICAL INFORMATION SYSTEMS MARKET, BY TYPE, 2020–2027 (USD MILLION)
                                   TABLE 78 US: NONCLINICAL INFORMATION SYSTEMS MARKET, BY TYPE, 2020–2027 (USD MILLION)
                                   TABLE 79 US: HEALTHCARE PAYER SOLUTIONS MARKET, BY TYPE, 2020–2027 (USD MILLION)
                                   TABLE 80 US: MARKET, BY COMPONENT,  2020–2027 (USD MILLION)
                                   TABLE 81 US: MARKET, BY DEPLOYMENT MODEL, 2020–2027 (USD MILLION)
                                   TABLE 82 US: MARKET, BY SERVICE MODEL, 2020–2027 (USD MILLION)
                                   TABLE 83 US MARKET, BY PRICING MODEL, 2020–2027 (USD MILLION)
                                   TABLE 84 US: MARKET, BY END USER,  2020–2027 (USD MILLION)
             13.2.2 CANADA
                       13.2.2.1 Deployment of digital health initiatives to drive market growth
                                   FIGURE 36 CANADA: EMR ADOPTION BY PRIMARY CARE PHYSICIANS, 2013–2018
                                   TABLE 85 CANADA: HEALTHCARE CLOUD COMPUTING MARKET, BY PRODUCT, 2020–2027 (USD MILLION)
                                   TABLE 86 CANADA: HEALTHCARE PROVIDER SOLUTIONS MARKET, BY TYPE,  2020–2027 (USD MILLION)
                                   TABLE 87 CANADA: CLINICAL INFORMATION SYSTEMS MARKET, BY TYPE, 2020–2027 (USD MILLION)
                                   TABLE 88 CANADA: NONCLINICAL INFORMATION SYSTEMS MARKET, BY TYPE, 2020–2027 (USD MILLION)
                                   TABLE 89 CANADA: HEALTHCARE PAYER SOLUTIONS MARKET, BY TYPE, 2020–2027 (USD MILLION)
                                   TABLE 90 CANADA: MARKET, BY COMPONENT, 2020–2027 (USD MILLION)
                                   TABLE 91 CANADA: MARKET, BY DEPLOYMENT MODEL, 2020–2027 (USD MILLION)
                                   TABLE 92 CANADA: MARKET, BY SERVICE MODEL, 2020–2027 (USD MILLION)
                                   TABLE 93 CANADA: MARKET, BY PRICING MODEL, 2020–2027 (USD MILLION)
                                   TABLE 94 CANADA: MARKET, BY END USER, 2020–2027 (USD MILLION)
     13.3 EUROPE
               TABLE 95 EUROPE: HEALTHCARE IT INITIATIVES
               TABLE 96 EUROPE: MARKET, BY COUNTRY, 2020–2027 (USD MILLION)
               TABLE 97 EUROPE: MARKET, BY PRODUCT, 2020–2027 (USD MILLION)
               TABLE 98 EUROPE: HEALTHCARE PROVIDER SOLUTIONS MARKET, BY TYPE, 2020–2027 (USD MILLION)
               TABLE 99 EUROPE: CLINICAL INFORMATION SYSTEMS MARKET, BY TYPE, 2020–2027 (USD MILLION)
               TABLE 100 EUROPE: NONCLINICAL INFORMATION SYSTEMS MARKET, BY TYPE, 2020–2027 (USD MILLION)
               TABLE 101 EUROPE: HEALTHCARE PAYER SOLUTIONS MARKET, BY TYPE,  2020–2027 (USD MILLION)
               TABLE 102 EUROPE: MARKET, BY COMPONENT, 2020–2027 (USD MILLION)
               TABLE 103 EUROPE: MARKET, BY DEPLOYMENT MODEL, 2020–2027 (USD MILLION)
               TABLE 104 EUROPE: MARKET, BY SERVICE MODEL, 2020–2027 (USD MILLION)
               TABLE 105 EUROPE: MARKET, BY PRICING MODEL, 2020–2027 (USD MILLION)
               TABLE 106 EUROPE: MARKET, BY END USER,  2020–2027 (USD MILLION)
             13.3.1 GERMANY
                       13.3.1.1 High adoption of EHR systems among primary care physicians to drive market growth
                                   TABLE 107 GERMANY: HEALTHCARE CLOUD COMPUTING MARKET, BY PRODUCT, 2020–2027 (USD MILLION)
                                   TABLE 108 GERMANY: HEALTHCARE PROVIDER SOLUTIONS MARKET, BY TYPE, 2020–2027 (USD MILLION)
                                   TABLE 109 GERMANY: CLINICAL INFORMATION SYSTEMS MARKET, BY TYPE,  2020–2027 (USD MILLION)
                                   TABLE 110 GERMANY: NONCLINICAL INFORMATION SYSTEMS MARKET, BY TYPE, 2020–2027 (USD MILLION)
                                   TABLE 111 GERMANY: HEALTHCARE PAYER SOLUTIONS MARKET, BY TYPE, 2020–2027 (USD MILLION)
                                   TABLE 112 GERMANY: MARKET, BY COMPONENT, 2020–2027 (USD MILLION)
                                   TABLE 113 GERMANY: MARKET, BY DEPLOYMENT MODEL, 2020–2027 (USD MILLION)
                                   TABLE 114 GERMANY: MARKET, BY SERVICE MODEL, 2020–2027 (USD MILLION)
                                   TABLE 115 GERMANY: MARKET, BY PRICING MODEL, 2020–2027 (USD MILLION)
                                   TABLE 116 GERMANY: MARKET, BY END USER, 2020–2027 (USD MILLION)
             13.3.2 UK
                       13.3.2.1 Government initiatives favoring cloud solutions and services adoption to drive market growth
                                   TABLE 117 UK: HEALTHCARE CLOUD COMPUTING INITIATIVES AND FUNDING
                                   TABLE 118 UK: MARKET, BY PRODUCT, 2020–2027 (USD MILLION)
                                   TABLE 119 UK: HEALTHCARE PROVIDER SOLUTIONS MARKET, BY TYPE, 2020–2027 (USD MILLION)
                                   TABLE 120 UK: CLINICAL INFORMATION SYSTEMS MARKET, BY TYPE, 2020–2027 (USD MILLION)
                                   TABLE 121 UK: NONCLINICAL INFORMATION SYSTEMS MARKET, BY TYPE, 2020–2027 (USD MILLION)
                                   TABLE 122 UK: HEALTHCARE PAYER SOLUTIONS MARKET, BY TYPE, 2020–2027 (USD MILLION)
                                   TABLE 123 UK: MARKET, BY COMPONENT, 2020–2027 (USD MILLION)
                                   TABLE 124 UK: MARKET, BY DEPLOYMENT MODEL, 2020–2027 (USD MILLION)
                                   TABLE 125 UK: MARKET, BY SERVICE MODEL, 2020–2027 (USD MILLION)
                                   TABLE 126 UK: MARKET, BY PRICING MODEL,  2020–2027 (USD MILLION)
                                   TABLE 127 UK: MARKET, BY END USER, 2020–2027 (USD MILLION)
             13.3.3 FRANCE
                       13.3.3.1 Favorable government initiatives for connected healthcare solutions to drive market growth
                                   TABLE 128 FRANCE: HEALTHCARE CLOUD COMPUTING MARKET, BY PRODUCT, 2020–2027 (USD MILLION)
                                   TABLE 129 FRANCE: HEALTHCARE PROVIDER SOLUTIONS MARKET, BY TYPE, 2020–2027 (USD MILLION)
                                   TABLE 130 FRANCE: CLINICAL INFORMATION SYSTEMS MARKET, BY TYPE, 2020–2027 (USD MILLION)
                                   TABLE 131 FRANCE: NONCLINICAL INFORMATION SYSTEMS MARKET, BY TYPE, 2020–2027 (USD MILLION)
                                   TABLE 132 FRANCE: HEALTHCARE PAYER SOLUTIONS MARKET, BY TYPE, 2020–2027 (USD MILLION)
                                   TABLE 133 FRANCE: MARKET, BY COMPONENT, 2020–2027 (USD MILLION)
                                   TABLE 134 FRANCE: MARKET, BY DEPLOYMENT MODEL, 2020–2027 (USD MILLION)
                                   TABLE 135 FRANCE: MARKET, BY SERVICE MODEL, 2020–2027 (USD MILLION)
                                   TABLE 136 FRANCE: MARKET, BY PRICING MODEL, 2020–2027 (USD MILLION)
                                   TABLE 137 FRANCE: MARKET, BY END USER, 2020–2027 (USD MILLION)
             13.3.4 ITALY
                       13.3.4.1 Introduction of National ehealth Pact to proper market growth
                                   TABLE 138 ITALY: MARKET, BY PRODUCT, 2020–2027 (USD MILLION)
                                   TABLE 139 ITALY: HEALTHCARE PROVIDER SOLUTIONS MARKET, BY TYPE, 2020–2027 (USD MILLION)
                                   TABLE 140 ITALY: CLINICAL INFORMATION SYSTEMS MARKET, BY TYPE, 2020–2027 (USD MILLION)
                                   TABLE 141 ITALY: NONCLINICAL INFORMATION SYSTEMS MARKET, BY TYPE, 2020–2027 (USD MILLION)
                                   TABLE 142 ITALY: HEALTHCARE PAYER SOLUTIONS MARKET, BY TYPE, 2020–2027 (USD MILLION)
                                   TABLE 143 ITALY: MARKET, BY COMPONENT, 2020–2027 (USD MILLION)
                                   TABLE 144 ITALY: MARKET, BY DEPLOYMENT MODEL, 2020–2027 (USD MILLION)
                                   TABLE 145 ITALY: MARKET, BY SERVICE MODEL, 2020–2027 (USD MILLION)
                                   TABLE 146 ITALY: MARKET, BY PRICING MODEL, 2020–2027 (USD MILLION)
                                   TABLE 147 ITALY: MARKET, BY END USER, 2020–2027 (USD MILLION)
             13.3.5 SPAIN
                       13.3.5.1 High level of mobile phone penetration to drive mhealth market growth
                                   TABLE 148 SPAIN: HEALTHCARE CLOUD COMPUTING MARKET, BY PRODUCT, 2020–2027 (USD MILLION)
                                   TABLE 149 SPAIN: HEALTHCARE PROVIDER SOLUTIONS MARKET, BY TYPE, 2020–2027 (USD MILLION)
                                   TABLE 150 SPAIN: CLINICAL INFORMATION SYSTEMS MARKET, BY TYPE, 2020–2027 (USD MILLION)
                                   TABLE 151 SPAIN: NONCLINICAL INFORMATION SYSTEMS MARKET, BY TYPE, 2020–2027 (USD MILLION)
                                   TABLE 152 SPAIN: HEALTHCARE PAYER SOLUTIONS MARKET, BY TYPE, 2020–2027 (USD MILLION)
                                   TABLE 153 SPAIN: MARKET, BY COMPONENT, 2020–2027 (USD MILLION)
                                   TABLE 154 SPAIN: MARKET, BY DEPLOYMENT MODEL, 2020–2027 (USD MILLION)
                                   TABLE 155 SPAIN: MARKET, BY SERVICE MODEL, 2020–2027 (USD MILLION)
                                   TABLE 156 SPAIN: MARKET, BY PRICING MODEL, 2020–2027 (USD MILLION)
                                   TABLE 157 SPAIN: MARKET, BY END USER, 2020–2027 (USD MILLION)
             13.3.6 REST OF EUROPE
                       TABLE 158 ROE: MARKET, BY PRODUCT, 2020–2027 (USD MILLION)
                       TABLE 159 ROE: HEALTHCARE PROVIDER SOLUTIONS MARKET, BY TYPE, 2020–2027 (USD MILLION)
                       TABLE 160 ROE: CLINICAL INFORMATION SYSTEMS MARKET, BY TYPE, 2020–2027 (USD MILLION)
                       TABLE 161 ROE: NONCLINICAL INFORMATION SYSTEMS MARKET, BY TYPE, 2020–2027 (USD MILLION)
                       TABLE 162 ROE: HEALTHCARE PAYER SOLUTIONS MARKET, BY TYPE, 2020–2027 (USD MILLION)
                       TABLE 163 ROE: MARKET, BY COMPONENT, 2020–2027 (USD MILLION)
                       TABLE 164 ROE: MARKET, BY DEPLOYMENT MODEL, 2020–2027 (USD MILLION)
                       TABLE 165 ROE: MARKET, BY SERVICE MODEL, 2020–2027 (USD MILLION)
                       TABLE 166 ROE: MARKET, BY PRICING MODEL, 2020–2027 (USD MILLION)
                       TABLE 167 ROE: MARKET, BY END USER, 2020–2027 (USD MILLION)
     13.4 ASIA PACIFIC
               FIGURE 37 ASIA PACIFIC: HEALTHCARE CLOUD COMPUTING MARKET SNAPSHOT
               TABLE 168 APAC: MARKET, BY COUNTRY, 2020–2027 (USD MILLION)
               TABLE 169 APAC: MARKET, BY PRODUCT, 2020–2027 (USD MILLION)
               TABLE 170 APAC: HEALTHCARE PROVIDER SOLUTIONS MARKET, BY TYPE, 2020–2027 (USD MILLION)
               TABLE 171 APAC: CLINICAL INFORMATION SYSTEMS MARKET, BY TYPE, 2020–2027 (USD MILLION)
               TABLE 172 APAC: NONCLINICAL INFORMATION SYSTEMS MARKET, BY TYPE, 2020–2027 (USD MILLION)
               TABLE 173 APAC: HEALTHCARE PAYER SOLUTIONS MACRKET, BY TYPE, 2020–2027 (USD MILLION)
               TABLE 174 APAC: MARKET, BY COMPONENT,  2020–2027 (USD MILLION)
               TABLE 175 APAC: MARKET, BY DEPLOYMENT MODEL, 2020–2027 (USD MILLION)
               TABLE 176 APAC: MARKET, BY SERVICE MODEL, 2020–2027 (USD MILLION)
               TABLE 177 APAC: MARKET, BY PRICING MODEL, 2020–2027 (USD MILLION)
               TABLE 178 APAC: MARKET, BY END USER, 2020–2027 (USD MILLION)
             13.4.1 JAPAN
                       13.4.1.1 Growing wireless technologies and evolving mobile healthcare sector to drive market growth
                                   TABLE 179 JAPAN: MARKET, BY PRODUCT, 2020–2027 (USD MILLION)
                                   TABLE 180 JAPAN: HEALTHCARE PROVIDER SOLUTIONS MARKET, BY TYPE, 2020–2027 (USD MILLION)
                                   TABLE 181 JAPAN: CLINICAL INFORMATION SYSTEMS MARKET, BY TYPE, 2020–2027 (USD MILLION)
                                   TABLE 182 JAPAN: NONCLINICAL INFORMATION SYSTEMS MARKET, BY TYPE, 2020–2027 (USD MILLION)
                                   TABLE 183 JAPAN: HEALTHCARE PAYER SOLUTIONS MARKET, BY TYPE, 2020–2027 (USD MILLION)
                                   TABLE 184 JAPAN: MARKET, BY COMPONENT, 2020–2027 (USD MILLION)
                                   TABLE 185 JAPAN: MARKET, BY DEPLOYMENT MODEL, 2020–2027 (USD MILLION)
                                   TABLE 186 JAPAN: MARKET, BY SERVICE MODEL, 2020–2027 (USD MILLION)
                                   TABLE 187 JAPAN: MARKET, BY PRICING MODEL, 2020–2027 (USD MILLION)
                                   TABLE 188 JAPAN: MARKET, BY END USER, 2020–2027 (USD MILLION)
             13.4.2 CHINA
                       13.4.2.1 Strong government support for healthcare reforms and systems digitalization to drive market growth
                                   TABLE 189 CHINA: HEALTHCARE CLOUD COMPUTING MARKET, BY PRODUCT,  2020–2027 (USD MILLION)
                                   TABLE 190 CHINA: HEALTHCARE PROVIDER SOLUTIONS MARKET, BY TYPE, 2020–2027 (USD MILLION)
                                   TABLE 191 CHINA: CLINICAL INFORMATION SYSTEMS MARKET, BY TYPE, 2020–2027 (USD MILLION)
                                   TABLE 192 CHINA: NONCLINICAL INFORMATION SYSTEMS MARKET, BY TYPE, 2020–2027 (USD MILLION)
                                   TABLE 193 CHINA: HEALTHCARE PAYER SOLUTIONS MARKET, BY TYPE, 2020–2027 (USD MILLION)
                                   TABLE 194 CHINA: MARKET, BY COMPONENT, 2020–2027 (USD MILLION)
                                   TABLE 195 CHINA: MARKET, BY DEPLOYMENT MODEL, 2020–2027 (USD MILLION)
                                   TABLE 196 CHINA: MARKET, BY SERVICE MODEL, 2020–2027 (USD MILLION)
                                   TABLE 197 CHINA: MARKET, BY PRICING MODEL, 2020–2027 (USD MILLION)
                                   TABLE 198 CHINA: MARKET, BY END USER,  2020–2027 (USD MILLION)
             13.4.3 INDIA
                       13.4.3.1 Increasing foreign direct investments in healthcare industry to drive market growth
                                   TABLE 199 INDIA: HEALTHCARE CLOUD COMPUTING MARKET, BY PRODUCT, 2020–2027 (USD MILLION)
                                   TABLE 200 INDIA: HEALTHCARE PROVIDER SOLUTIONS MARKET, BY TYPE, 2020–2027 (USD MILLION)
                                   TABLE 201 INDIA: CLINICAL INFORMATION SYSTEMS MARKET, BY TYPE, 2020–2027 (USD MILLION)
                                   TABLE 202 INDIA: NONCLINICAL INFORMATION SYSTEMS MARKET, BY TYPE, 2020–2027 (USD MILLION)
                                   TABLE 203 INDIA: HEALTHCARE PAYER SOLUTIONS MARKET, BY TYPE,  2020–2027 (USD MILLION)
                                   TABLE 204 INDIA: MARKET, BY COMPONENT, 2020–2027 (USD MILLION)
                                   TABLE 205 INDIA: MARKET, BY DEPLOYMENT MODEL, 2020–2027 (USD MILLION)
                                   TABLE 206 INDIA: MARKET, BY SERVICE MODEL, 2020–2027 (USD MILLION)
                                   TABLE 207 INDIA: MARKET, BY PRICING MODEL, 2020–2027 (USD MILLION)
                                   TABLE 208 INDIA: MARKET, BY END USER, 2020–2027 (USD MILLION)
             13.4.4 AUSTRALIA
                       13.4.4.1 Favorable government initiatives to drive market growth
                                   TABLE 209 AUSTRALIA: MARKET, BY PRODUCT, 2020–2027 (USD MILLION)
                                   TABLE 210 AUSTRALIA: HEALTHCARE PROVIDER SOLUTIONS MARKET, BY TYPE, 2020–2027 (USD MILLION)
                                   TABLE 211 AUSTRALIA: CLINICAL INFORMATION SYSTEMS MARKET, BY TYPE, 2020–2027 (USD MILLION)
                                   TABLE 212 AUSTRALIA: NONCLINICAL INFORMATION SYSTEMS MARKET, BY TYPE, 2020–2027 (USD MILLION)
                                   TABLE 213 AUSTRALIA: HEALTHCARE PAYER SOLUTIONS MARKET, BY TYPE,  2020–2027 (USD MILLION)
                                   TABLE 214 AUSTRALIA: MARKET, BY COMPONENT, 2020–2027 (USD MILLION)
                                   TABLE 215 AUSTRALIA: MARKET, BY DEPLOYMENT MODEL, 2020–2027 (USD MILLION)
                                   TABLE 216 AUSTRALIA: MARKET, BY SERVICE MODEL, 2020–2027 (USD MILLION)
                                   TABLE 217 AUSTRALIA: MARKET, BY PRICING MODEL, 2020–2027 (USD MILLION)
                                   TABLE 218 AUSTRALIA: MARKET, BY END USER, 2020–2027 (USD MILLION)
             13.4.5 SINGAPORE
                       13.4.5.1 Gradual shift towards healthcare digitization to drive market growth
                                   TABLE 219 SINGAPORE: MARKET, BY PRODUCT, 2020–2027 (USD MILLION)
                                   TABLE 220 SINGAPORE: HEALTHCARE PROVIDER SOLUTIONS MARKET, BY TYPE, 2020–2027 (USD MILLION)
                                   TABLE 221 SINGAPORE: CLINICAL INFORMATION SYSTEMS MARKET, BY TYPE, 2020–2027 (USD MILLION)
                                   TABLE 222 SINGAPORE: NONCLINICAL INFORMATION SYSTEMS MARKET, BY TYPE, 2020–2027 (USD MILLION)
                                   TABLE 223 SINGAPORE: HEALTHCARE PAYER SOLUTIONS MARKET, BY TYPE, 2020–2027 (USD MILLION)
                                   TABLE 224 SINGAPORE: MARKET, BY COMPONENT, 2020–2027 (USD MILLION)
                                   TABLE 225 SINGAPORE: MARKET, BY DEPLOYMENT MODEL, 2020–2027 (USD MILLION)
                                   TABLE 226 SINGAPORE: MARKET, BY SERVICE MODEL, 2020–2027 (USD MILLION)
                                   TABLE 227 SINGAPORE: MARKET, BY PRICING MODEL, 2020–2027 (USD MILLION)
                                   TABLE 228 SINGAPORE: MARKET, BY END USER, 2020–2027 (USD MILLION)
             13.4.6 REST OF ASIA PACIFIC
                       TABLE 229 ROAPAC: HEALTHCARE CLOUD COMPUTING MARKET, BY PRODUCT, 2020–2027 (USD MILLION)
                       TABLE 230 ROAPAC: HEALTHCARE PROVIDER SOLUTIONS MARKET, BY TYPE, 2020–2027 (USD MILLION)
                       TABLE 231 ROAPAC: CLINICAL INFORMATION SYSTEMS MARKET, BY TYPE, 2020–2027 (USD MILLION)
                       TABLE 232 ROAPAC: NONCLINICAL INFORMATION SYSTEMS MARKET, BY TYPE, 2020–2027 (USD MILLION)
                       TABLE 233 ROAPAC: HEALTHCARE PAYER SOLUTIONS MARKET, BY TYPE, 2020–2027 (USD MILLION)
                       TABLE 234 ROAPAC: MARKET, BY COMPONENT, 2020–2027 (USD MILLION)
                       TABLE 235 ROAPAC: MARKET, BY DEPLOYMENT MODEL, 2020–2027 (USD MILLION)
                       TABLE 236 ROAPAC: MARKET, BY SERVICE MODEL, 2020–2027 (USD MILLION)
                       TABLE 237 ROAPAC: MARKET, BY PRICING MODEL, 2020–2027 (USD MILLION)
                       TABLE 238 ROAPAC: MARKET, BY END USER, 2020–2027 (USD MILLION)
     13.5 LATIN AMERICA
               TABLE 239 LATIN AMERICA: MARKET, BY COUNTRY, 2020–2027 (USD MILLION)
               TABLE 240 LATAM: MARKET, BY PRODUCT, 2020–2027 (USD MILLION)
               TABLE 241 LATAM: HEALTHCARE PROVIDER SOLUTIONS MARKET, BY TYPE, 2020–2027 (USD MILLION)
               TABLE 242 LATAM: CLINICAL INFORMATION SYSTEMS MARKET, BY TYPE, 2020–2027 (USD MILLION)
               TABLE 243 LATAM: NONCLINICAL INFORMATION SYSTEMS MARKET, BY TYPE, 2020–2027 (USD MILLION)
               TABLE 244 LATAM: HEALTHCARE PAYER SOLUTIONS MARKET, BY TYPE, 2020–2027 (USD MILLION)
               TABLE 245 LATAM: MARKET, BY COMPONENT, 2020–2027 (USD MILLION)
               TABLE 246 LATAM: MARKET, BY DEPLOYMENT MODEL, 2020–2027 (USD MILLION)
               TABLE 247 LATAM: MARKET, BY SERVICE MODEL, 2020–2027 (USD MILLION)
               TABLE 248 LATAM: MARKET, BY PRICING MODEL, 2020–2027 (USD MILLION)
               TABLE 249 LATAM: MARKET, BY END USER, 2020–2027 (USD MILLION)
             13.5.1 BRAZIL
                       13.5.1.1 Brazil to account for largest share of Latin American market in 2021
                                   TABLE 250 BRAZIL: HEALTHCARE CLOUD COMPUTING MARKET, BY PRODUCT, 2020–2027 (USD MILLION)
                                   TABLE 251 BRAZIL: HEALTHCARE PROVIDER SOLUTIONS MARKET, BY TYPE, 2020–2027 (USD MILLION)
                                   TABLE 252 BRAZIL: CLINICAL INFORMATION SYSTEMS MARKET, BY TYPE, 2020–2027 (USD MILLION)
                                   TABLE 253 BRAZIL: NONCLINICAL INFORMATION SYSTEMS MARKET, BY TYPE, 2020–2027 (USD MILLION)
                                   TABLE 254 BRAZIL: HEALTHCARE PAYER SOLUTIONS MARKET, BY TYPE, 2020–2027 (USD MILLION)
                                   TABLE 255 BRAZIL: MARKET, BY COMPONENT, 2020–2027 (USD MILLION)
                                   TABLE 256 BRAZIL: MARKET, BY DEPLOYMENT MODEL, 2020–2027 (USD MILLION)
                                   TABLE 257 BRAZIL: MARKET, BY SERVICE MODEL, 2020–2027 (USD MILLION)
                                   TABLE 258 BRAZIL: MARKET, BY PRICING MODEL, 2020–2027 (USD MILLION)
                                   TABLE 259 BRAZIL: MARKET, BY END USER, 2020–2027 (USD MILLION)
             13.5.2 MEXICO
                       13.5.2.1 New government strategies to boost adoption of healthcare cloud computing solutions
                                   TABLE 260 MEXICO: MARKET, BY PRODUCT, 2020–2027 (USD MILLION)
                                   TABLE 261 MEXICO: HEALTHCARE PROVIDER SOLUTIONS MARKET, BY TYPE, 2020–2027 (USD MILLION)
                                   TABLE 262 MEXICO: CLINICAL INFORMATION SYSTEMS MARKET, BY TYPE, 2020–2027 (USD MILLION)
                                   TABLE 263 MEXICO: NONCLINICAL INFORMATION SYSTEMS MARKET, BY TYPE,  2020–2027 (USD MILLION)
                                   TABLE 264 MEXICO: HEALTHCARE PAYER SOLUTIONS MARKET, BY TYPE, 2020–2027 (USD MILLION)
                                   TABLE 265 MEXICO: MARKET, BY COMPONENT, 2020–2027 (USD MILLION)
                                   TABLE 266 MEXICO: MARKET, BY DEPLOYMENT MODEL, 2020–2027 (USD MILLION)
                                   TABLE 267 MEXICO: MARKET, BY SERVICE MODEL, 2020–2027 (USD MILLION)
                                   TABLE 268 MEXICO: MARKET, BY PRICING MODEL, 2020–2027 (USD MILLION)
                                   TABLE 269 MEXICO: MARKET, BY END USER, 2020–2027 (USD MILLION)
             13.5.3 REST OF LATIN AMERICA
                       TABLE 270 ROLATAM: HEALTHCARE CLOUD COMPUTING MARKET, BY PRODUCT, 2020–2027 (USD MILLION)
                       TABLE 271 ROLATAM: HEALTHCARE PROVIDER SOLUTIONS MARKET, BY TYPE, 2020–2027 (USD MILLION)
                       TABLE 272 ROLATAM: CLINICAL INFORMATION SYSTEMS MARKET, BY TYPE, 2020–2027 (USD MILLION)
                       TABLE 273 ROLATAM: NONCLINICAL INFORMATION SYSTEMS MARKET, BY TYPE, 2020–2027 (USD MILLION)
                       TABLE 274 ROLATAM: HEALTHCARE PAYER SOLUTIONS MARKET, BY TYPE, 2020–2027 (USD MILLION)
                       TABLE 275 ROLATAM: MARKET, BY COMPONENT, 2020–2027 (USD MILLION)
                       TABLE 276 ROLATAM: MARKET, BY DEPLOYMENT MODEL, 2020–2027 (USD MILLION)
                       TABLE 277 ROLATAM: MARKET, BY SERVICE MODEL, 2020–2027 (USD MILLION)
                       TABLE 278 ROLATAM: MARKET, BY PRICING MODEL, 2020–2027 (USD MILLION)
                       TABLE 279 ROLATAM: MARKET, BY END USER, 2020–2027 (USD MILLION)
     13.6 MIDDLE EAST & AFRICA
             13.6.1 INCREASING INVESTMENTS IN MODERNIZING HEALTHCARE SYSTEMS TO BOOST MARKET GROWTH
                       TABLE 280 MIDDLE EAST & AFRICA: MARKET, BY PRODUCT, 2020–2027 (USD MILLION)
                       TABLE 281 MIDDLE EAST & AFRICA: HEALTHCARE PROVIDER SOLUTIONS MARKET, BY TYPE, 2020–2027 (USD MILLION)
                       TABLE 282 MIDDLE EAST & AFRICA: CLINICAL INFORMATION SYSTEMS MARKET, BY TYPE, 2020–2027 (USD MILLION)
                       TABLE 283 MIDDLE EAST & AFRICA: NONCLINICAL INFORMATION SYSTEMS MARKET, BY TYPE, 2020–2027 (USD MILLION)
                       TABLE 284 MIDDLE EAST & AFRICA: HEALTHCARE PAYER SOLUTIONS MARKET, BY TYPE, 2020–2027 (USD MILLION)
                       TABLE 285 MIDDLE EAST & AFRICA: MARKET, BY COMPONENT, 2020–2027 (USD MILLION)
                       TABLE 286 MIDDLE EAST & AFRICA: MARKET,  BY DEPLOYMENT MODEL, 2020–2027 (USD MILLION)
                       TABLE 287 MIDDLE EAST & AFRICA: MARKET, BY SERVICE MODEL, 2020–2027 (USD MILLION)
                       TABLE 288 MIDDLE EAST & AFRICA: MARKET, BY PRICING MODEL, 2020–2027 (USD MILLION)
                       TABLE 289 MIDDLE EAST & AFRICA: MARKET, BY END USER, 2020–2027 (USD MILLION)

14 COMPETITIVE LANDSCAPE (Page No. - 282)
     14.1 OVERVIEW
     14.2 KEY PLAYER STRATEGIES/RIGHT-TO-WIN
             14.2.1 OVERVIEW OF STRATEGIES ADOPTED BY PLAYERS IN  HEALTHCARE CLOUD COMPUTING MARKET
     14.3 COMPETITIVE BENCHMARKING
               TABLE 290 FOOTPRINT OF COMPANIES IN GLOBAL MARKET
               TABLE 291 PRODUCT AND SERVICE: COMPANY FOOTPRINT (26 COMPANIES)
               TABLE 292 END USER: COMPANY FOOTPRINT (26 COMPANIES)
               TABLE 293 REGION: COMPANY FOOTPRINT (26 COMPANIES)
     14.4 COMPETITIVE LEADERSHIP MAPPING
             14.4.1 STARS
             14.4.2 EMERGING LEADERS
             14.4.3 PERVASIVE PLAYERS
             14.4.4 PARTICIPANTS
                       FIGURE 38 GLOBAL MARKET: COMPETITIVE LEADERSHIP MAPPING (2021)
     14.5 COMPETITIVE LEADERSHIP MAPPING FOR START-UPS/SMES (SMALL & MEDIUM ENTERPRISES)
             14.5.1 PROGRESSIVE COMPANIES
             14.5.2 DYNAMIC COMPANIES
             14.5.3 STARTING BLOCKS
             14.5.4 RESPONSIVE COMPANIES
                       FIGURE 39 GLOBAL MARKET: COMPETITIVE LEADERSHIP MAPPING FOR OTHER COMPANIES (2021)
     14.6 KEY PLAYERS ANALYSIS: GLOBAL MARKET
               TABLE 294 HEALTHCARE CLOUD COMPUTING MARKET ANALYSIS BY VENDOR TYPE
     14.7 COMPETITIVE SCENARIO
               TABLE 295 PRODUCT LAUNCHES & APPROVALS, 2019–2022
               TABLE 296 DEALS, 2019–2022

15 COMPANY PROFILES (Page No. - 299)
     15.1 KEY PLAYERS
(Business Overview, Products Offered, Recent Developments, and MnM View (Key strengths/Right to Win, trategic Choices Made, and Weaknesses and Competitive Threats))*
             15.1.1 AMAZON WEB SERVICES, INC. (AWS)
                       TABLE 297 AMAZON WEB SERVICES, INC.: BUSINESS OVERVIEW
                       FIGURE 40 AMAZON WEB SERVICES, INC.: COMPANY SNAPSHOT (2021)
             15.1.2 MICROSOFT CORPORATION
                       TABLE 298 MICROSOFT CORPORATION: BUSINESS OVERVIEW
                       FIGURE 41 MICROSOFT CORPORATION: COMPANY SNAPSHOT (2021)
             15.1.3 INTERNATIONAL BUSINESS MACHINES CORPORATION (IBM)
                       TABLE 299 IBM: BUSINESS OVERVIEW
                       FIGURE 42 IBM: COMPANY SNAPSHOT (2020)
             15.1.4 ATHENAHEALTH, INC.
                       TABLE 300 ATHENAHEALTH, INC.: BUSINESS OVERVIEW
             15.1.5 CARECLOUD, INC.
                       TABLE 301 CARECLOUD, INC.: BUSINESS OVERVIEW
                       FIGURE 43 CARECLOUD, INC.: COMPANY SNAPSHOT (2020)
             15.1.6 SIEMENS HEALTHINEERS AG
                       TABLE 302 SIEMENS HEALTHINEERS AG: BUSINESS OVERVIEW
                       FIGURE 44 SIEMENS HEALTHINEERS AG: COMPANY SNAPSHOT (2021)
             15.1.7 ECLINICALWORKS
                       TABLE 303 ECLINICALWORKS: BUSINESS OVERVIEW
             15.1.8 KONINKLIJKE PHILIPS N.V.
                       TABLE 304 KONINKLIJKE PHILIPS N.V.: BUSINESS OVERVIEW
                       FIGURE 45 KONINKLIJKE PHILIPS N.V.: COMPANY SNAPSHOT (2020)
             15.1.9 ALLSCRIPTS HEALTHCARE SOLUTIONS, INC.
                       TABLE 305 ALLSCRIPTS HEALTHCARE SOLUTIONS, INC.: BUSINESS OVERVIEW
                       FIGURE 46 ALLSCRIPTS HEALTHCARE SOLUTIONS, INC.: COMPANY SNAPSHOT (2021)
             15.1.10 NTT DATA CORPORATION
                       TABLE 306 NTT DATA CORPORATION: BUSINESS OVERVIEW
                       FIGURE 47 NTT DATA CORPORATION: COMPANY SNAPSHOT (2020)
             15.1.11 SECTRA AB
                       TABLE 307 SECTRA AB: BUSINESS OVERVIEW
                       FIGURE 48 SECTRA AB: COMPANY SNAPSHOT (2021)
             15.1.12 GE HEALTHCARE
                       TABLE 308 GE HEALTHCARE: BUSINESS OVERVIEW
                       FIGURE 49 GE HEALTHCARE: COMPANY SNAPSHOT (2021)
             15.1.13 NEXTGEN HEALTHCARE, INC.
                       TABLE 309 NEXTGEN HEALTHCARE, INC.: BUSINESS OVERVIEW
                       FIGURE 50 NEXTGEN HEALTHCARE, INC.: COMPANY SNAPSHOT (2021)
             15.1.14 DXC TECHNOLOGY
                       TABLE 310 DXC TECHNOLOGY: BUSINESS OVERVIEW
                       FIGURE 51 DXC TECHNOLOGY: COMPANY SNAPSHOT (2019)
             15.1.15 INFINITT HEALTHCARE CO. LTD.
                       TABLE 311 INFINITT HEALTHCARE CO. LTD.: BUSINESS OVERVIEW
             15.1.16 HYLAND SOFTWARE, INC.
                       TABLE 312 HYLAND SOFTWARE, INC.: BUSINESS OVERVIEW
             15.1.17 SALESFORCE
                       TABLE 313 SALESFORCE, INC.: BUSINESS OVERVIEW
                       FIGURE 52 SALESFORCE, INC.: COMPANY SNAPSHOT (2021)
             15.1.18 FUJIFILM HOLDINGS CORPORATION
                       TABLE 314 FUJIFILM HOLDINGS CORPORATION: BUSINESS OVERVIEW
                       FIGURE 53 FUJIFILM HOLDINGS CORPORATION: COMPANY SNAPSHOT (2020)
             15.1.19 VEPRO EHEALTH SOLUTIONS
                       TABLE 315 VEPRO EHEALTH SOLUTIONS: BUSINESS OVERVIEW
             15.1.20 DELL TECHNOLOGIES, INC.
                       TABLE 316 DELL TECHNOLOGIES, INC.: BUSINESS OVERVIEW
                       FIGURE 54 DELL TECHNOLOGIES, INC.: COMPANY SNAPSHOT (2021)
             15.1.21 ENSOFTEK, INC.
                       TABLE 317 ENSOFTEK, INC.: BUSINESS OVERVIEW
     15.2 OTHER PLAYERS
             15.2.1 ORACLE CORPORATION
             15.2.2 IRON MOUNTAIN, INC.
             15.2.3 CLEARDATA NETWORKS, INC.
             15.2.4 GLOBAL NET ACCESS (GNAX)
             15.2.5 VMWARE, INC.

*Details on Business Overview, Products Offered, Recent Developments, and MnM View (Key strengths/Right to Win, Strategic Choices Made, and Weaknesses and Competitive Threats) might not be captured in case of unlisted companies.

16 APPENDIX (Page No. - 386)
     16.1 DISCUSSION GUIDE
     16.2 KNOWLEDGE STORE: MARKETSANDMARKETS’ SUBSCRIPTION PORTAL
     16.3 AVAILABLE CUSTOMIZATIONS
     16.4 RELATED REPORTS
     16.5 AUTHOR DETAILS

This study involved the extensive use of both primary and secondary sources. The research process involved the study of various factors affecting the industry to identify the segmentation types, key players, competitive landscape, key market dynamics, and key player strategies.

Secondary Research

The secondary research process involved the widespread use of secondary sources, directories, databases (such as Bloomberg Businessweek, Factiva, and D&B Hoovers), white papers, annual reports, company house documents, investor presentations, and SEC filings of companies. Secondary research was used to identify and collect information useful for the extensive, technical, market-oriented, and commercial study of the Healthcare cloud computing market. It was also used to obtain important information about the key players and market classification and segmentation according to industry trends to the bottom-most level, and key developments related to market and technology perspectives. A database of the key industry leaders was also prepared using secondary research.

Primary Research

In the primary research process, various sources from both the supply and demand sides were interviewed to obtain qualitative and quantitative information for this report. The primary sources from the supply side include industry experts such as CEOs, vice presidents, marketing and sales directors, technology & innovation directors, and related key executives from various key companies and organizations operating in the Healthcare cloud computing market. The primary sources from the demand side included industry experts, purchase & sales managers, doctors, and personnel from research organizations. Primary research was conducted to validate the market segmentation, identify key players in the market, and gather insights on key industry trends and key market dynamics.

A breakdown of the primary respondents is provided below:
Healthcare Cloud Computing Market Size, and Share

To know about the assumptions considered for the study, download the pdf brochure

Market Size Estimation

The total size of the Healthcare cloud computing market was arrived at after data triangulation from two different approaches, as mentioned below.

Approach to calculate the revenue of different players in the Healthcare cloud computing market

The size of the global Healthcare cloud computing market was obtained from annual reports, SEC filings, online publications, and extensive primary interviews. A percentage split was applied to arrive at the size of market segments. Further splits were applied to arrive at the size for each sub-segment. These percentage splits were validated by primary participants. The country-level market sizes obtained from the annual reports, SEC filings, online publications, and extensive primary interviews were added up to reach the total market size for regions. By adding up the market sizes for all the regions, the global Healthcare cloud computing market was derived.

Approach to derive the market size and estimate market growth

The market size and market growth were estimated through primary interviews on a regional and global level. All responses were collated, and a weighted average was taken to derive a probabilistic estimate of the market size and growth rate.

Data Triangulation

After arriving at the overall market size—using the market size estimation processes explained above—the market was split into several segments and sub-segments. To complete the overall market engineering process and arrive at the exact statistics of each market segment and subsegment, the data triangulation, and market breakdown procedures were employed, wherever applicable. The data was triangulated by studying various factors and trends from both the demand and supply sides.

Objectives of the Study

  • To define, describe, and forecast the global healthcare cloud computing market by product, component, deployment model, pricing model, service model, end user, and region, in terms of value
  • To forecast the size of the global healthcare cloud computing market with respect to five regions, namely, North America, Europe, Asia Pacific, Latin America, and the Middle East & Africa
  • To provide detailed information regarding the drivers, restraints, opportunities, and challenges influencing the market growth
  • To strategically analyze micromarkets with respect to individual growth trends, prospects, and contributions to the overall market
  • To analyze market opportunities for stakeholders and provide details of the competitive landscape
  • To profile key players in the global healthcare cloud computing market and comprehensively analyze their core competencies and market shares
  • To track and analyze competitive developments such as agreements, partnerships, collaborations, mergers, product/technology developments, and R&D activities of leading players in the global Healthcare cloud computing market

Available Customizations

With the given market data, MarketsandMarkets offers customizations as per the company’s specific needs. The following customization options are available for the report:

Geographic Analysis

  • Further breakdown of the Rest of Asia Pacific Healthcare cloud computing market into South Korea, New Zealand, and other countries
  • Further breakdown of the Rest of Europe Healthcare cloud computing market into Belgium, Russia, the Netherlands, Switzerland, and other countries
  • Further breakdown of the Rest of Latin America Healthcare cloud computing market into the Argentina, Peru, Columbia, Ecuador, and other countries.
Custom Market Research Services

We will customize the research for you, in case the report listed above does not meet with your exact requirements. Our custom research will comprehensively cover the business information you require to help you arrive at strategic and profitable business decisions.

Request Customization

Instant Answers with GPT - Ask Now!

Ask real questions. Get complete answers !
Report Code
HIT 3561
Published ON
Apr, 2022
Choose License Type
BUY NOW
  • SHARE
X
Request Customization
Speak to Analyst
Speak to Analyst
OR FACE-TO-FACE MEETING
PERSONALIZE THIS RESEARCH
  • Triangulate with your Own Data
  • Get Data as per your Format and Definition
  • Gain a Deeper Dive on a Specific Application, Geography, Customer or Competitor
  • Any level of Personalization
REQUEST A FREE CUSTOMIZATION
LET US HELP YOU!
  • What are the Known and Unknown Adjacencies Impacting the Healthcare Cloud Computing Market
  • What will your New Revenue Sources be?
  • Who will be your Top Customer; what will make them switch?
  • Defend your Market Share or Win Competitors
  • Get a Scorecard for Target Partners
CUSTOMIZED WORKSHOP REQUEST
+1-888-600-6441
  • Call Us
  • +1-888-600-6441 (Corporate office hours)
  • +1-888-600-6441 (US/Can toll free)
  • +44-800-368-9399 (UK office hours)
CONNECT WITH US
ABOUT TRUST ONLINE
©2024 MarketsandMarkets Research Private Ltd. All rights reserved
DMCA.com Protection Status Website Feedback