
Computer Vision in Healthcare Market: Growth, Size, Share, and Trends

Computer Vision in Healthcare Market by Product (Processors, Software, Memory Devices, Services), Type (Smart Cameras), Application (Imaging, Surgeries, Hospital Management (Patient Provider Tracking, Scheduling)), End User & Region - Global Forecast to 2030


OVERVIEW
Source: Secondary Research, Interviews with Experts, MarketsandMarkets Analysis
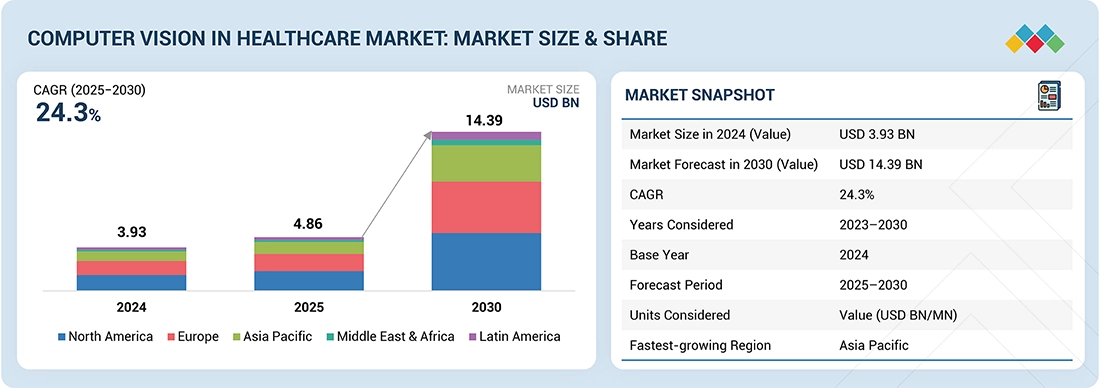
The global computer vision in healthcare market is projected to reach USD 14.39 billion by 2030, up from USD 4.86 billion in 2025, growing at a CAGR of 24.3% during the forecast period. The growth of this market is primarily driven by the regulatory initiatives and incentives that promote the adoption of computer vision in healthcare. Regulatory agencies, such as the FDA and EMA, provide frameworks for validating and approving medical devices and software applications based on computer vision technologies. The increasing adoption of AI for diagnostic imaging and disease detection, demand for automated medical image analysis, and rising use in surgical assistance and remote monitoring is also propelling the growth of the market
KEY TAKEAWAYS
- North America accounted for largest share of 36.6% in 2024.
- Software segment accounted for the largest share of 57.8% in 2024.
- PC-based computer vision systems held a substantial market share in 2024.
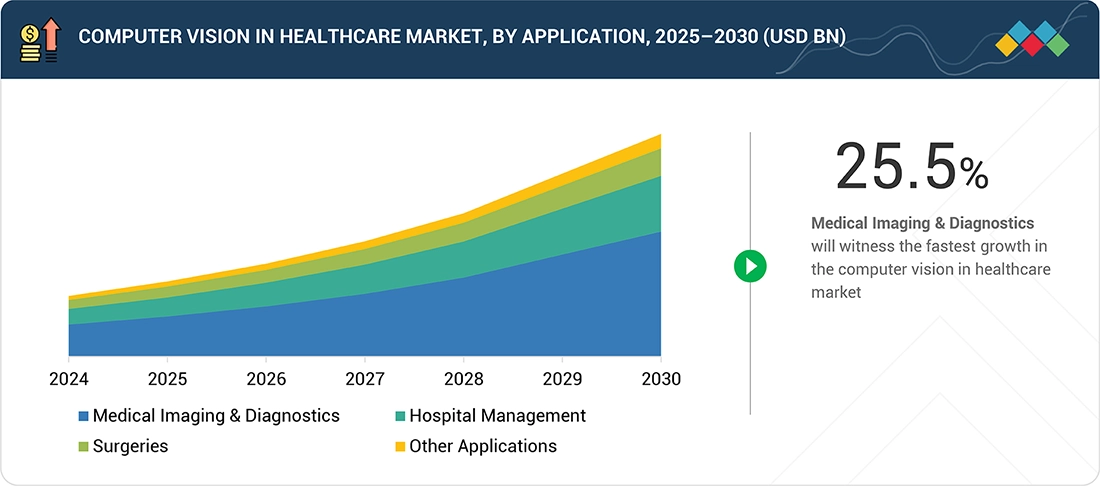
- Medical Imaging & diagnostic segment is expected to register the highest CAGR of 25.5%.
- Healthcare providers segment is expected to grow at the fastest CAGR.
- NVIDIA Corporation, Intel Corporation, Microsoft Corporation were identified as some of the star players in the computer vision in healthcare market (global), given their strong market share and product footprint.
- Viso.AI, Nano-x Itd, Comofi MedTech Pvt. Ltd. among others, have distinguished themselves among startups and SMEs by securing strong footholds in specialized niche areas, underscoring their potential as emerging market leaders.
The growth of the computer vision in healthcare market is driven by rising adoption of automated diagnostic imaging systems for faster and more accurate disease detection, and increasing government funding supporting AI integration in healthcare workflows. Expanding healthcare big data enables superior model training and clinical insights. Computer vision supports precision medicine through real-time analysis of medical imaging, pathology slides, and genomic data for tailored treatments. Additionally, continuous advancements in deep learning, convolutional neural networks (CNNs), and visual recognition algorithms enhance image segmentation, anomaly detection, and surgical navigation accuracy, further driving adoption across radiology, oncology, and surgical robotics.
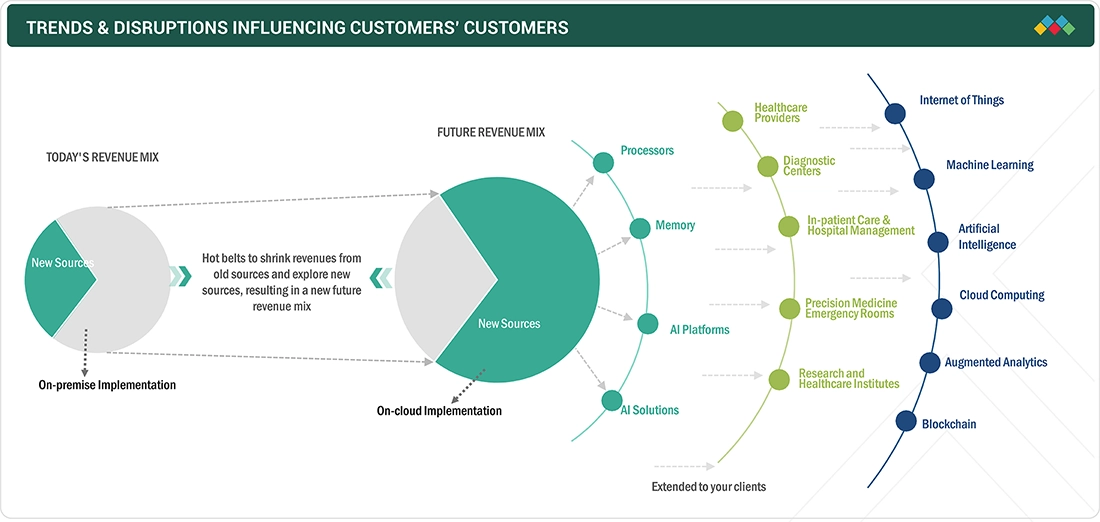
TRENDS & DISRUPTIONS IMPACTING CUSTOMERS' CUSTOMERS
The increasing adoption of artificial intelligence (AI) and machine learning technologies has revolutionized healthcare diagnostics and treatment. Computer vision algorithms analyze medical images with unprecedented speed and accuracy, leading to more efficient diagnoses and personalized treatment plans. This enhanced capability has attracted significant investment from healthcare providers seeking to streamline operations and improve patient outcomes. Additionally, the growing demand for telemedicine and remote patient monitoring solutions, especially in the wake of the COVID-19 pandemic, has further propelled the adoption of computer vision technologies in healthcare. These solutions enable healthcare professionals to remotely assess patients’ conditions through visual data, reducing the need for in-person consultations and enhancing accessibility to care. Moreover, advancements in hardware technologies, such as high-resolution cameras and sensors, have improved the quality and reliability of medical imaging, driving market growth. As a result, the revenue landscape of the computer vision healthcare market is experiencing a significant shift, with companies specializing in AI-driven medical imaging solutions poised for substantial growth and profitability in the coming years.
Source: Secondary Research, Interviews with Experts, MarketsandMarkets Analysis
MARKET DYNAMICS
Level
-
Favorable government initiatives

-
Increasing demand for computer vision systems in healthcare industry

Level
-
Reluctance of medical practitioners to adopt AI-based technologies

-
Lack of awareness and technical knowledge

Level
-
Transition toward cloud-based computer vision systems

-
Unexplored applications

Level
-
Rising security concerns related to cloud-based image processing and analytics

-
Lack of curated data

Source: Secondary Research, Interviews with Experts, MarketsandMarkets Analysis
Driver: Favorable government initiatives
AI-based computer vision solutions are transforming healthcare by analyzing vast volumes of medical imaging and diagnostic data into actionable insights for physicians, radiologists, and researchers, improving care quality. Recognizing these benefits, governments worldwide are promoting AI adoption through strategic initiatives. Germany pledged USD 541.1 million by 2024 to support AI research, infrastructure, and talent development. The US and EU agreed to accelerate AI applications in healthcare, agriculture, and emergency response. India’s National AI Strategy encourages AI in diagnostics, personalized treatment, and pandemic prediction. These efforts are expected to drive widespread adoption of AI-based computer vision, fueling growth in the healthcare market.
Restraint: Reluctance of medical practitioners to adopt AI-based technologies
The growth of digital and mobile health technologies is enabling innovative patient care, with AI tools assisting doctors in diagnosis and treatment. Despite this, some medical practitioners remain reluctant, fearing AI may replace physicians, a concern largely unfounded, as studies indicate a negligible probability of replacement. There is also apprehension that patients might over-rely on AI, potentially undermining doctor-patient relationships. Many healthcare professionals doubt AI’s diagnostic accuracy, making it challenging to demonstrate cost-effectiveness, efficiency, and safety. However, acceptance is gradually increasing as providers recognize AI’s potential benefits and diverse applications, suggesting a rising adoption of AI-based healthcare solutions in the coming decade.
Opportunity: Transition toward cloud-based computer vision systems
Enterprises are increasingly adopting cloud solutions to benefit from easy deployment, faster processing, and user-friendly interfaces. In healthcare, cloud-based computer vision (CV) solutions enable real-time access to critical data, enhancing decision-making and operational efficiency. These solutions offer quick implementation, cost savings, and eliminate infrastructure and maintenance burdens. Additionally, cloud-based CV platforms provide scalability and elasticity, accommodating growing numbers of users within organizations. The combination of these advantages, convenience, cost-effectiveness, and adaptability, is driving strong demand for cloud-based healthcare CV solutions, positioning them as a preferred choice for healthcare providers seeking efficient, flexible, and high-performing technology solutions.
Challenge: Rising security concerns related to cloud-based image processing and analytics
Despite its advantages, cloud computing raises concerns around data integrity, availability, privacy, and confidentiality. Healthcare providers are hesitant to store sensitive data, such as personal health records and diagnostic imaging, in cloud data centers due to risks of breaches, theft, and loss of control. Cloud service providers implement security measures like firewalls and virtualization, but vulnerabilities remain. Legal and regulatory requirements further constrain cloud adoption, as breaches can result in penalties. Since computer vision applications require access to multiple health datasets, AI-based tools must comply with stringent security protocols, making secure cloud deployment complex and challenging.
Computer Vision in Healthcare Market: COMMERCIAL USE CASES ACROSS INDUSTRIES
| COMPANY | USE CASE DESCRIPTION | BENEFITS |
|---|---|---|
 |
Intel processors accelerate AI-driven medical imaging and diagnostic workflows in healthcare applications. | Enhances imaging accuracy, reduces processing time, boosts AI performance up to 4×, and supports faster, precise clinical decision-making. |
 |
Microsoft Azure AI Vision enables cloud-based medical imaging analysis for enhanced healthcare workflows. | Improves diagnostic accuracy, accelerates image processing, streamlines clinical workflows, and supports better patient care outcomes efficiently. |
 |
NVIDIA Clara, BioNeMo, and GPUs provide AI-driven medical imaging analysis, pathology interpretation, and generative drug discovery model deployment. | Enhances diagnostic accuracy, accelerates imaging workflows, enables personalized treatment, reduces drug development timelines, and efficiently deploys AI models for healthcare and biopharma research. |
 |
Google Cloud Vision API and Document AI extract and analyze medical images and healthcare documents efficiently. | Enhances diagnostic accuracy, automates data processing, streamlines clinical workflows, ensures data compliance, and improves overall patient care quality. |
 |
AMD FPGAs and adaptive SoCs enable high-performance medical imaging, diagnostics, and surgical machine vision. | Improves image processing speed, enhances diagnostic accuracy, supports real-time surgical guidance, and enables advanced healthcare automation efficiently. |
Logos and trademarks shown above are the property of their respective owners. Their use here is for informational and illustrative purposes only.
MARKET ECOSYSTEM
The ecosystem of computer vision in healthcare market has been covered. Network connectivity & hardware providers include manufacturers of graphics processing units (GPUs), central processing units/micro processing units (CPUs), field-programmable gate arrays (FPGAs), and application-specific integrated circuits (ASICs). NVIDIA Corporation and Intel Corporation are leading hardware providers. Xilinx is a major FPGA provider; Micron, Microsoft, and Intel Corporation are other hardware providers. Service providers include players such as Microsoft and Intel Corporation. Cloud service providers include Amazon Web Services (AWS), Microsoft Azure, Google Cloud, and Koninklijke Philips N.V. There is increasing market competition between established companies and startups, leading to the launch and development of hardware products and software platforms to run machine learning algorithms and other AI programs. The ecosystem is highly dynamic, as each component of the ecosystem is equally important in accelerating market growth. The need for efficient memory or storage has increased in recent years, mainly due to the increasing data volume and complexities of AI technologies required for complex healthcare applications such as medical imaging and 3D image rendering. Machine learning and deep learning technologies use large data sets, increasing memory requirements. High-bandwidth memory is being developed and deployed for AI applications independent of their computing architecture. Companies such as Micron are the leading companies providing memory solutions for AI applications.
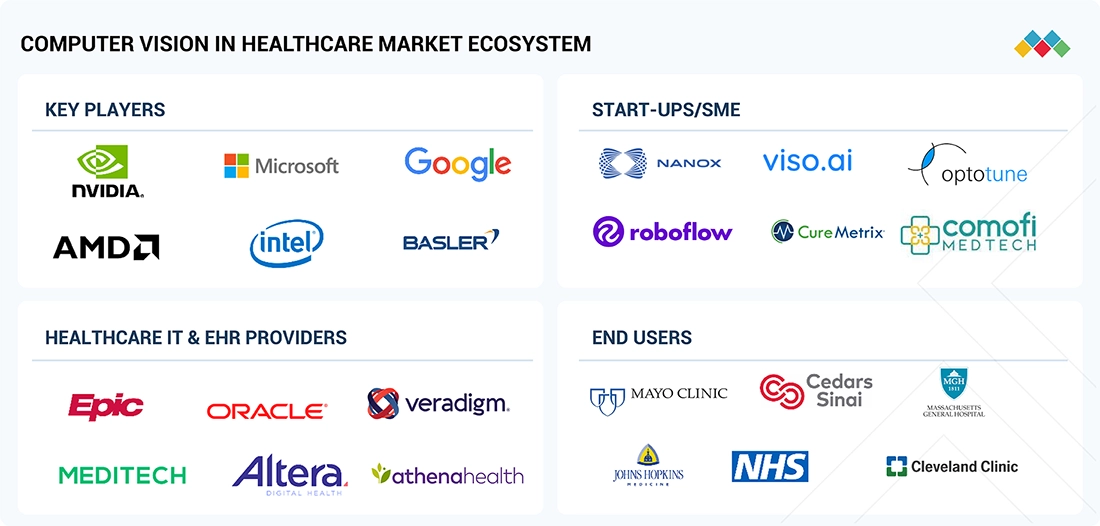
Logos and trademarks shown above are the property of their respective owners. Their use here is for informational and illustrative purposes only.
MARKET SEGMENTS
Source: Secondary Research, Interviews with Experts, MarketsandMarkets Analysis
Computer Vision in Healthcare Market, by Product & Service
The software segment leads the computer vision in healthcare market, by product & service due to its critical role in transforming raw imaging and sensor data into actionable insights. Software solutions, including AI platforms, analytics tools, and diagnostic applications, enable automated detection, disease classification, and predictive analytics, directly supporting clinical decision-making. These platforms integrate seamlessly with diverse hardware, EHR systems, and imaging modalities, enhancing operational efficiency across hospitals and diagnostic centers. Additionally, software-driven solutions facilitate continuous model improvement, scalability, and compliance with regulatory standards, making them vital for precision diagnostics and workflow optimization.
Computer Vision in Healthcare Market, by Type
In 2024, the PC-based computer vision systems segment held the largest share of the computer vision in healthcare market, by type. PC-based computer vision systems offer high processing power, flexibility, and scalability, enabling complex operations at fast speeds. Cameras can connect via USB, FireWire, Camera Link, LVDS, or frame grabbers. These systems support multiple cameras and diverse applications. In healthcare, radiologists use PC-based systems with advanced image processing algorithms to analyze X-rays, MRIs, and CT scans, aiding in disease and abnormality detection.
Computer Vision in Healthcare Market, by Application
In 2024, medical imaging & diagnostics segment dominated the computer vision in healthcare market, by application.Medical images account for nearly 90% of healthcare data, creating a vast and complex dataset for radiologists. AI-based computer vision solutions efficiently interpret this structured and unstructured imaging data, enabling informed decisions. Numerous startups, including Zebra Medical Vision, AiCure, and Mindshare Medical, and major companies like Philips, GE, Agfa-Gevaert, and Siemens Healthineers are developing AI-integrated imaging solutions. Benefits include improved accuracy, faster diagnoses, early disease detection, and reduced healthcare costs.
Computer Vision in Healthcare Market, by End user
In 2024, the hospital segment dominated the computer vision in healthcare market due to its extensive deployment of imaging-intensive diagnostics and patient monitoring systems. Hospitals handle high volumes of radiology, pathology, and surgical imaging data, creating strong demand for AI-driven computer vision solutions to enhance accuracy, reduce errors, and improve workflow efficiency. Integration of advanced imaging modalities like CT, MRI, and ultrasound with AI algorithms enables real-time anomaly detection and predictive analytics. Moreover, hospitals have substantial budgets and infrastructure to adopt these technologies at scale, supported by clinical staff trained in digital tools, making them the primary end users driving market growth.
REGION
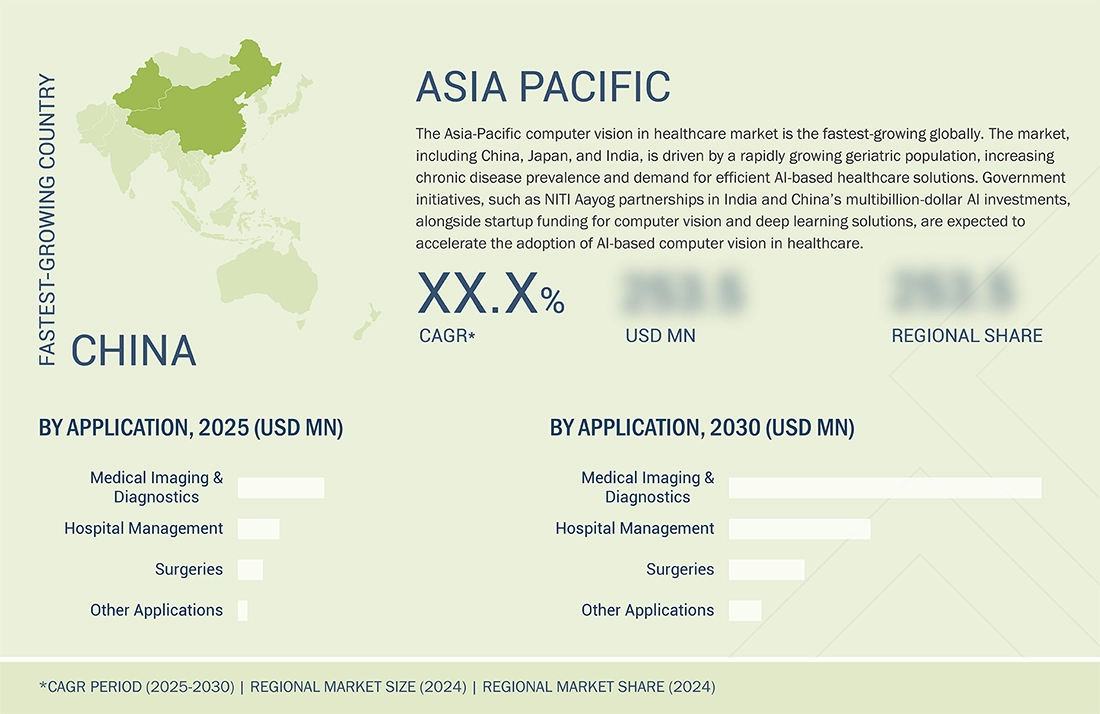
Asia Pacific to be fastest-growing region in global computer vision in healthcare market during forecast period
The Asia Pacific market, comprising China, Japan, India, and other countries, is witnessing growing demand for computer vision-based healthcare solutions, driven by the rising geriatric population. The UN projects the global population aged 60+ will grow from 901 million in 2015 to 1.4 billion by 2030, with Asia Pacific experiencing a 66% increase. This demographic shift is increasing the prevalence of chronic diseases, boosting demand for AI tools to support efficient diagnosis and enhance physician and radiologist productivity. Government initiatives, such as India’s NITI Aayog partnerships and China’s multibillion-dollar AI investment plans, along with startup funding for computer vision and deep learning applications, are further propelling market growth across the region.
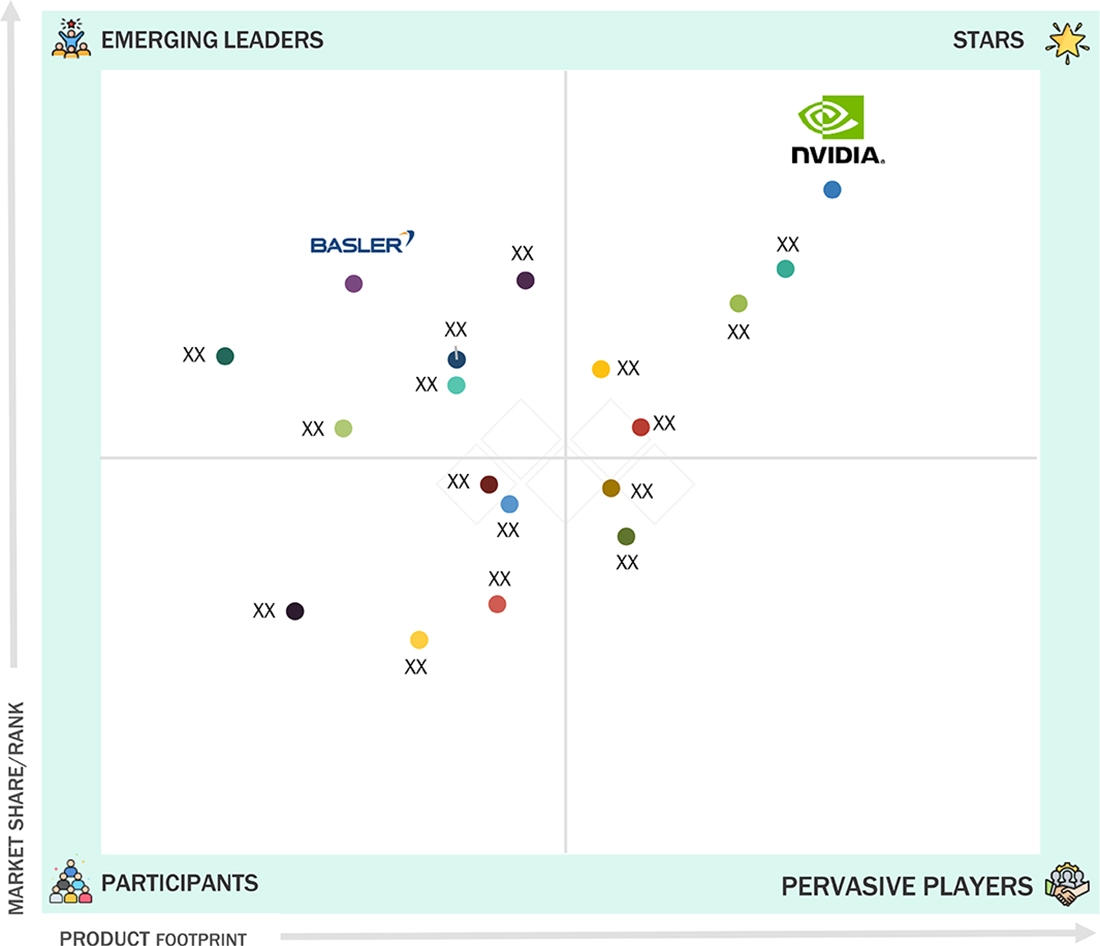
Computer Vision in Healthcare Market: COMPANY EVALUATION MATRIX
In the computer vision in healthcare market, NVIDIA Corporation (Star) leads through its robust GPU and AI-focused platforms, driving innovations in medical imaging, diagnostics, and drug discovery. Its solutions, including NVIDIA Clara and BioNeMo, support AI-powered image analysis, automated diagnostics, and generative AI for biopharma research. Strategic collaborations with GE HealthCare and Microsoft enhance its autonomous imaging systems and cloud-based AI capabilities, strengthening its presence across hospitals, research institutions, and life sciences organizations. Basler AG (Emerging Leader) is gaining traction with its MED ace series cameras, PowerPack for Microscopy, and pylon AI software. Its offerings target medical imaging, academic research, and diagnostics. Operating globally across EMEA, Asia, and the Americas, Basler integrates hardware and AI-driven software solutions to deliver precise, reliable, and scalable computer vision applications in healthcare.
Source: Secondary Research, Interviews with Experts, MarketsandMarkets Analysis
KEY MARKET PLAYERS
MARKET SCOPE
| REPORT METRIC | DETAILS |
|---|---|
| Market Size in 2024 (Value) | USD 3.93 Billion |
| Market Forecast in 2030 (value) | USD 14.39 Billion |
| Growth Rate | CAGR of 24.3% from 2025-2030 |
| Years Considered | 2023-2030 |
| Base Year | 2024 |
| Forecast Period | 2025-2030 |
| Units Considered | Value (USD Million/Billion) |
| Report Coverage | Revenue forecast, company ranking, competitive landscape, growth factors, and trends. |
| Segments Covered |
|
| Regions Covered | North America, Asia Pacific, Europe, Latin America, Middle East & Africa |
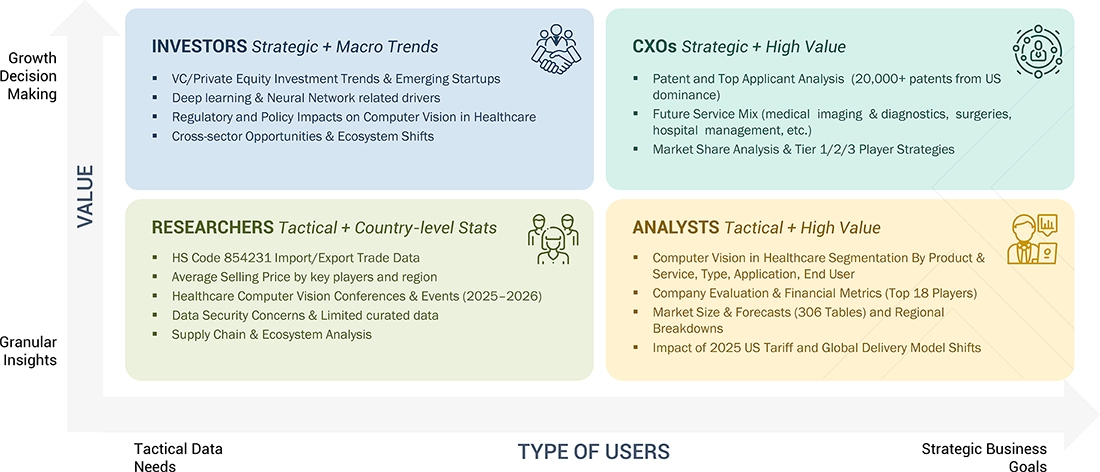
WHAT IS IN IT FOR YOU: Computer Vision in Healthcare Market REPORT CONTENT GUIDE
DELIVERED CUSTOMIZATIONS
We have successfully delivered the following deep-dive customizations:
| CLIENT REQUEST | CUSTOMIZATION DELIVERED | VALUE ADDS |
|---|---|---|
| Local Competitive Landscape |
|
Enables competitive benchmarking, identification of technology and portfolio gaps, and strategic planning for partnership opportunities |
RECENT DEVELOPMENTS
- March 2025 : NVIDIA Corporation and GE HealthCare collaborated to develop autonomous diagnostic imaging systems using the Isaac for Healthcare platform
- November 2024 : Advanced Micro Devices, Inc. (US) launched the Versal Premium Gen 2 FPGA, integrating Compute Express Link (CXL) 3.1 to strengthen its position in AI, cloud, and 5G markets. The new product aligns with the growing demand for high-performance data processing and workload scalability.
- April 2024 : iCAD, Inc. (US) partnered with RAD-AID (US) to enhance breast cancer detection utilizing the AI technology in underserved regions and low- and middle-income countries (LMICs).
- March 2024 : Microsoft (US) and NVIDIA Corporation (US) broadened their long-standing collaboration with robust new integrations that harness cutting-edge NVIDIA generative AI and Omniverse technologies across Microsoft Azure, Azure AI services, Microsoft Fabric, and Microsoft 365.
Table of Contents
 Exclusive indicates content/data unique to MarketsandMarkets and not available with any competitors.
Methodology
The study involved several key activities to estimate the current size of the computer vision in healthcare market. Extensive secondary research was conducted to gather information on this market. The next step was to validate the findings, assumptions, and size estimates by consulting industry experts throughout the value chain through primary research. We employed various methods, including top-down and bottom-up approaches, to estimate the overall market size. Following this, market segmentation and data triangulation techniques were utilized to determine the size of specific segments and subsegments within the computer vision in healthcare market.
Secondary Research
This research study involved the wide use of secondary sources, directories, and databases such as Dun & Bradstreet, Bloomberg Business, and Factiva; whitepapers, annual reports, and companies’ house documents; investor presentations; and the SEC filings of companies. The market for companies providing computer vision in healthcare solutions is assessed using secondary data from paid and free sources. This involves analyzing the product portfolios of major players in the industry and evaluating these companies based on their performance and quality. Various resources were utilized in the secondary research process to gather information for this study. The sources include annual reports, press releases, investor presentations, white papers, academic journals, certified publications, articles by recognized authors, directories, and databases.
The secondary research process involved referring to various secondary sources to identify and collect information related to the study. These sources included annual reports, press releases, investor presentations of computer vision in healthcare vendors, forums, certified publications, and whitepapers. The secondary research was used to obtain critical information on the industry’s value chain, the total pool of key players, market classification, and segmentation from the market and technology-oriented perspectives.
Primary Research
In the primary research process, various sources from both the supply and demand sides were interviewed to obtain qualitative and quantitative information for this report. Primary sources are mainly industry experts from the core and related industries and preferred suppliers, manufacturers, distributors, technology developers, researchers, and organizations related to all segments of this industry’s value chain. In-depth interviews were conducted with various primary respondents, including key industry participants, subject-matter experts (SMEs), C-level executives of key market players, and industry consultants, among other experts, to obtain and verify the critical qualitative and quantitative information as well as assess prospects.
Primary research was conducted to identify segmentation types, industry trends, key players, and key market dynamics such as drivers, restraints, opportunities, challenges, industry trends, and strategies adopted by key players.
After completing the market engineering process, which includes calculations for market statistics, market breakdown, size estimations, forecasting, and data triangulation, extensive primary research was conducted. This research aimed to gather information and verify the critical numbers obtained during the market analysis. Additionally, primary research was conducted to identify different types of market segmentation, analyze industry trends, evaluate the competitive landscape of computer vision in healthcare solutions offered by various players, and understand key market dynamics such as drivers, restraints, opportunities, challenges, industry trends, and strategies employed by key market participants.
In the complete market engineering process, the top-down and bottom-up approaches and several data triangulation methods were extensively used to perform the market estimation and market forecasting for the overall market segments and subsegments listed in this report. Extensive qualitative and quantitative analysis was performed on the complete market engineering process to list the key information/insights throughout the report.
Breakdown of Primary Respondents

Note 1: Other designations include sales managers, marketing managers, and product managers.
Note 2: Tiers are defined based on a company’s total revenue, as of 2024: Tier 1 = >USD 1 billion, Tier 2 = USD 500 million to USD 1 billion, and Tier 3 = < USD 500 million
To know about the assumptions considered for the study, download the pdf brochure
Market Size Estimation
The market size estimates and forecasts provided in this study are derived through a mix of the bottom-up approach (revenue share analysis of leading players) and top-down approach (assessment of utilization/adoption/penetration trends, by product & service, type, application, end user, and region).

Data Triangulation
After arriving at the overall market size, using the market size estimation processes, the market was split into several segments and subsegments. To complete the overall market engineering process and arrive at the exact statistics of each market segment and subsegment, the data triangulation and market breakdown procedures were employed, wherever applicable. The data was triangulated by studying various factors and trends from both the demand and supply sides in the computer vision in healthcare market.
Market Definition
Computer vision is concerned with capturing, processing, and analyzing real-world images and video to allow machines to extract meaningful, contextual information from a single image or sequence of images. Computer vision in healthcare is used in medical image diagnosis, intraoperative imaging, and clinical trials.
Stakeholders
- CV Software and Service Providers
- Healthcare Providers
- AI Solution Providers
- AI Platform Providers
- Business Providers
- Professional Service/Solution Providers
- Research Organizations
- Technology Standard Organizations, Forums, Alliances, and Associations
- Technology Investors
- Venture Capitalists
Report Objectives
- To define, describe, and forecast the global computer vision in healthcare market by product & service, type, application, end user, and region
- To provide detailed information regarding the major factors influencing the growth of the market (such as drivers, restraints, opportunities, and challenges)
- To analyze micromarkets with respect to individual growth trends, prospects, and contributions to the overall computer vision in healthcare market
- To assess the computer vision in healthcare market with regard to Porter’s Five Forces, regulatory landscape, value chain, ecosystem map, patent analysis, and buying criteria
- To analyze opportunities in the market for stakeholders and provide details of the competitive landscape for market leaders
- To forecast the size of the computer vision in healthcare market with respect to five main regions, namely, North America, Europe, the Asia Pacific, Latin America, and the Middle East & Africa
- To profile the key players in the computer vision in healthcare market and comprehensively analyze their core competencies and market shares
- To track and analyze competitive developments such as agreements, partnerships, acquisitions, expansions, product launches & enhancements, and R&D activities in the computer vision in healthcare market
Key Questions Addressed by the Report
Which are the top industry players in the global computer vision in healthcare market?
The top market players in the global computer vision in healthcare market include NVIDIA Corporation (US), Intel Corporation (US), Microsoft Corporation (US), Advanced Micro Devices, Inc. (US), Google, Inc. (US), Basler AG (Germany), AiCure (US), iCAD, Inc. (US), Thermo Fisher Scientific Inc. (US), SenseTime (China), KEYENCE CORPORATION (Japan), Assert AI (India), Artisight (US), LookDeep Inc. (US), care.ai (US), CareView Communications (US), VirtuSense (US), Teton (Denmark), viso.ai (Switzerland), NANO-X IMAGING LTD. (Israel), Comofi Medtech Pvt. Ltd. (India), Avidtechvision (India), Roboflow, Inc. (US), Optotune (US) and CureMetrix, Inc. (US).
Which products & services have been included in the computer vision in healthcare market report?
This report contains the following computer vision in healthcare products:
- Software
- Hardware
- Services
Which geographical region will dominate the global computer vision in healthcare market?
The global computer vision in healthcare market is segmented into North America, Europe, Asia Pacific, Latin America, and the Middle East & Africa. North America is expected to hold the largest share during the forecast period.
Which application segments have been included in the computer vision in healthcare market report?
The report contains the following application segments:
- Medical Imaging & Diagnostics
- Hospital Management
- Surgeries
- Other Applications
What is the total CAGR expected to be recorded for the computer vision in healthcare market during 2025-2030?
The CAGR is expected to record a CAGR of 24.3% during the forecast period.
Need a Tailored Report?
Customize this report to your needs
Get 10% FREE Customization
Customize This ReportPersonalize This Research
- Triangulate with your Own Data
- Get Data as per your Format and Definition
- Gain a Deeper Dive on a Specific Application, Geography, Customer or Competitor
- Any level of Personalization
Let Us Help You
- What are the Known and Unknown Adjacencies Impacting the Computer Vision in Healthcare Market
- What will your New Revenue Sources be?
- Who will be your Top Customer; what will make them switch?
- Defend your Market Share or Win Competitors
- Get a Scorecard for Target Partners

Custom Market Research Services
We Will Customise The Research For You, In Case The Report Listed Above Does Not Meet With Your Requirements
Get 10% Free CustomisationTESTIMONIALS

JAYANT RAJPUROHIT
Director of Market Insights, Data and Analytics
SFI Health,
Leading Pharmaceutical Companywww.sfihealth.com/

We at SFI Health approached MarketsandMarkets for an Opportunity Assessment on "Incidence and Prevalence of Focus Indications" as we wanted to know the most attractive HCPs like Physician, Functional MD, Naturopath and Pharmacist. The project was critical for us to ensure our focus on the right target which would enable sustainable growth and profitability for SFI Health. The business insights provided exceeded our expectations and we were extremely impressed. The team at MarketsandMarkets is highly professional and detail oriented and very well understood our business needs. MarketsandMarkets offers a unique combination of expertise and dedicated engagement model. We identified 2 new products to be launched in coming months, based on the research findings provided by MarketsandMarkets. We are happy with the services and would strongly recommend MarketsandMarkets to my peers in the industry.

BEATRIZ DE LA CALLE
Head of Commercial Analytics
Qualicaps,
Leading Pharmaceutical Companywww.qualicaps.com/

We partnered with MarketsandMarkets for an assessment study on hard empty capsules. The team was extremely professional in understanding our business requirements and we received timely responses to all our queries. The market intelligence and the recommendations has met our business requirements. We were extremely impressed to see the final study results; it really exceeded our expectations. The market intelligence offered by MarketsandMarkets, and clarity on next steps will help us achieve our business objective for the Year 2021. We are happy with the services and would strongly recommend MarketsandMarkets to my peers in the industry.

Bob Williams,
Senior Director Business Development & Innovation
Bracco Diagnostics Inc.,
Italian Multinational in life sciences sector and a World Leader in imaging diagnosticsimaging.bracco.com/us-en
We were pleased with targeted insights that MarketsandMarkets identified from a custom study on the 'Radiation Dose Management Solutions Market'. Your team identified and characterized the market participants as well as underlying trends accurately. This study was useful to Bracco in formulating business strategies for our dose monitoring product lines and we thank MarketsandMarkets for the job well done.
Cody Coonradt,
Market Development and Strategy Manager
3M Health Information Systems,
Leader in Health care Coding, Payment & Analytics Solutions.www.3m.com/3M/en_US/health-information-systems-us
The value for our organization comes from three things: depth of research, specificity of segments and being easy to work with. As important as the first two are, the third can't be underestimated. MarketsandMarkets, maybe more than any other research vendor, wants to know what is top of mind for our team and what big questions we are grappling to answer.
Their customer first approach and high value engagement model, have given us great analysis and excellent value for money


Growth opportunities and latent adjacency in Computer Vision in Healthcare Market