Cold Chain Products Market for Plasma Fractionation by Type (Ultra-low temperature freezer, Plasma freezer, Temperature monitoring devices, Plasma contact shock freezer, Blood transport boxes, Ice-lined refrigerator), End User - Global Forecast to 2027
Market Growth Outlook Summary
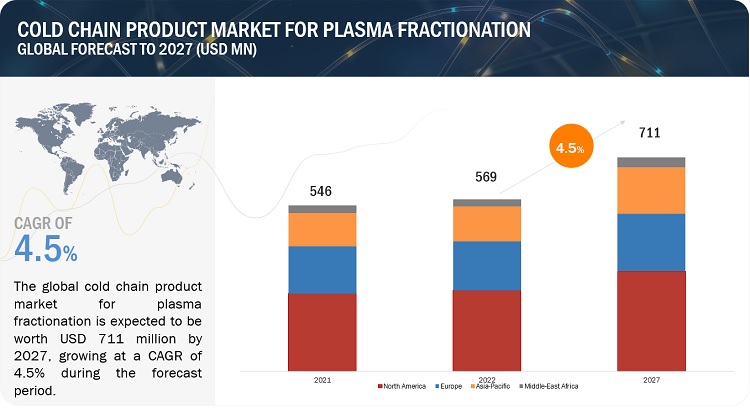
The global cold chain products market, valued at US$546 million in 2021, stood at US$569 million in 2022 and is projected to advance at a resilient CAGR of 4.5% from 2022 to 2027, culminating in a forecasted valuation of US$711 million by the end of the period. The market for cold chain products is expanding because of factors like rising zoonotic disease concerns, Rising use of immunoglobulins and other plasma products in a range of therapeutic area and Increasing demand for Plasma-derived medicinal products. The cold chain products industry is anticipated to develop because of the rising demand for plasma freezers and other cold chain products and the technology adoption by advanced cold storage devices. This is also going to attract international investors to that region.
Cold Chain Products Market for Plasma Fractionation Trends
To know about the assumptions considered for the study, Request for Free Sample Report
Cold Chain Products Market for Plasma Fractionation
Driver: Rising use of immunoglobulins and other plasma products in a range of therapeutic area
Immunoglobulins (IgG), also known as immune globulin or gamma globulin plays a crucial role in the treatment of primary immunodeficiency and various other conditions. Polyvalent immunoglobulins, prepared from multiple donors, are essential for addressing immunological disorders such as primary and secondary immunodeficiencies. Additionally, high-dose immunoglobulins exhibit immune-modulating effects in neurological, hematological, and dermatological immune diseases. Hyperimmune immunoglobulins with specific antibodies are utilized for preventing or treating infections like tetanus, measles, and rabies, as well as preventing hemolytic diseases in newborns. The demand for plasma fractionation is primarily driven by the clinical utilization of immunoglobulins, which has been steadily increasing and is expected to continue growing. This growing demand for plasma therapeutics, specifically immunoglobulins, in high-income countries can lead to the production of surplus amounts of other therapeutic proteins such as albumin. Consequently, the demand for cold chain products in the plasma fractionation market is projected to rise due to the increased usage of immunoglobulins and other plasma products, requiring storage equipment throughout the manufacturing and application process.
Opportunity: Demand for Plasma Fractionation Centre
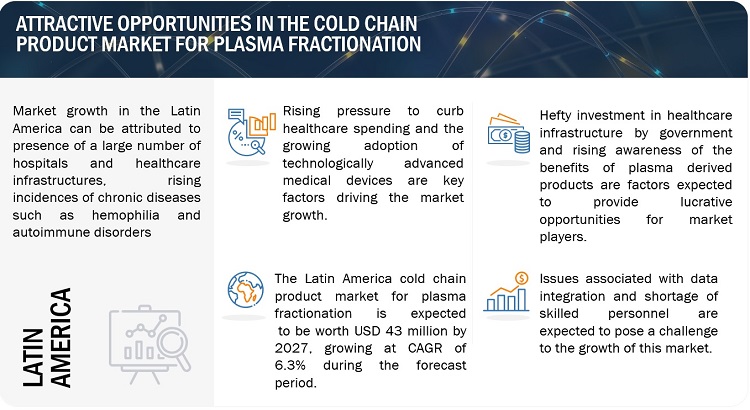
The global demand for plasma-derived products is growing at a rate of approximately 7% per year due to increasing prevalence of diseases like hemophilia, immune deficiency disorders, and alpha-I antitrypsin deficiency. The United States, European Union, and China have the highest demand for these products, driven by the high prevalence of such diseases. Other regions, such as India and Africa, also require plasma fractionation centers. India's large population and high disease prevalence contribute to its demand for plasma-derived products, although the country relies on imports due to low plasma collection rates. Similarly, Africa faces limited availability of these products due to low plasma collection rates, often hindered by infrastructure and resource challenges.
Challenge: Shortage of trained manpower & limited resources to maintain the equipment
Plasma freezers and refrigerators play a critical role in storing temperature-sensitive plasma-based therapies. Maintaining the recommended storage temperature is crucial to preserve the quality and effectiveness of these therapies, which have a short shelf life. However, there is a growing concern about the shortage of skilled manpower and limited resources to maintain this vital storage equipment, particularly in developing countries. Insufficient infrastructure and lack of training among healthcare workers contribute to the risk of wastage and compromise patient care. The increased demand for convalescent plasma during the COVID-19 pandemic has further highlighted these challenges. It is imperative for healthcare facilities to prioritize cold chain management, invest in infrastructure, and provide proper training to ensure efficient storage and availability of plasma-based therapies while minimizing wastage.
Cold Chain Products Market for Plasma Fractionation Ecosystem
The ecosystem of the cold chain products industry for plasma fractionation is made up of the components that are present there and specifies these components with a list of the organizations involved. Manufacturers of different cold chain products include the businesses engaged in research, product development, optimization, and introduction of such goods. Distributors include third parties and e-commerce sites affiliated with the organization for selling these cold chain products, whereas end users are the areas where cold chain products are used.

Temperature monitoring devices segment of Cold Chain Products Industry for Plasma Fractionation is expected to witness the fastest growth in the forecast period.
The cold chain products market for plasma fractionation is divided into seven types such as Ultra-low temperature freezer, Plasma freezer, Temperature monitoring devices, Plasma contact shock freezer, Blood transport boxes, Ice-lined refrigerator, and Others. The market category for Temperature monitoring devices is anticipated to grow at the fastest rate between 2022 and 2027. The rising R&D investment on medical devices like medical freezers and refrigerators are additional factors that are expected to boost market expansion throughout the projected period.
Blood collection centers and blood component providers accounted for the largest share of the Cold Chain Products Industry for Plasma Fractionation.
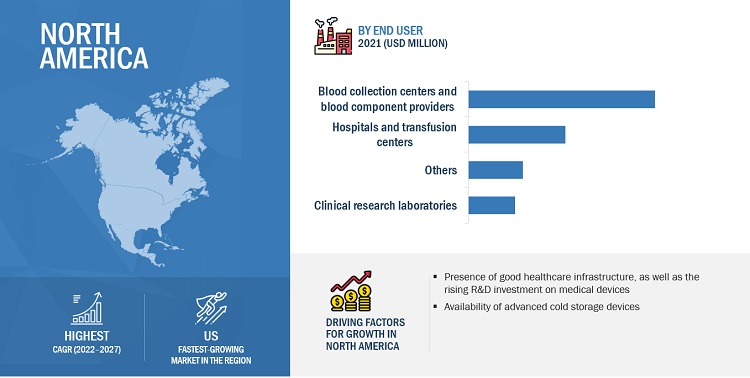
The cold chain products market for plasma fractionation is divided into Blood collection centers and blood component providers, Hospitals and transfusion centers, Clinical research laboratories, and Others based on end users. In 2021, The fastest growing market for Cold Chain Products for Plasma Fractionation, was held by Blood collection centers and blood component providers for cold chain products for plasma fractionation. Rising prevalence of diseases like hemophilia, immune deficiency disorders, and liver diseases, increasing aging population are all factors that contribute to the big proportion of this market.
North America accounted for the largest share of the Cold Chain Products Industry for Plasma Fractionation
The cold chain products market for plasma fractionation is divided into five regions based on geography: North America, Europe, Asia Pacific, Latin America, and the Middle East & Africa. North America held the greatest market share for Cold Chain Products for Plasma Fractionation worldwide. It is anticipated that a major driver impacting the North America market growth would be the rising demand for plasma freezers, and the availability of advanced cold storage devices for labs.
The significant market share of North America is related to the presence of good healthcare infrastructure, as well as the rising R&D investment on medical devices like medical freezers and refrigerators.
To know about the assumptions considered for the study, download the pdf brochure
Key players in the Cold Chain Products Market for Plasma Fractionation are B Medical Systems (US), Blue Star Limited (India), Thermo Fisher Scientific (US), Godrej and Boyce Manufacturing Co. Ltd. (India), Haier Biomedical (China), Eppendorf SE (Germany), Avantor, Inc. (US), Biolife Solutions Inc. (US), and Helmer Scientific Inc. (US)
Scope of the Cold Chain Products Industry
|
Report Metric |
Details |
|
Market Revenue Size in 2022 |
$569 million |
|
Projected Revenue Size by 2027 |
$711 million |
|
Industry Growth Rate |
Poised to Grow at a CAGR of 4.5% |
|
Market Driver |
Rising use of immunoglobulins and other plasma products in a range of therapeutic area |
|
Market Opportunity |
Demand for Plasma Fractionation Centre |
The research report categorizes Cold Chain Products Market for Plasma Fractionation to forecast revenue and analyze trends in each of the following submarkets:
By Type
- Ultra-low temperature freezer
- Plasma freezer
- Temperature monitoring devices
- Plasma contact shock freezer
- Blood transport boxes
- Ice-lined refrigerator
- Others
By End User
- Blood collection centers and blood component providers
- Hospitals and transfusion centers
- Clinical research laboratories
- Others
By Region
-
North America
- US
- Canada
-
Europe
- Germany
- UK
- France
- Spain
- Italy
- Rest of Europe
-
Asia Pacific
- China
- Australia
- Japan
- India
- Rest of APAC
-
Latin America
- Brazil
- Rest of LATAM
-
Middle East and Africa
- Turkey
- Rest of MEA
Recent Developments of Cold Chain Products Industry for Plasma Fractionation
- In January 2023, Haier Biomedical (China) acquired Suzhou Kangsheng (China) to incorporate disposable laboratory plastic consumables into its business portfolio and expand smart laboratory application solution scenarios and rapidly expanding its presence into the field of cryopreserving, cell culture, and microbial applications
- In March 2023, Blue Star launched a range of deep freezers with extra storage and higher cooling capacity, manufactured at its new world-class manufacturing facility at Wada.
- In March 2022, B Medical’s Ultra-Low Freezer U201 received the WHO PQS prequalification. This is the first-ever Ultra-Low Freezer in the world to receive the WHO PQS prequalification.
Frequently Asked Questions (FAQ):
What is the projected growth rate of the global cold chain products market between 2022 and 2027?
The global cold chain products market is projected to grow from USD 569 million in 2022 to USD 711 million by 2027, demonstrating a robust CAGR of 4.5%.
What are the key factors driving the growth of the cold chain products market?
Key factors driving the growth of the cold chain products market include the rising use of immunoglobulins and other plasma products, increasing demand for plasma fractionation centers, and the growing concerns over zoonotic diseases.
What challenges does the cold chain products market face?
The cold chain products market faces challenges such as a shortage of trained manpower, limited resources for maintaining equipment, and insufficient infrastructure, particularly in developing countries, impacting the efficient storage of temperature-sensitive therapies.
Which regions are expected to experience growth in the cold chain products market?
Regions like North America, the European Union, and China are expected to show significant growth due to high demand for plasma-derived products driven by the prevalence of diseases such as hemophilia and immune deficiency disorders.
What types of cold chain products are most commonly used in plasma fractionation?
Common types of cold chain products used in plasma fractionation include ultra-low temperature freezers, plasma freezers, temperature monitoring devices, and ice-lined refrigerators, essential for storing temperature-sensitive plasma-based therapies.
How does the rise in demand for plasma-derived products influence the cold chain products market?
The increase in demand for plasma-derived products, particularly immunoglobulins, significantly drives the cold chain products market as these products require efficient storage and transportation solutions to maintain their quality and effectiveness.
What are the recent developments in the cold chain products market?
Recent developments include the acquisition of Suzhou Kangsheng by Haier Biomedical for expanding smart laboratory applications and the introduction of advanced deep freezers by Blue Star to enhance storage capabilities for plasma products.
What role do blood collection centers play in the cold chain products market?
Blood collection centers are key players in the cold chain products market, as they account for the largest share due to their crucial role in the collection, storage, and distribution of plasma-derived products.
How does the aging population impact the cold chain products market?
The aging population contributes to an increased incidence of diseases requiring plasma-derived therapies, thus driving the demand for cold chain products to ensure safe and effective storage and distribution.
What technological advancements are shaping the cold chain products market?
Technological advancements in cold chain products, such as the development of advanced temperature monitoring devices and automated storage systems, are enhancing the efficiency and reliability of storing plasma-derived products, facilitating market growth.
To speak to our analyst for a discussion on the above findings, click Speak to Analyst


- 5.1 INTRODUCTION
-
5.2 MARKET DYNAMICSDRIVERS- Rising use of immunoglobulins and other plasma products- Increasing demand for plasma-derived medicinal products to treat chronic diseases- Technological advancements in refrigeration equipment and systemsOPPORTUNITIES- Demand for plasma fractionation centers- Government support for cold chain infrastructure developmentCHALLENGES- Shortage of trained manpower and limited resources to maintain equipment- Stringent government regulations- Environmental concerns regarding greenhouse gas emissions
-
5.3 PRICING ANALYSISAVERAGE SELLING PRICE OF COLD CHAIN PRODUCTS MARKET FOR PLASMA FRACTIONATION, BY TYPEAVERAGE SELLING PRICE TRENDS
- 5.4 SUPPLY CHAIN ANALYSIS
-
5.5 ECOSYSTEM ANALYSIS
-
5.6 PATENT ANALYSIS
- 5.7 VALUE CHAIN ANALYSIS
-
5.8 TECHNOLOGY ANALYSISKEY TECHNOLOGY- Ultra-low freezer technologyADJACENT TECHNOLOGY- Cryopreservation
-
5.9 REGULATORY LANDSCAPEREGULATORY ANALYSIS- North America- Europe- Asia Pacific- Latin America- Middle East and AfricaREGULATORY BODIES, GOVERNMENT AGENCIES, AND OTHER ORGANIZATION
-
5.10 PORTER’S FIVE FORCES ANALYSISINTENSITY OF COMPETITIVE RIVALRYBARGAINING POWER OF SUPPLIERSBARGAINING POWER OF BUYERSTHREAT OF NEW ENTRANTSTHREAT OF SUBSTITUTES
- 5.11 KEY CONFERENCES AND EVENTS, 2023–2024
-
5.12 KEY STAKEHOLDERS AND BUYING CRITERIAKEY STAKEHOLDERS IN BUYING PROCESSBUYING CRITERIA
- 5.13 TRADE ANALYSIS
- 5.14 COLD CHAIN PRODUCTS MARKET FOR PLASMA FRACTIONATION: RECESSION IMPACT
- 6.1 INTRODUCTION
-
6.2 ULTRA-LOW-TEMPERATURE FREEZERSRISING DEMAND IN PLASMA STORAGE APPLICATIONS TO DRIVE MARKET GROWTH
-
6.3 PLASMA FREEZERSRISING DEMAND IN SCIENTIFIC AND THERAPEUTIC APPLICATIONS TO BOOST GROWTH
-
6.4 TEMPERATURE MONITORING DEVICESADOPTION OF NOVEL TECHNOLOGIES IN TEMPERATURE MONITORING DEVICES TO PROPEL MARKET
-
6.5 PLASMA CONTACT SHOCK FREEZERSNEED FOR RAPID FREEZING IN PLASMA TRANSPORT TO DRIVE MARKET
-
6.6 BLOOD TRANSPORT BOXESRISING ADOPTION OF TEMPERATURE-CONTROLLED BOXES TO TRANSPORT PLASMA FRACTIONATED COMPOUNDS TO DRIVE MARKET
-
6.7 ICE-LINED REFRIGERATORSCOST-EFFECTIVENESS TO PROPEL END-USER ADOPTION
- 6.8 OTHER PRODUCTS
- 7.1 INTRODUCTION
-
7.2 BLOOD COLLECTION CENTERS & BLOOD COMPONENT PROVIDERSRISING DEMAND FOR PLASMA-DERIVED PRODUCTS TO DRIVE MARKET GROWTH
-
7.3 HOSPITALS & TRANSFUSION CENTERSNEED TO ENSURE SAFE COLLECTION, STORAGE, AND COLD CHAIN MANAGEMENT OF PLASMA TO DRIVE MARKET GROWTH
-
7.4 CLINICAL RESEARCH LABORATORIESROLE OF LABS IN PLASMA FRACTIONATION AND COLD CHAIN PRODUCT DEVELOPMENT TO BOOST MARKET GROWTH
- 7.5 OTHER END USERS
- 8.1 INTRODUCTION
-
8.2 NORTH AMERICANORTH AMERICA: RECESSION IMPACTUS- US to hold largest share of North American marketCANADA- Growing pharma R&D and increasing use of plasma-derived compounds to boost market
-
8.3 EUROPEEUROPE: RECESSION IMPACTGERMANY- Germany to dominate European marketFRANCE- Growing biotech & pharma industry and high prevalence of bleeding disorders to drive marketUK- Rising incidence of hemophilia and growing consumption of coagulation factors to propel marketITALY- Strong pharma sector and rising geriatric population to support marketSPAIN- Rising chronic disease prevalence to boost demandREST OF EUROPE
-
8.4 ASIA PACIFICASIA PACIFIC: RECESSION IMPACTCHINA- China to dominate Asia Pacific marketJAPAN- Growing aging population and rising prevalence of neurological disorders to propel growthINDIA- Growing pharma-biotech industry to drive demandSOUTH KOREA- Rising awareness, advancements in medical treatments, and aging population to drive marketAUSTRALIA- Rising demand for plasma products to treat chronic diseases to propel marketREST OF ASIA PACIFIC
-
8.5 LATIN AMERICARISING INVESTMENTS IN BRAZIL AND GROWING DISEASE PREVALENCE ACROSS LATAM TO BOOST MARKETLATIN AMERICA: RECESSION IMPACT
-
8.6 MIDDLE EAST & AFRICAINFRASTRUCTURAL DEVELOPMENT IN HEALTHCARE TO OFFER GROWTH OPPORTUNITIESMIDDLE EAST & AFRICA: RECESSION IMPACT

- 9.1 OVERVIEW
- 9.2 KEY PLAYER STRATEGIES
- 9.3 REVENUE SHARE ANALYSIS FOR KEY PLAYERS IN COLD CHAIN PRODUCTS MARKET FOR PLASMA FRACTIONATION
- 9.4 MARKET SHARE ANALYSIS
-
9.5 COMPANY EVALUATION QUADRANT (KEY COMPANIES), 2021STARSPERVASIVE PLAYERSEMERGING LEADERSPARTICIPANTS
- 9.6 COMPETITIVE BENCHMARKING
-
9.7 COMPETITIVE SCENARIOPRODUCT LAUNCHES & APPROVALSDEALSOTHER DEVELOPMENTS
-
10.1 KEY PLAYERSTHERMO FISHER SCIENTIFIC, INC.- Business overview- Products offered- Recent developments- MnM ViewHAIER BIOMEDICAL (HAIER GROUP)- Business overview- Products offered- Recent developments- MnM ViewEPPENDORF SE- Business overview- Products offered- Recent developments- MnM viewB MEDICAL SYSTEMS (AZENTA)- Business overview- Products offered- Recent developmentsBLUE STAR LIMITED- Business overview- Products offered- Recent developmentsAVANTOR, INC.- Business overview- Products offeredGODREJ AND BOYCE MANUFACTURING CO. LTD.- Business overview- Products offeredBIOLIFE SOLUTIONS- Business overview- Products offered- Recent developmentsHELMER SCIENTIFIC- Business overview- Products offered- Recent developmentsVESTFROST SOLUTIONS A/S- Business overview- Products offeredJEIO TECH INC.- Business overview- Products offeredDEEPEE COOLING PRODUCTS- Business overview- Products offeredBERLINGER & CO. AG- Business overview- Products offered- Recent developmentsMONNIT CORPORATION- Business overview- Products offeredZHEJIANG HELI REFRIGERATION EQUIPMENT CO. LTD.- Business overview- Products offered
-
10.2 OTHER PLAYERSQINGDAO CAREBIOS BIOLOGICAL TECHNOLOGY CO., LTDEBAC CO., LTD.BIOTECNOZHONGKE MEILING CRYOGENICS CO., LTD.BIONICS SCIENTIFIC TECHNOLOGIES (P) LTD.STERICOX INDIA PRIVATE LIMITEDENVIRO TECHNOLOGIESWITHNELL SENSORSTECNOSOFT SRLPHILIPP KIRSCH GMBH
- 11.1 DISCUSSION GUIDE
- 11.2 KNOWLEDGESTORE: MARKETSANDMARKETS’ SUBSCRIPTION PORTAL
- 11.3 RELATED REPORTS
- 11.4 AUTHOR DETAILS
- TABLE 1 PLASMA-DERIVED MEDICINAL PRODUCTS AND THEIR CLINICAL INDICATIONS
- TABLE 2 AVERAGE SELLING PRICE OF COLD CHAIN PRODUCTS, BY TYPE (USD)
- TABLE 3 NORTH AMERICA: REGULATORY BODIES, GOVERNMENT AGENCIES, AND OTHER ORGANIZATIONS
- TABLE 4 EUROPE: REGULATORY BODIES, GOVERNMENT AGENCIES, AND OTHER ORGANIZATIONS
- TABLE 5 ASIA PACIFIC AND ROW: REGULATORY BODIES, GOVERNMENT AGENCIES, AND OTHER ORGANIZATIONS
- TABLE 6 PORTER’S FIVE FORCES ANALYSIS: COLD CHAIN PRODUCTS MARKET FOR PLASMA FRACTIONATION
- TABLE 7 COLD CHAIN PRODUCTS MARKET FOR PLASMA FRACTIONATION: KEY CONFERENCES AND EVENTS, 2023–2024
- TABLE 8 INFLUENCE OF STAKEHOLDERS ON BUYING PROCESS FOR TOP THREE TYPES OF COLD CHAIN PRODUCTS MARKET FOR PLASMA FRACTIONATION
- TABLE 9 KEY BUYING CRITERIA FOR TOP THREE TYPES OF COLD CHAIN PRODUCTS FOR PLASMA FRACTIONATION
- TABLE 10 EXPORTS OF COLD CHAIN STORAGE LABORATORY EQUIPMENT (2022)
- TABLE 11 IMPORTS OF COLD CHAIN STORAGE LABORATORY EQUIPMENT (2022)
- TABLE 12 COLD CHAIN PRODUCTS MARKET FOR PLASMA FRACTIONATION, BY TYPE, 2020–2027 (USD MILLION)
- TABLE 13 COLD CHAIN PRODUCTS MARKET FOR PLASMA FRACTIONATION, BY COUNTRY, 2020–2027 (USD MILLION)
- TABLE 14 ULTRA-LOW-TEMPERATURE FREEZERS MARKET, BY COUNTRY, 2020–2027 (USD MILLION)
- TABLE 15 PLASMA FREEZERS MARKET, BY COUNTRY, 2020–2027 (USD MILLION)
- TABLE 16 TEMPERATURE MONITORING DEVICES MARKET, BY COUNTRY, 2020–2027 (USD MILLION)
- TABLE 17 PLASMA CONTACT SHOCK FREEZERS MARKET, BY COUNTRY, 2020–2027 (USD MILLION)
- TABLE 18 BLOOD TRANSPORT BOXES MARKET, BY COUNTRY, 2020–2027 (USD MILLION)
- TABLE 19 ICE-LINED REFRIGERATORS MARKET, BY COUNTRY, 2020–2027 (USD MILLION)
- TABLE 20 OTHER COLD CHAIN PRODUCTS MARKET, BY COUNTRY, 2020–2027 (USD MILLION)
- TABLE 21 COLD CHAIN PRODUCTS MARKET FOR PLASMA FRACTIONATION, BY END USER, 2020–2027 (USD MILLION)
- TABLE 22 COLD CHAIN PRODUCTS MARKET FOR BLOOD COLLECTION CENTERS & BLOOD COMPONENT PROVIDERS, BY COUNTRY, 2020–2027 (USD MILLION)
- TABLE 23 COLD CHAIN PRODUCTS MARKET FOR HOSPITALS & TRANSFUSION CENTERS, BY COUNTRY, 2020–2027 (USD MILLION)
- TABLE 24 COLD CHAIN PRODUCTS MARKET FOR CLINICAL RESEARCH LABORATORIES, BY COUNTRY, 2020–2027 (USD MILLION)
- TABLE 25 COLD CHAIN PRODUCTS MARKET FOR OTHER END USERS, BY COUNTRY, 2020–2027 (USD MILLION)
- TABLE 26 COLD CHAIN PRODUCTS MARKET FOR PLASMA FRACTIONATION, BY REGION, 2020–2027 (USD MILLION)
- TABLE 27 NORTH AMERICA: COLD CHAIN PRODUCTS MARKET FOR PLASMA FRACTIONATION, BY COUNTRY, 2020–2027 (USD MILLION)
- TABLE 28 NORTH AMERICA: COLD CHAIN PRODUCTS MARKET FOR PLASMA FRACTIONATION, BY TYPE, 2020–2027 (USD MILLION)
- TABLE 29 NORTH AMERICA: COLD CHAIN PRODUCTS MARKET FOR PLASMA FRACTIONATION, BY END USER, 2020–2027 (USD MILLION)
- TABLE 30 US: COLD CHAIN PRODUCTS MARKET FOR PLASMA FRACTIONATION, BY TYPE, 2020–2027 (USD MILLION)
- TABLE 31 US: COLD CHAIN PRODUCTS MARKET FOR PLASMA FRACTIONATION, BY END USER, 2020–2027 (USD MILLION)
- TABLE 32 CANADA: COLD CHAIN PRODUCTS MARKET FOR PLASMA FRACTIONATION, BY TYPE, 2020–2027 (USD MILLION)
- TABLE 33 CANADA: COLD CHAIN PRODUCTS MARKET FOR PLASMA FRACTIONATION, BY END USER, 2020–2027 (USD MILLION)
- TABLE 34 EUROPE: COLD CHAIN PRODUCTS MARKET FOR PLASMA FRACTIONATION, BY COUNTRY, 2020–2027 (USD MILLION)
- TABLE 35 EUROPE: COLD CHAIN PRODUCTS MARKET FOR PLASMA FRACTIONATION, BY TYPE, 2020–2027 (USD MILLION)
- TABLE 36 EUROPE: COLD CHAIN PRODUCTS MARKET FOR PLASMA FRACTIONATION, BY END USER, 2020–2027 (USD MILLION)
- TABLE 37 GERMANY: COLD CHAIN PRODUCTS MARKET FOR PLASMA FRACTIONATION, BY TYPE, 2020–2027 (USD MILLION)
- TABLE 38 GERMANY: COLD CHAIN PRODUCTS MARKET FOR PLASMA FRACTIONATION, BY END USER, 2020–2027 (USD MILLION)
- TABLE 39 FRANCE: COLD CHAIN PRODUCTS MARKET FOR PLASMA FRACTIONATION, BY TYPE, 2020–2027 (USD MILLION)
- TABLE 40 FRANCE: COLD CHAIN PRODUCTS MARKET FOR PLASMA FRACTIONATION, BY END USER, 2020–2027 (USD MILLION)
- TABLE 41 UK: COLD CHAIN PRODUCTS MARKET FOR PLASMA FRACTIONATION, BY TYPE, 2020–2027 (USD MILLION)
- TABLE 42 UK: COLD CHAIN PRODUCTS MARKET FOR PLASMA FRACTIONATION, BY END USER, 2020–2027 (USD MILLION)
- TABLE 43 ITALY: COLD CHAIN PRODUCTS MARKET FOR PLASMA FRACTIONATION, BY TYPE, 2020–2027 (USD MILLION)
- TABLE 44 ITALY: COLD CHAIN PRODUCTS MARKET FOR PLASMA FRACTIONATION, BY END USER, 2020–2027 (USD MILLION)
- TABLE 45 SPAIN: COLD CHAIN PRODUCTS MARKET FOR PLASMA FRACTIONATION, BY TYPE, 2020–2027 (USD MILLION)
- TABLE 46 SPAIN: COLD CHAIN PRODUCTS MARKET FOR PLASMA FRACTIONATION, BY END USER, 2020–2027 (USD MILLION)
- TABLE 47 REST OF EUROPE: COLD CHAIN PRODUCTS MARKET FOR PLASMA FRACTIONATION, BY TYPE, 2020–2027 (USD MILLION)
- TABLE 48 REST OF EUROPE: COLD CHAIN PRODUCTS MARKET FOR PLASMA FRACTIONATION, BY END USER, 2020–2027 (USD MILLION)
- TABLE 49 ASIA PACIFIC: COLD CHAIN PRODUCTS MARKET FOR PLASMA FRACTIONATION, BY COUNTRY, 2020–2027 (USD MILLION)
- TABLE 50 ASIA PACIFIC: COLD CHAIN PRODUCTS MARKET FOR PLASMA FRACTIONATION, BY TYPE, 2020–2027 (USD MILLION)
- TABLE 51 ASIA PACIFIC: COLD CHAIN PRODUCTS MARKET FOR PLASMA FRACTIONATION, BY END USER, 2020–2027 (USD MILLION)
- TABLE 52 CHINA: COLD CHAIN PRODUCTS MARKET FOR PLASMA FRACTIONATION, BY TYPE, 2020–2027 (USD MILLION)
- TABLE 53 CHINA: COLD CHAIN PRODUCTS MARKET FOR PLASMA FRACTIONATION, BY END USER, 2020–2027 (USD MILLION)
- TABLE 54 JAPAN: COLD CHAIN PRODUCTS MARKET FOR PLASMA FRACTIONATION, BY TYPE, 2020–2027 (USD MILLION)
- TABLE 55 JAPAN: COLD CHAIN PRODUCTS MARKET FOR PLASMA FRACTIONATION, BY END USER, 2020–2027 (USD MILLION)
- TABLE 56 INDIA: COLD CHAIN PRODUCTS MARKET FOR PLASMA FRACTIONATION, BY TYPE, 2020–2027 (USD MILLION)
- TABLE 57 INDIA: COLD CHAIN PRODUCTS MARKET FOR PLASMA FRACTIONATION, BY END USER, 2020–2027 (USD MILLION)
- TABLE 58 SOUTH KOREA: COLD CHAIN PRODUCTS MARKET FOR PLASMA FRACTIONATION, BY TYPE, 2020–2027 (USD MILLION)
- TABLE 59 SOUTH KOREA: COLD CHAIN PRODUCTS MARKET FOR PLASMA FRACTIONATION, BY END USER, 2020–2027 (USD MILLION)
- TABLE 60 AUSTRALIA: COLD CHAIN PRODUCTS MARKET FOR PLASMA FRACTIONATION, BY TYPE, 2020–2027 (USD MILLION)
- TABLE 61 AUSTRALIA: COLD CHAIN PRODUCTS MARKET FOR PLASMA FRACTIONATION, BY END USER, 2020–2027 (USD MILLION)
- TABLE 62 REST OF ASIA PACIFIC: COLD CHAIN PRODUCTS MARKET FOR PLASMA FRACTIONATION, BY TYPE, 2020–2027 (USD MILLION)
- TABLE 63 REST OF ASIA PACIFIC: COLD CHAIN PRODUCTS MARKET FOR PLASMA FRACTIONATION, BY END USER, 2020–2027 (USD MILLION)
- TABLE 64 LATIN AMERICA: COLD CHAIN PRODUCTS MARKET FOR PLASMA FRACTIONATION, BY TYPE, 2020–2027 (USD MILLION)
- TABLE 65 LATIN AMERICA: COLD CHAIN PRODUCTS MARKET FOR PLASMA FRACTIONATION, BY END USER, 2020–2027 (USD MILLION)
- TABLE 66 MIDDLE EAST & AFRICA: COLD CHAIN PRODUCTS MARKET FOR PLASMA FRACTIONATION, BY TYPE, 2020–2027 (USD MILLION)
- TABLE 67 MIDDLE EAST & AFRICA: COLD CHAIN PRODUCTS MARKET FOR PLASMA FRACTIONATION, BY END USER, 2020–2027 (USD MILLION)
- TABLE 68 OVERVIEW OF STRATEGIES ADOPTED BY MAJOR PLAYERS IN COLD CHAIN PRODUCTS MARKET FOR PLASMA FRACTIONATION
- TABLE 69 COLD CHAIN PRODUCTS MARKET FOR PLASMA FRACTIONATION: DEGREE OF COMPETITION
- TABLE 70 OVERALL COMPANY FOOTPRINT
- TABLE 71 COMPANY FOOTPRINT ANALYSIS, BY TYPE
- TABLE 72 COMPANY FOOTPRINT ANALYSIS, BY END USER
- TABLE 73 COMPANY FOOTPRINT ANALYSIS, BY REGION
- TABLE 74 PRODUCT LAUNCHES & APPROVALS, JANUARY 2019–MARCH 2023
- TABLE 75 DEALS, JANUARY 2021–MARCH 2023
- TABLE 76 OTHER DEVELOPMENTS, JANUARY 2019– MARCH 2023
- TABLE 77 THERMO FISHER SCIENTIFIC: BUSINESS OVERVIEW
- TABLE 78 HAIER BIOMEDICAL: BUSINESS OVERVIEW
- TABLE 79 EPPENDORF AG: BUSINESS OVERVIEW
- TABLE 80 B. MEDICAL SYSTEM (AZENTA): BUSINESS OVERVIEW
- TABLE 81 BLUE STAR LIMITED: BUSINESS OVERVIEW
- TABLE 82 BLUE STAR LIMITED: PRODUCTS OFFERED
- TABLE 83 AVANTOR, INC.: BUSINESS OVERVIEW
- TABLE 84 GODREJ AND BOYCE MANUFACTURING CO. LTD.: BUSINESS OVERVIEW
- TABLE 85 BIOLIFE SOLUTIONS: BUSINESS OVERVIEW
- TABLE 86 HELMER SCIENTIFIC: BUSINESS OVERVIEW
- TABLE 87 VESTFROST SOLUTIONS A/S: BUSINESS OVERVIEW
- TABLE 88 JEIO TECH INC.: BUSINESS OVERVIEW
- TABLE 89 DEEPEE COOLING PRODUCTS: BUSINESS OVERVIEW
- TABLE 90 BERLINGER & CO. AG: BUSINESS OVERVIEW
- TABLE 91 MONNIT CORPORATION: BUSINESS OVERVIEW
- TABLE 92 ZHEJIANG HELI REFRIGERATION EQUIPMENT CO. LTD.: BUSINESS OVERVIEW
- FIGURE 1 COLD CHAIN PRODUCTS MARKET FOR PLASMA FRACTIONATION SEGMENTATION
- FIGURE 2 COLD CHAIN PRODUCTS MARKET FOR PLASMA FRACTIONATION, BY REGION
- FIGURE 3 RESEARCH DESIGN
- FIGURE 4 PRIMARY SOURCES
- FIGURE 5 BREAKDOWN OF PRIMARY INTERVIEWS: BY COMPANY TYPE, DESIGNATION, AND REGION
- FIGURE 6 MARKET SIZE ESTIMATION: REVENUE SHARE ANALYSIS
- FIGURE 7 REVENUE SHARE ANALYSIS ILLUSTRATION: THERMO FISHER SCIENTIFIC (US)
- FIGURE 8 SUPPLY-SIDE ANALYSIS: COLD CHAIN PRODUCTS MARKET FOR PLASMA FRACTIONATION (2021)
- FIGURE 9 COLD CHAIN PRODUCTS MARKET FOR PLASMA FRACTIONATION: BOTTOM-UP APPROACH
- FIGURE 10 DRIVERS, OPPORTUNITIES, AND CHALLENGES (2022–2027): IMPACT ON MARKET GROWTH AND CAGR
- FIGURE 11 CAGR PROJECTIONS
- FIGURE 12 TOP-DOWN APPROACH
- FIGURE 13 MARKET DATA TRIANGULATION METHODOLOGY
- FIGURE 14 COLD CHAIN PRODUCTS MARKET FOR PLASMA FRACTIONATION, BY TYPE, 2022 VS. 2027 (USD MILLION)
- FIGURE 15 COLD CHAIN PRODUCTS MARKET FOR PLASMA FRACTIONATION, BY END USER, 2022 VS. 2027 (USD MILLION)
- FIGURE 16 COLD CHAIN PRODUCTS MARKET FOR PLASMA FRACTIONATION: GEOGRAPHIC SNAPSHOT
- FIGURE 17 RISING USE OF IMMUNOGLOBULINS AND OTHER PLASMA PRODUCTS TO DRIVE MARKET GROWTH
- FIGURE 18 ULTRA-LOW-TEMPERATURE FREEZERS TO HOLD LARGEST MARKET SHARE
- FIGURE 19 CHINA TO REGISTER HIGHEST GROWTH OVER FORECAST PERIOD
- FIGURE 20 NORTH AMERICA TO DOMINATE MARKET OVER FORECAST PERIOD
- FIGURE 21 DEVELOPING COUNTRIES TO PRESENT GROWTH OPPORTUNITIES TO MARKET PLAYERS DURING THE FORECAST PERIOD
- FIGURE 22 COLD CHAIN PRODUCTS MARKET FOR PLASMA FRACTIONATION: DRIVERS, RESTRAINTS, OPPORTUNITIES, AND CHALLENGES
- FIGURE 23 WORLDWIDE POLYVALENT IMMUNE GLOBULIN SALES FROM 2010 TO 2026
- FIGURE 24 PLASMA FRACTIONATION PLANTS WORLDWIDE (2018)
- FIGURE 25 SUPPLY CHAIN ANALYSIS: COLD CHAIN PRODUCTS MARKET FOR PLASMA FRACTIONATION
- FIGURE 26 ECOSYSTEM ANALYSIS: COLD CHAIN PRODUCTS MARKET FOR PLASMA FRACTIONATION
- FIGURE 27 PATENT PUBLICATION TRENDS (JANUARY 2013–MARCH 2023)
- FIGURE 28 TOP APPLICANTS (COMPANIES/INSTITUTES) FOR COLD CHAIN PRODUCTS FOR PLASMA FRACTIONATION PATENTS (2013–2023)
- FIGURE 29 VALUE CHAIN ANALYSIS: COLD CHAIN PRODUCTS MARKET FOR PLASMA FRACTIONATION
- FIGURE 30 INFLUENCE OF STAKEHOLDERS ON BUYING PROCESS OF COLD CHAIN PRODUCTS FOR PLASMA FRACTIONATION
- FIGURE 31 COLD CHAIN PRODUCTS MARKET FOR PLASMA FRACTIONATION: GEOGRAPHIC GROWTH OPPORTUNITIES
- FIGURE 32 NORTH AMERICA: LABORATORY FREEZERS MARKET SNAPSHOT
- FIGURE 33 APAC: COLD CHAIN PRODUCTS MARKET FOR PLASMA FRACTIONATION SNAPSHOT
- FIGURE 34 REVENUE ANALYSIS FOR KEY PLAYERS IN COLD CHAIN PRODUCTS MARKET FOR PLASMA FRACTIONATION MARKET
- FIGURE 35 COLD CHAIN PRODUCTS FOR PLASMA FRACTIONATION: MARKET SHARE ANALYSIS, BY KEY PLAYER, 2021
- FIGURE 36 R&D ASSESSMENT OF KEY PLAYERS
- FIGURE 37 COLD CHAIN PRODUCTS MARKET FOR PLASMA FRACTIONATION: COMPANY EVALUATION MATRIX, 2021
- FIGURE 38 THERMO FISHER SCIENTIFIC, INC.: COMPANY SNAPSHOT
- FIGURE 39 HAIER BIOMEDICAL (HAIER GROUP): COMPANY SNAPSHOT (2021)
- FIGURE 40 EPPENDORF AG: COMPANY SNAPSHOT
- FIGURE 41 B MEDICAL SYSTEMS (AZENTA): COMPANY SNAPSHOT (2021)
- FIGURE 42 BLUE STAR LIMITED: COMPANY SNAPSHOT
- FIGURE 43 AVANTOR, INC.: COMPANY SNAPSHOT
- FIGURE 44 GODREJ AND BOYCE MANUFACTURING CO. LTD.: COMPANY SNAPSHOT
- FIGURE 45 BIOLIFE SOLUTIONS: COMPANY SNAPSHOT
The market size for Cold Chain Products for Plasma Fractionation was estimated using four main methods in this study. The market, as well as its peer and parent markets, were the subject of extensive research. The subsequent phase involved doing primary research to confirm these conclusions, presumptions, and estimates with industry professionals across the value chain. For estimating the value market, top-down and bottom-up strategies were both used. The market size of segments and subsegments was then estimated using market breakdown and data triangulation processes.
Secondary Research
There were several secondary sources used in this study, including directories, databases like Bloomberg Business, Factiva, and Dun & Bradstreet, white papers, annual reports, corporate house documents, investor presentations, and firm SEC filings. To find and gather data for the detailed, technical, market-focused, and commercial analysis of the Cold Chain Products Market for Plasma Fractionation, secondary research was carried out. Relevant information on major companies, market classification and segmentation according to industry trends down to the most basic level, and significant changes regarding market and technological views were also obtained. Additionally, utilizing secondary research, a database of the important industry executives was created.
Primary Research
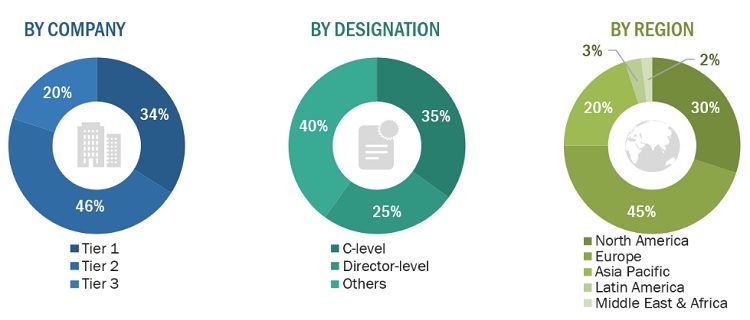
To gather qualitative and quantitative data for this study, a variety of sources from the supply and demand sides were interviewed during the main research phase. CEOs, vice presidents, marketing and sales directors, business development managers, technology, and innovation directors of Cold Chain Products for Plasma Fractionation manufacturing businesses, key opinion leaders, suppliers, and distributors are the main sources on the supply side. Blood collection centers and blood component providers, Hospitals and transfusion centers, Clinical research laboratories, and Others are some of the main demand-side suppliers.
The breakup of primary research:
Supply Side
To know about the assumptions considered for the study, download the pdf brochure
Market Size Estimation
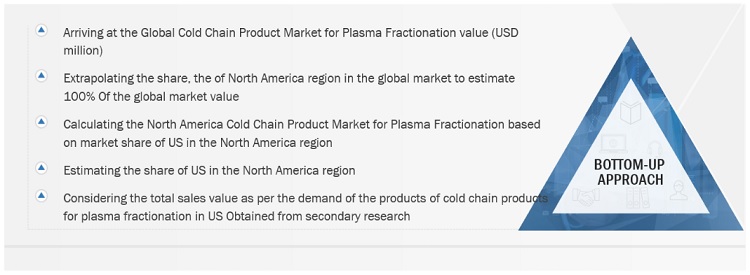
The market size for Cold Chain Products for Plasma Fractionation was calculated using data from four different sources, as will be discussed below. Each technique concluded and a weighted average of the four ways was calculated based on the number of assumptions each approach made. The market size for Cold Chain Products for Plasma Fractionation was calculated using data from four distinct sources, as will be discussed below:
Cold Chain Products for Plasma Fractionation: Country-level Analysis- Bottoms up approach
To know about the assumptions considered for the study, Request for Free Sample Report
Cold Chain Products for Plasma Fractionation: Top-Down approach

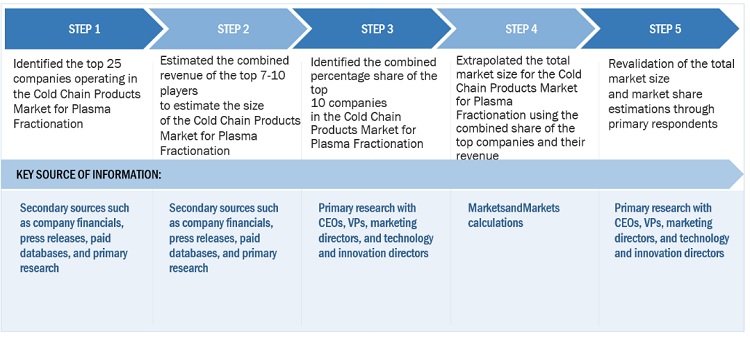
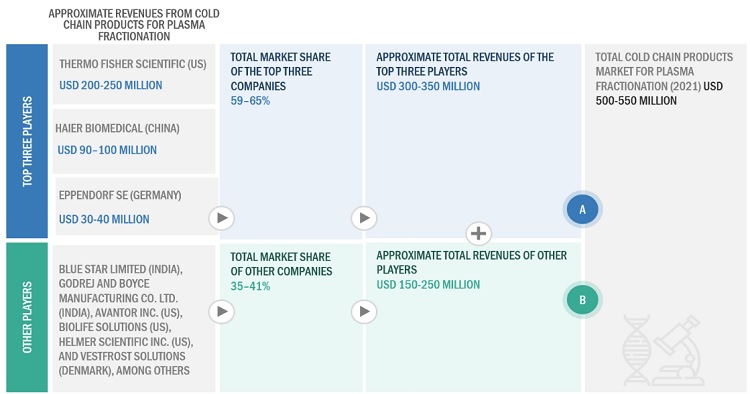
Cold Chain Products for Plasma Fractionation: Revenue Share Analysis
Cold Chain Products for Plasma Fractionation: Country level Analysis
Data Triangulation
The entire market was split up into several segments when the market size was determined. Data triangulation and market breakdown processes were used where necessary to complete the entire market engineering process and arrive at the precise statistics for all segments.
Approach to derive the market size and estimate market growth
Using secondary data from both paid and unpaid sources, the market rankings for the major players were determined following a thorough analysis of their sales of cold chain products. Due to data restrictions, the revenue share in certain cases was determined after a thorough analysis of the product portfolio of big corporations and their individual sales performance. This information was verified at each stage by in-depth interviews with professionals in the field.
Market definition
Blood products include whole blood and blood components namely cellular components, plasma, cryoprecipitate, and Plasma-derived medicinal products (PDMPs), which are purified plasma protein concentrates that undergo pathogen reduction procedures that are manufactured from pools of thousands of plasma units by an industrial process called plasma fractionation. The equipment that is needed for storage and transport of these plasma fractionated compounds in temperature-controlled environments is usually called cold chain products or equipment.
Key Stakeholders
- Cold chain equipment Manufacturers
- Cold chain equipment Distributors
- Medical device R&D Companies
- Clinics and Hospitals
- Plasma Research Institutes and Universities
- Venture Capitalists and Investors
- Market Research and Consulting Firms
- Government Associations
Objectives of the Study
- To define, describe, segment, and forecast the Cold Chain Products Market for Plasma Fractionation based on type, end user, and region.
- To provide detailed information regarding the major factors influencing the market growth (such as drivers, restraints, opportunities, and challenges).
- To assess the market regarding Porter’s five forces analysis, regulatory landscape, value chain, supply chain, ecosystem analysis, patent analysis, and the impact of the economic recession.
- To analyze micromarkets with respect to individual growth trends, prospects, and contributions to the overall market.
- To forecast the size of the market in North America, Europe, Asia Pacific, Latin America, and the Middle East and Africa.
- To analyze opportunities in the market for stakeholders and provide details of the competitive landscape.
- To profile the key players in the market and comprehensively analyze their core competencies.
- To track and analyze competitive developments such as product launches and approvals, acquisitions, expansions, partnerships, and agreements in the market.


 Generating Response ...


Growth opportunities and latent adjacency in Cold Chain Products Market