Container Handling Equipment Market by Type (ASC, STS, MHC, RTG, RMG, EMPTY and Laden FLT, Straddle Carrier, Reach Stacker, Terminal Tractor), Tonnage (<10 T, 10�40 T, 41�70 T, 71�100 T), Propulsion, Engine Capacity, Power Output - Global Forecast to 2025


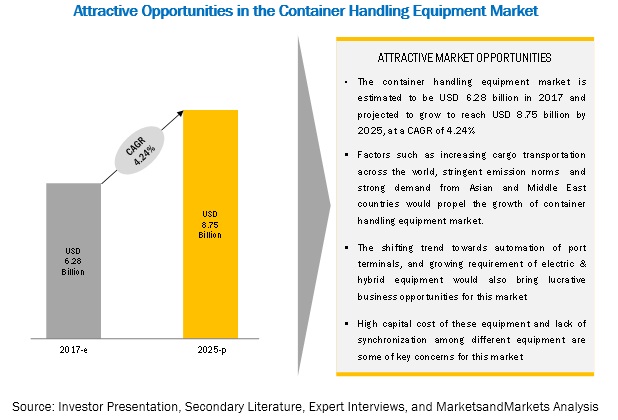
[145 Pages Report] The global container handling equipment market size was valued at USD 5.92 billion in 2016 and is expected to reach USD 8.75 billion by 2025, at a CAGR of 4.24% during the forecast period 2017-2025. As per the United Nations Conference on Trade And Development (UNCTAD), the global seaborne trade volume touched 10 billion tons in 2015, which included exports and imports of dry cargo, including bulk commodities and containerized trade. The constantly increasing containerized trade, coupled with the rising trend of port automation to cope up with the increased demand, has led to automated equipment for container handling being offered, which, in turn, is driving the demand for container handling equipment globally. Additionally, to meet the stringent emission norms, equipment with higher fuel efficiency, and lower or zero emissions is in demand, which would drive the electric and hybrid market during the forecast period.
By application, the container handling equipment market for the electric container handling segment is estimated to grow at the highest rate during the forecast period
The electric container handling equipment is estimated to grow at the fastest rate during the forecast period. The equipment such as RMG, ASC, and ship to shore cranes are offered in a fully electric variant for container handling application. RTG and straddle carriers are also available in an electric version along with diesel and hybrid variants. Stringent emission norms fuel the growth of this market. The emission regulations for industrial equipment have seen constant upgrading at the regional level. According to European Union, the NOx and PM levels have been reduced by nearly 95.7% and 97.2%, respectively from Stage I to Stage V. Similarly, as per the US EPA norms, NOx, PM, and Co2 levels have seen a decline of around 95.6% and 96.2%, respectively from Tier 1 to Tier 4. Countries such as China, Japan, South Korea, and India are also expected to follow similar norms that are at par with the EU and North American standards. Considering the high demand, equipment manufacturers such as Konecranes, Kalmar, and Hyster have increased their product offering for electric equipment that ranges from RMG and RTG to straddle carriers. Also, manufacturers have undertaken R&D activities for developing reach stackers and terminal tractors with an electric engine. For instance, in 2017, Hyster initiated the development of an electric laden container handling truck, which is powered by the lithium-ion battery, at its facility located in Weeze, Germany. Also, according to primary insights, the manufacturers will soon come up with electric terminal tractors. Hence, owing to stringent emission regulations and desired operational efficiency, the demand for electric container handling equipment is expected to grow at a high rate in the coming years.
By tonnage capacity, the 41-70 tons segment is estimated to hold the largest market share during the forecast period
The 41-70 tons segment is estimated to hold the largest market share during the forecast period. The majority of straddle carriers, reach stackers, and mobile harbor cranes catered to this range of tonnage capacity. Large ports such as Shanghai Port (China), Shenzhen Port (China), Hong Kong, S.A.R. (China), Busan Port (South Korea), Ningbo-Zhoushan Port (China), and Qingdao Port (China) handle more than 15 million TEU every year. These port terminals require larger equipment types that can stack the laden containers. The growing container traffic of these port terminals will further boost the container handling equipment market with a stacking capacity of 41-70 tons.
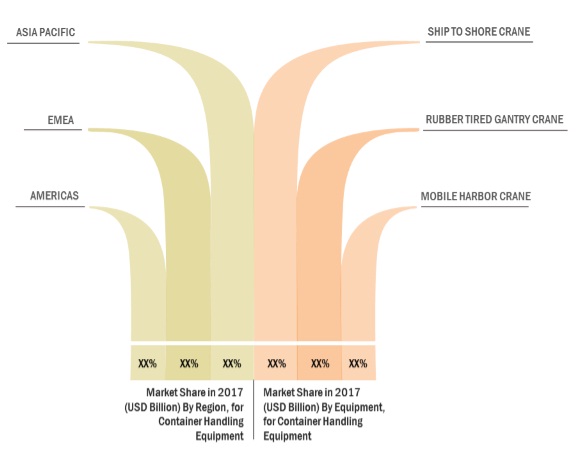
APAC to lead the container handling equipment market during the forecast period.
The Asia Pacific region is estimated to lead the market during the forecast period. Countries such as China, Japan, Singapore, South Korea, and India are the key markets of container handling equipment. As per the data of the World Shipping Council, 7 of the top ten container port terminals, in terms of volume, in 2015 belonged to China with a capacity of around 130.2 million TEUs annually. Furthermore, the Shanghai Port (China), Port of Singapore, Shenzhen Port (China), Hong Kong, S.A.R. (China), and Busan Port (South Korea) are some of the largest port terminals that handle more than 19 million TEU annually. Additionally, the small and medium ports of countries such as India, Thailand, and Malaysia bring immense business potential for this market. Other factors such as high infrastructural spending by regional authorities to improve port terminals, rising per capita income, and increased import & export activity for comfort & leisure commodities would drive the market in this region.
Market Dynamics
Driver: Rising demand for container handling equipment in Asia Pacific & the Middle East
Millions of goods containers from different industries, such as automotive, chemicals and materials, petrochemicals, and consumer goods, are transported every year in the Asia Pacific and the Middle East. In recent years, the maximum transportation of containers has been noticed from South Korea, China, Singapore, India, and the UAE. According to the World Shipping Council, of the top 50 container port terminals in terms of handling million TEU in 2015, around 30 were in Asia and the Middle East. These included China, Japan, Malaysia, Indonesia, Singapore, the Philippines, and Thailand.
Restraint: High capital costs of container handling equipment
Innovations and advances have played a major role in giving a new face to the cargo handling industry. New container handling equipment includes modern technologies, such as touchscreen displays, cameras, AI technology, and multiple sensors, to improve productivity and processes. However, these technologies have also increased the complexity of these machines. Additionally, continuous R&D efforts have resulted in products that are highly advanced and capable of handling multiple tasks. These machinery include complex mechatronic systems that require specialized manufacturing and assembly processes. All the steps involved in the designing, production and distribution of this equipment require huge investments, which is reflected in the cost of the machinery made available to the customers. The table below provides the costs at which different equipment is sold to the customer. Moreover, the rising focus on cabin comfort and the constantly changing emission norms require equipment manufacturers to upgrade their products, which further increases cost regularly. Thus, the higher cost of container handling equipment might adversely affect the growth of this market.
Opportunity: Growing automation level in container handling equipment
Container handling equipment is high-powered equipment ranging from 140 to 550 kW. This equipment is used in harsh working conditions and has an ideal economic life of around 10,000 to 20,000 hours or 5 years; it also requires constant monitoring to achieve the desired productivity. In the monitoring of equipment performance, there has been a tremendous change with the adoption of different technologies. By increasing the level of automation in this equipment, issues related to safety and security have been resolved, providing additional benefits such as real-time information of engine performance, fuel economy, tire pressure, HVAC, and maintenance and services. This helps attain optimum performance and is also helpful in fleet management.
Challenge: Lack of synchronization between different port equipment
The automation of container handling equipment is a key trend at the global level that requires the installation of various systems and technologies to handle the increased container flow at port terminals. For instance, the control system of automated stacking cranes has been integrated with the control systems of other equipment such as ship-to-shore cranes, straddle carriers, and mobile harbor cranes. However, these control systems communicate through different interfaces and protocols. The lack of integration of the communication interfaces and protocols in the different equipment complicates the process and affects the overall performance while reducing productivity at port terminals. Software and system developers are facing issues while accessing real-time data related to equipment location to assign job orders. The absence of critical information due to lack of standardization and interoperability metrics between the equipment installed by different manufacturers may delay the information flow, resulting in delayed decision-making. However, a few major manufacturers are working to develop a system that works on the same platform to achieve high efficiency and enable a faster and reliable exchange of key information. Hence, the synchronization of several technologies, communication interfaces, protocols, and platforms for better data transmission is a key concern that will have to be overcome during the forecast period.
Scope of the Report
|
Report Metric |
Details |
|
Market size available for years |
2015–2025 |
|
Base year considered |
2016 |
|
Forecast period |
2017–2025 |
|
Forecast units |
Million (USD) |
|
Segments covered |
Propulsion Type, Power Output, Tonnage Capacity, Engine Capacity, Equipment Type and Region |
|
Geographies covered |
Asia Pacific, EMEA, and Americas |
|
Companies covered |
Kalmar (Finland), Konecranes (Finland), Liebherr (Switzerland), Hyster (US), and Sany (China) |
The research report categorizes the Container Handling Equipment Market to forecast the revenues and analyze the trends in each of the following sub-segments:
Market, By Propulsion Type
- Diesel
- Electric
- Hybrid
Market, By Power Output
- <150 kW
- 150-200 kW
- 201-300 kW
- >300 kW
Market, By Tonnage Capacity
- <10 Tons
- 10-40 Tons
- 41-70 Tons
- 71-100 Tons
Market, By Equipment Type
- Automatic stacking cranes
- Empty container handling FLT
- Ship to shore cranes
- Mobile harbor cranes
- Laden Forklift trucks
- RMG
- RTG
- Straddle carriers
- Reach stackers
- Terminal tractors
Market, By Region
- North America
- Europe
- Asia Pacific (APAC)
- RoW
Key Market Players
Kalmar (Finland), Konecranes (Finland), Liebherr (Switzerland), Hyster (US), and Sany (China). Kalmar, a fully owned subsidiary of Cargotec (Finland), was founded in 1973 and is headquartered in Helsinki, Finland. The company provides cargo handling equipment and services for seaports, terminals, distribution centers, and heavy industries. The company manufactures and sells equipment such as straddle and shuttle carriers, terminal tractors, rail-mounted gantry (RMG) cranes, rubber tire gantry (RTG) cranes, yard cranes, ship-to-shore cranes, reach stackers, empty container handlers, and forklift trucks. The company’s container handling equipment is used for intermodal and industrial handling. The company had a total workforce of around 5,702 employees as of 2016 with operations in Finland, the US, Malaysia, Sweden, China, Poland, Spain, India, and the Netherlands. Kalmar has a strong presence in Europe, the Middle East and Africa (EMEA), Asia Pacific, and the Americas. The company also has research and development centers across the globe along with a Technology and Competence Center in Tampere, Finland.
Recent Developments
- In January 2018, Kalmar entered into a contract with PSA Corporation Limited (Singapore) for the maintenance and repair of mobile equipment. The contract is for 3 years, and Kalmar will provide maintenance support to 700 prime movers and trailer sets installed at Pasir Panjang Terminal.
- In November 2017, Anhui Heli partnered with Techlift International (Canada) for a dealership in the Canadian market. Techlift International was renamed Heli Canada and is responsible for selling the complete range of Heli products, including container handling equipment, in the country.
- In May 2016, Hangcha Group opened a new subsidiary called Hangcha Southeast Asia Co., Ltd. in Bangkok, Thailand. This new company is the second overseas subsidiary established by Hangcha and would strengthen the company’s presence in Asia Pacific.
- In August 2015, Hoist Liftrucks expanded its manufacturing facility in East Chicago, Indiana (US). The manufacturing plant is spread across nearly 550,000 square feet and will create 500 new job opportunities by 2022. For this expansion, the company received funding of approximately USD 8.25 million in conditional tax credits from the Indiana Economic Development Corporation.
Critical questions the report answers:
- Where will all these developments take the industry in the long term?
- What are the upcoming trends for the Container Handling Equipment market?
- Which segment provides the most opportunity for growth?
- Who are the leading vendors operating in this market?
- What are the opportunities for new market entrants?
To speak to our analyst for a discussion on the above findings, click Speak to Analyst
 Exclusive indicates content/data unique to MarketsandMarkets and not available with any competitors.
Table of Contents
1 Introduction (Page No. - 14)
1.1 Objectives of the Study
1.2 Container Handling Equipment Market Definition
1.3 Market Scope
1.3.1 Markets Covered
1.3.2 Years Considered for the Study
1.4 Currency
1.5 Package Size
1.6 Limitations
1.7 Stakeholders
2 Research Methodology (Page No. - 18)
2.1 Research Data
2.2 Secondary Data
2.3 Primary Data
2.3.1 Sampling Techniques & Data Collection Methods
2.3.2 Primary Participants
2.4 Factor Analysis
2.4.1 Demand-Side Analysis
2.4.2 Supply-Side Analysis
2.5 Container Handling Equipment Market Estimation
2.5.1 Bottom-Up Approach
2.5.2 Top-Down Approach
2.6 Market Breakdown & Data Triangulation
2.7 Assumptions
3 Executive Summary (Page No. - 29)
4 Premium Insights (Page No. - 36)
4.1 Container Handling Equipment Market
4.2 Market, By Region
4.3 Market, By Equipment Type
4.4 Market, By Tonnage Capacity
4.5 Market, By Propulsion Type
4.6 Market, By Engine Capacity
4.7 Market, By Power Output
5 Container Handling Equipment Market Overview (Page No. - 42)
5.1 Introduction
5.2 Market Dynamics
5.2.1 Drivers
5.2.1.1 Increase in Cargo Transportation Around the World
5.2.1.2 Rising Demand for Container Handling Equipment in Asia Pacific & the Middle East
5.2.2 Restraints
5.2.2.1 High Capital Costs of Container Handling Equipment
5.2.3 Opportunities
5.2.3.1 Impact of Increasing Stringency in Emission Regulations
5.2.3.1.1 Increasing Opportunities for Engine & After-Treatment Device Suppliers
5.2.3.1.2 Growing Innovations in Hybrid & Electric Container Handling Equipment
5.2.3.2 Growing Automation Level in Container Handling Equipment
5.2.4 Challenges
5.2.4.1 Lack of Synchronization Between Different Port Equipment
5.3 Macro-Indicator Analysis
5.3.1 Introduction
5.3.1.1 Goods and Services Export as A Percentage of GDP
5.3.1.2 GDP (USD Billion)
5.3.1.3 GNI Per Capita, Atlas Method (USD)
5.3.1.4 GDP Per Capita PPP (USD)
5.3.2 Macro Indicators Influencing the Container Handling Equipment Market for Top 3 Countries
5.3.2.1 China
5.3.2.2 US
5.3.2.3 Germany
6 Container Handling Equipment Market, By Equipment Type (Page No. - 53)
Note - The Chapter is Further Segmented at Regional Level and Considered Regions are Asia Pacific, EMEA, and Americas
6.1 Introduction
6.2 Automated Stacking Crane (ASC)
6.3 Empty Container Handling Forklift Truck (FLT)
6.4 Laden Forklift Truck (FLT)
6.5 Mobile Harbor Crane (MHC)
6.6 Rail Mounted Gantry (RMG) Crane
6.7 Reach Stacker
6.8 Rubber Tired Gantry (RTG) Crane
6.9 Ship to Shore (STS) Crane
6.10 Straddle Carrier
6.11 Terminal Tractor
7 Container Handling Equipment Market, By Tonnage Capacity (Page No. - 66)
Note - The Chapter is Further Segmented at Regional Level and Considered Regions are Asia Pacific, EMEA, and Americas
7.1 Introduction
7.2 <10 Tons
7.3 10-4o Tons
7.4 41-70 Tons
7.5 71-100 Tons
8 Container Handling Equipment Market, By Propulsion Type (Page No. - 71)
Note - The Chapter is Further Segmented at Regional Level and Considered Regions are Asia Pacific, EMEA, and Americas
8.1 Introduction
8.2 Diesel
8.3 Electric
8.4 Hybrid
9 Container Handling Equipment Market, By Engine Capacity (Page No. - 77)
Note - The Chapter is Further Segmented at Regional Level and Considered Regions are Asia Pacific, EMEA, and Americas
9.1 Introduction
9.2 <7 Liter
9.3 7-10 Liter
9.4 >10 Liter
10 Container Handling Equipment Market, By Power Output (Page No. - 82)
Note - The Chapter is Further Segmented at Regional Level and Considered Regions are Asia Pacific, EMEA, and Americas
10.1 Introduction
10.2 <150 kW
10.3 150-200 kW
10.4 201–300 kW
10.5 >300 kW
11 Container Handling Equipment Market, By Region (Page No. - 87)
Note - The Chapter is Further Segmented By Tonnage Capacity (<10 Tons, 10-4o Tons, 41-70 Tons, and 71-100 Tons) at Country Level
11.1 Introduction
11.2 Asia Pacific
11.2.1 Australia
11.2.2 China
11.2.3 India
11.2.4 Japan
11.2.5 South Korea
11.2.6 Singapore
11.3 EMEA
11.3.1 Germany
11.3.2 Spain
11.3.3 UK
11.3.4 UAE
11.3.5 Saudi Arabia
11.3.6 Turkey
11.4 Americas
11.4.1 Brazil
11.4.2 Canada
11.4.3 Columbia
11.4.4 Mexico
11.4.5 US
12 Competitive Landscape (Page No. - 104)
12.1 Overview
12.2 Container Handling Equipment Market: Market Share Analysis
12.3 Competitive Scenario
12.3.1 Contracts & Agreements
12.3.2 New Product Developments
12.3.3 Expansions
12.3.4 Mergers & Acquisitions
13 Company Profiles (Page No. - 110)
(Overview, Products Offered, Recent Developments, SWOT Analysis, MnM View)*
13.1 Kalmar
13.2 Konecranes
13.3 Liebherr
13.4 Hyster
13.5 Sany
13.6 ZPMC
13.7 Lonking Machinery
13.8 Anhui Heli
13.9 CVS Ferrari
13.10 Hoist Liftruck
*Details on Overview, Products Offered, Recent Developments, SWOT Analysis, MnM View Might Not Be Captured in Case of Unlisted Companies.
14 Appendix (Page No. - 136)
14.1 Insights of Industry Experts
14.2 Discussion Guide
14.4 Available Customizations
14.4.1 Automated Stacking Crane Market, By Tonnage Capacity
14.4.1.1 10-40 Tons
14.4.1.2 41-70 Tons
14.4.2 Rail Mounted Gantry Crane Market, By Tonnage Capacity
14.4.2.1 10-40 Tons
14.4.2.2 41-70 Tons
14.4.3 Reach Stacker Market, By Tonnage Capacity
14.4.3.1 10-40 Tons
14.4.3.2 41-70 Tons
14.4.4 Rubber Tired Gantry Crane Market, By Tonnage Capacity
14.4.4.1 10-40 Tons
14.4.4.2 41-70 Tons
14.4.5 Ship to Shore Crane Market, By Tonnage Capacity
14.4.5.1 10-40 Tons
14.4.5.2 41-70 Tons
14.4.5.3 71-100 Tons
14.4.6 Container Handling Equipment After Treatment Technologies Market, By Region
Note: The Segment Covers the Container Handling Equipment Market By Above Mentioned After Treatment Technologies for Equipment Type: Rubber Tired Gantry Crane, Laden Forklift Trucks, Reach Stackers and Terminal Tractors at Regional Level – Asia Pacific, EMEA, and Americas
14.4.6.1 Diesel Particulate Filter
14.4.6.2 Selective Catalytic Reduction
14.4.6.3 Turbocharger
14.4.7 Laden Forklift Truck Market, By Engine Capacity
14.4.7.1 7-10 Liter
14.4.7.2 >10 Liter
14.4.8 Reach Stacker Market, By Engine Capacity
14.4.8.1 7-10 Liter
14.4.8.2 >10 Liter
14.4.9 Rubber Tired Gantry Crane Market, By Tonnage Capacity
14.4.9.1 7-10 Liter
14.4.9.2 >10 Liter
14.4.10 Detailed Analysis and Profiling of Additional Market Players (Upto 3)
14.5 Related Reports
14.6 Author Details
List of Tables (70 Tables)
Table 1 Currency Exchange Rates (W.R.T. USD)
Table 2 Mix of Adopted Strategies By Key Players in the Industry, 2016–2018
Table 3 Average Cost of Different Equipment Types
Table 4 Emission Norms Comparative Analysis for Non-Road Vehicles: US Epa vs Eu Emission Standards
Table 5 Container Handling Equipment Market, By Equipment Type, 2015–2025 (Units)
Table 6 Market, By Equipment Type, 2015–2025 (USD Million)
Table 7 Automated Stacking Crane (ASC): Market, By Region, 2015–2025 (Units)
Table 8 Automated Stacking Crane (ASC): Market, By Region, 2015–2025 (USD Million)
Table 9 Empty Container Handling Forklift Truck (FLT): Market, By Region, 2015–2025 (Units)
Table 10 Empty Container Handling Forklift Truck (FLT): Market, By Region, 2015–2025 (USD Million)
Table 11 Laden Forklift Truck (FLT): Market, By Region, 2015–2025 (Units)
Table 12 Laden Forklift Truck (FLT): Market, By Region, 2015–2025 (USD Million)
Table 13 Mobile Harbor Crane (MHC): Market, By Region, 2015–2025 (Units)
Table 14 Mobile Harbor Crane (MHC): Market, By Region, 2015–2025 (USD Million)
Table 15 Rail Mounted Gantry Crane (RMG): Market, By Region, 2015–2025 (Units)
Table 16 Rail Mounted Gantry Crane (RMG): Market, By Region, 2015–2025 (USD Million)
Table 17 Reach Stacker: Market, By Region, 2015–2025 (Units)
Table 18 Reach Stacker: Market, By Region, 2015–2025 (USD Million)
Table 19 Rubber Tired Gantry Crane (RTG): Market, By Region, 2015–2025 (Units)
Table 20 Rubber Tired Gantry Crane (RTG): Market, By Region, 2015–2025 (USD Million)
Table 21 Ship to Shore Crane (STS): Market, By Region, 2015–2025 (Units)
Table 22 Ship to Shore Crane (STS): Market, By Region, 2015–2025 (USD Million)
Table 23 Straddle Carrier: Market, By Region, 2015–2025 (Units)
Table 24 Straddle Carrier: Market, By Region, 2015–2025 (USD Million)
Table 25 Terminal Tractor: Market, By Region, 2015–2025 (Units)
Table 26 Terminal Tractor: Market, By Region, 2015–2025 (USD Million)
Table 27 Container Handling Equipment Market, By Tonnage Capacity, 2015–2025 (Units)
Table 28 <10 Tons: Market, By Region, 2015–2025 (Units)
Table 29 10-40 Tons: Market, By Region, 2015–2025 (Units)
Table 30 41-70 Tons: Market, By Region, 2015–2025 (Units)
Table 31 71-100 Tons: Market, By Region, 2015–2025 (Units)
Table 32 Container Handling Equipment Manufacturer Key Offerings, By Propulsion Type
Table 33 arket, By Propulsion Type, 2015–2025 (Units)
Table 34 Diesel: Market, By Region, 2015–2025 (Units)
Table 35 Electric: Market, By Region, 2015–2025 (Units)
Table 36 Hybrid: Market, By Region, 2015–2025 (Units)
Table 37 Market, By Engine Capacity, 2015–2025 (Units)
Table 38 <7 Liter: Market, By Region, 2015–2025 (Units)
Table 39 7-10 Liter: Market, By Region, 2015–2025 (Units)
Table 40 >10 Liter: Market, By Region, 2015–2025 (Units)
Table 41 Market, By Power Output, 2015–2025 (Units)
Table 42 <150 kW: Market, By Region, 2015–2025 (Units)
Table 43 150-200 kW: Market, By Region, 2015–2025 (Units)
Table 44 201–300 kW: Market, By Region, 2015–2025 (Units)
Table 45 >300 kW: Market, By Region, 2015–2025 (Units)
Table 46 Market, By Region, 2015–2025 (Units)
Table 47 Asia Pacific: Market, By Country, 2015–2025 (Units)
Table 48 Australia: Market, By Tonnage Capacity, 2015–2025 (Units)
Table 49 China: Market, By Tonnage Capacity, 2015–2025 (Units)
Table 50 India: Market, By Tonnage Capacity, 2015–2025 (Units)
Table 51 Japan: Market, By Tonnage Capacity, 2015–2025 (Units)
Table 52 South Korea: Market, By Tonnage Capacity, 2015–2025 (Units)
Table 53 Singapore: Market, By Tonnage Capacity, 2015–2025 (Units)
Table 54 EMEA: Market, By Country, 2015–2025 (Units)
Table 55 Germany: Market, By Tonnage Capacity, 2015–2025 (Units)
Table 56 Spain: Market, By Tonnage Capacity, 2015–2025 (Units)
Table 57 UK: Market, By Tonnage Capacity, 2015–2025 (Units)
Table 58 UAE : Market, By Tonnage Capacity, 2015–2025 (Units)
Table 59 Saudi Arabia: Market, By Tonnage Capacity, 2015–2025 (Units)
Table 60 Turkey: Market, By Tonnage Capacity, 2015–2025 (Units)
Table 61 Americas: Market, By Country, 2015–2025 (Units)
Table 62 Brazil: Market, By Tonnage Capacity, 2015–2025 (Units)
Table 63 Canada: Market, By Tonnage Capacity, 2015–2025 (Units)
Table 64 Columbia: Market, By Tonnage Capacity, 2015–2025 (Units)
Table 65 Mexico: Market, By Tonnage Capacity, 2015–2025 (Units)
Table 66 US: Market, By Tonnage Capacity, 2015–2025 (Units)
Table 67 Contracts & Agreements, 2017–2018
Table 68 New Product Developments, 2016–2017
Table 69 Expansions, 2015–2017
Table 70 Mergers & Acquisitions, 2017
List of Figures (50 Figures)
Figure 1 Market Segmentation: Container Handling Equipment Market
Figure 2 Market: Research Design
Figure 3 Research Design Model
Figure 4 Breakdown of Primary Interviews: By Company Type, Designation, & Region
Figure 5 Export vs Import of Goods, 1995–2015
Figure 6 Market Size Estimation Methodology: Bottom-Up Approach
Figure 7 Market Size Estimation Methodology: Top-Down Approach
Figure 8 Data Triangulation
Figure 9 Market, By Country, 2017 vs 2025 (Units)
Figure 10 Market, By Equipment Type, 2017 vs 2025 (USD Billion)
Figure 11 Market, By Tonnage Capacity, 2017 vs 2025 (Units)
Figure 12 Market, By Propulsion Type, 2017 vs 2025 (Units)
Figure 13 Market, By Engine Capacity, 2017 vs 2025 (Units)
Figure 14 Market, By Power Output, 2017 vs 2025 (Units)
Figure 15 Attractive Growth Opportunities for Electric & Hybrid Container Handling Equipment
Figure 16 Asia Pacific is Estimated to Be the Leading Market, Whereas Ship to Shore Crane is Estimated to Be the Largest Equipment Type Market (By Value)
Figure 17 Automated Stacking Crane is Estimated to Be the Fastest Growing Market Among All Equipment, During Forecast Period (By Value)
Figure 18 41-70 Tons Segment is Estimated to Dominate the Market, During Forecast Period (By Volume)
Figure 19 Electric Propulsion Type Segment is Estimated to Grow at the Highest CAGR for Market, During Forecast Period (By Volume)
Figure 20 >10 Liter Segment is Estimated to Dominate the Market, During Forecast Period (By Volume)
Figure 21 201-300 kW Segment is Estimated to Hold the Largest Market Share of Container Handling Equipment, During Forecast Period (By Volume)
Figure 22 Container Handling Equipment: Market Dynamics
Figure 23 Global Seaborne Trade, 2015 (Million Tons Loaded)
Figure 24 Global Containerized Trade, 2011–2016 (Million Teu)
Figure 25 Top 10 Port Terminals Capacity (Million Teu)
Figure 26 China: Rising PCI and Reviving Financial Markets Expected to Drive the Domestic Demand During the Forecast Period
Figure 27 US: Rising GNI Per Capita and Demand of Luxirious Commodities Expected to Drive the Demand During the Forecast Period
Figure 28 Germany: Rising Trend Towards Port Automation Will Drive the Demand in Coming Years
Figure 29 Market, By Equipment Type, 2017 vs 2025 (USD Million)
Figure 30 Market Share, By Tonnage Capacity, 2017 vs 2025 (Units)
Figure 31 Market, By Propulsion Type, 2017 vs 2025 (Units)
Figure 32 Market, By Engine Capacity, 2017 vs 2025 (Units)
Figure 33 Market, By Power Output, 2017 vs 2025 (Units)
Figure 34 Market, By Region, 2017 vs 2025 (Units)
Figure 35 Asia Pacific: Market Snapshot
Figure 36 EMEA: Market Snapshot
Figure 37 Americas: Market, By Country, 2017 vs 2025 (Units)
Figure 38 Companies Adopted Contracts & Agreements as the Key Growth Strategy, 2015–2018
Figure 39 Container Handling Equipment: Market Share Analysis, 2016
Figure 40 Kalmar: Company Snapshot
Figure 41 Kalmar: SWOT Analysis
Figure 42 Konecranes: Company Snapshot
Figure 43 Konecranes: SWOT Analysis
Figure 44 Liebherr: Company Snapshot
Figure 45 Liebherr: SWOT Analysis
Figure 46 Hyster: Company Snapshot
Figure 47 Hyster: SWOT Analysis
Figure 48 Sany: SWOT Analysis
Figure 49 Lonking Machinery: Company Snapshot
Figure 50 Anhui Heli: Company Snapshot


Growth opportunities and latent adjacency in Container Handling Equipment Market