Continuous Renal Replacement Therapy Market by Product (Hemofilter, Bloodline, Machines, Dialysates), Modality (SCUF, CVVH, CVVHD, CVVHDF), Age (Adult, Pediatric), Enduser (Hospitals, Ambulatory), and Region - Global Forecast to 2028
Market Growth Outlook Summary
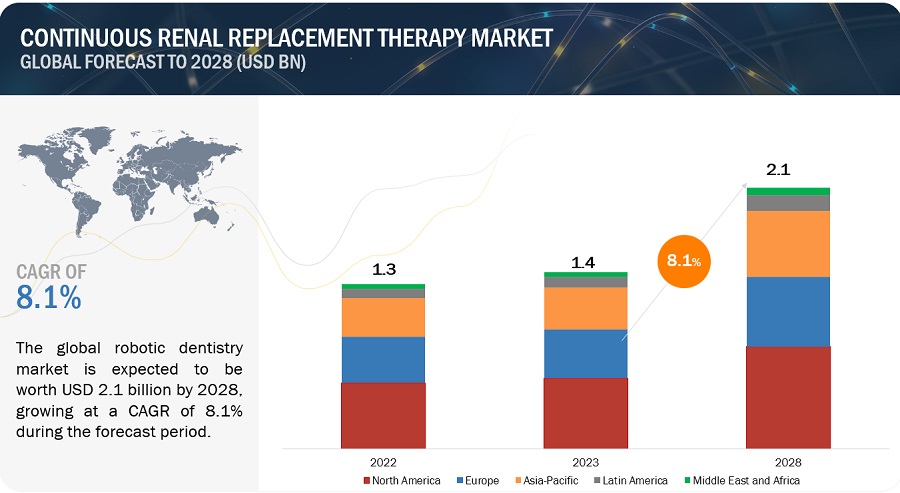
The global continuous renal replacement therapy market, valued at US$1.3 billion in 2022, stood at US$1.4 billion in 2023 and is projected to advance at a resilient CAGR of 8.1% from 2023 to 2028, culminating in a forecasted valuation of US$2.1 billion by the end of the period. Various factors such as rise in worldwide prevalence of AKI, Growing number of ICU patients with AKI and rising incidences of sepsis, and growing clinical advantage of CRRT over intermittent blood purification are factors likely to accelerate the growth of the market. Moreover, presence of well-established key players focusing on developing and commercializing technologically advanced and initiatives undertaken by government to increase the awareness about CRRT are likely to propel the market growth during the forecast period.
Attractive opportunities CRRT Market
To know about the assumptions considered for the study, Request for Free Sample Report
Continuous Renal Replacement Therapy Market Dynamics
Driver: Increase in the prevalence of incidence of acute kidney injury (AKI)
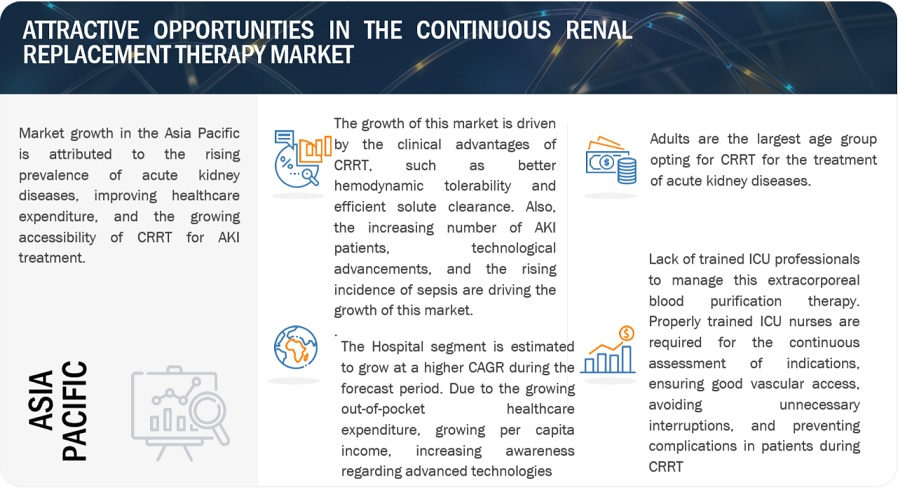
, The primary factor of the market growth is increasing incidences of Acute kidney injury which is, expected to boost the demand for CRRT. For instance , according to the International Society of Nephrology(INR), an estimation of 13.3 million cases of AKI were registered annually worldwide. This is anticipated to boost the adoption of continuous renal replacement therapy at a higherrate. With the increase in the geriatric population globally, the prevalence of kidney-related diseases is expected to grow significantly. This, in turn, is expected to attribute to the growth of the CRRT market at a significant rate during the forecast period.
Restraint: High procedural cost of CRRT
As the population in emerging nations is price-sensitive, they prefer lower-priced products. Although the cost of CRRT in developing countries is high which makes these procedures are still unaffordable for a large portion of the population due to the low purchasing power. This limits the demand and uptake of CRRT in developing as well as developed countries. Because of the high regulatory barriers, number of CRRT products that are approved in other countries have yet to be approved by the FDA. The share of the US in the global CRRT market is mainly due to its large population base of the acute kidney injury (AKI). Hence, the presence of stringent and time-consuming regulatory policies for the approval of new CRRT products in the region poses restraint to the growth of the global CRRT market.
Opportunity: Emerging markets in APAC and RoW
In the Asia Pacific region, China, India, Japan, and South Korea are a few of the major markets for CRRT. The demand for CRRT is being driven by a sharp rise in the number of AKI cases in these nations. Furthermore, the governments of these nations are spending a lot of money on healthcare infrastructure, which is accelerating the expansion of the CRRT market.. Additionally, regulatory policies in the Asia Pacific region are more adaptive and less-stringent. This, along with the increasing competition in the mature markets (Europe, Japan, and Australia), will further boost up the growth of CRRT market in Asia pacific region.
Challenge: Shortage of trained ICU professionals in developing nations
CRRT is a one of the specialized and critical therapy which involves complex nursing care. Precise training of ICU nurses are required for the continuous assessment of indications, ensuring good vascular access, , and prevention of complications in patients during CRRT. Although , currently, there is a lack of registered nurses in ICU settings. Moreover the complexity associated with CRRT are likely to hamper the market growth.
Ecosystem Analysis
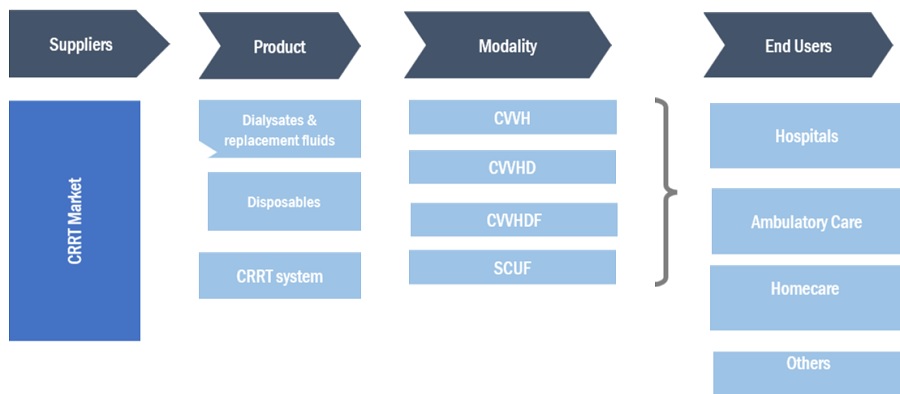
The ecosystem map of the overall leukapheresis market comprises the elements present in this market and defines these elements with a demonstration of the bodies involved. CRRT products include systems and disposables. These products vary based on:
- Different types, including dialysates and replacement fluids, disposables and CRRT systems.
Disposables, including Hemofilters, Blood line and tubes and other disposables
By product, dialysates & replacement fluid segment of the continuous renal replacement therapy industry is to capture largest market share during the forecast period.
The largest share of this segment of the continuous renal replacement therapy market is attributed to factors such growing demand for dialysates to remove undesired solutes and restoring the electrolytes and acid-base balance in the blood along with presence of well established players with strong offerings in dialysates & replacement fluid. The dialysates and replacement fluids helps in removing undesired solutes and restores the electrolytes and acid-base balance in the blood. The CRRT procedures utilizes the lactate-buffered solutions or sterilized bicarbonate-buffered solutions as replacement fluids. The consumption of these fluids varies with different CRRT modalities, Hence it is more accurate and convenient to use.
The continuous venovenous hemodiafiltration (CVVHDF) is witnessed to have highest growth rate of the continuous renal replacement therapy industry, by modality during the forecast period.
The high growth rate of the CVVHDF segment can be attributed to its flexibility as compared to other CRRT modalities. The CVVHDF modality also combines the benefits of convection and diffusion for the removal of solutes, which is another major factor supporting its growth. The CVVHDF approach is more effective for the removal of small to medium-sized molecules. This therapy is used in patients with fluid overload, congestive heart failure, and acute renal failure.
Adult segment accounted for the largest share of the continuous renal replacement therapy industry, by age group, in 2022
The increasing demand for invisible braces among adults due to large adult population base with AKI, increase in the hospitalization among adult population, and the large availability of CRRT system and disposables for adults undergoing CRRT procedure. The adult population is the fastest-growing age group in both developed and developing nations. It has resulted in the increasing frequency of aggressive surgical and medical interventions, increasing the risk of developing AKI and further contributing to the market growth.
To know about the assumptions considered for the study, download the pdf brochure
North America is projected to be the largest regional market for continuous renal replacement therapy industry
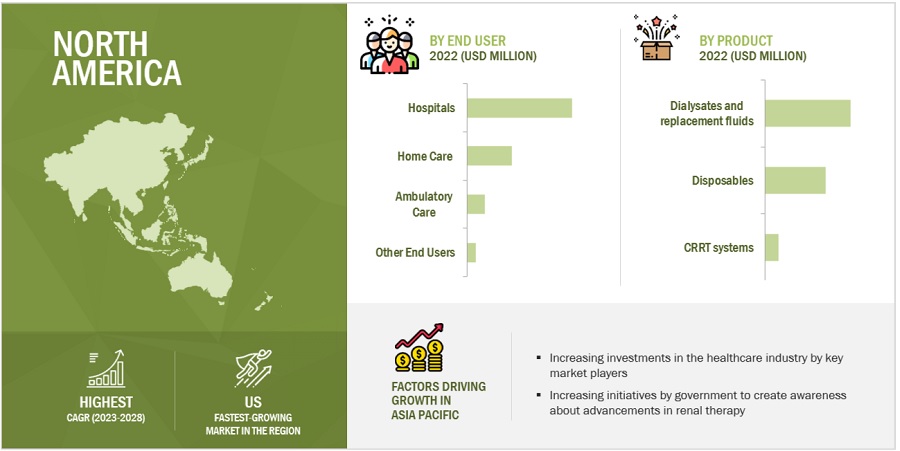
North America dominates continuous renal replacement therapy market. The north American region is gaining traction with the increasing incidence and prevalence of AKI. Moreover due to strong foothold of major key players in the region, rising approval of CRRT products for multiple application across many countries, and initiatives by government to increase the awareness about the advancements in renal therapy are likely to play a major role in fueling the growth of the CRRT market in North America.
The prominent players operating in the global continuous renal replacement therapy market include Baxter International Inc. (US), Fresenius Medical Care AG & Co. KGaA (Germany), and B. Braun Melsungen AG (Germany),
Scope of the Continuous Renal Replacement Therapy Industry:
|
Report Metric |
Details |
|
Market Revenue in 2023 |
$1.4 billion |
|
Estimated Value by 2028 |
$2.1 billion |
|
Revenue Rate |
Poised to grow at a CAGR of 8.1% |
|
Market Driver |
Increase in the prevalence of incidence of acute kidney injury (AKI) |
|
Market Opportunity |
Emerging markets in APAC and RoW |
This research report categorizes the Continuous Renal Replacement Therapy Market to forecast revenue and analyze trends in each of the following submarkets:
By Product
- Dialysates and Replacement Fluids
- Disposables
- Hemofilters
- Bloodline Sets & Tubes
- Other Disposables
- CRRT Systems
By Modality
- Continuous venovenous hemofiltration (CVVH)
- Continuous venovenous hemodiafiltration (CVVHDF)
- Continuous venovenous haemodialysis (CVVHD)
- Slow continuous ultrafiltration (SCUF)
By Age Group
- Adults
- Pediatrics /Neonates
By End User
- Hospital
- Ambulatory care
- Homecare
- Others
By Region
-
North America
- US
- Canada
-
Europe
- Germany
- UK
- France
- Italy
- Spain
- RoEU
-
Asia Pacific
- Japan
- China
- India
- Australia
- South Korea
- RoAPAC
-
Latin America
- Brazil
- Mexico
- Rest of Latin America
- Middle East and Africa
Recent Developments of Continuous Renal Replacement Therapy Industry
- In 2020, Medtronic plc announced the launch of the Carpediem system, the first and only pediatric and neonatal acute dialysis system designed to treat patients weighing 2.5–10 kg (5.5–22 pounds) requiring renal replacement therapy.
- In 2019, Baxter International Inc. introduced the PrisMax CRRT system in the US
- In 2019, Fresenius Medical Care AG & CO. KGaA announced the launch of the 4008A dialysis machine in India.
Frequently Asked Questions (FAQ):
What is the projected market revenue value of the global continuous renal replacement therapy market?
The global continuous renal replacement therapy market boasts a total revenue value of $2.1 billion by 2028.
What is the estimated growth rate (CAGR) of the global continuous renal replacement therapy market?
The global continuous renal replacement therapy market has an estimated compound annual growth rate (CAGR) of 8.1% and a revenue size in the region of $1.4 billion by 2023.
To speak to our analyst for a discussion on the above findings, click Speak to Analyst


- 5.1 INTRODUCTION
-
5.2 MARKET DYNAMICSDRIVERS- Increasing incidence of acute kidney injury (AKI)- Growing number of ICU patients with AKI and increasing incidence of sepsis- Increasing clinical advantage of CRRT over intermittent blood purification- Technological advancements and new product launches- Growing prevalence of diabetes and hypertensionRESTRAINTS- Stringent regulatory guidelines in North America- High procedural cost of CRRTOPPORTUNITIES- Emerging markets in Asia Pacific and RoW- Increasing applications of CRRT- Ongoing research to establish safety and efficacy profile of CRRT- Development of CRRT systems for pediatric patients- Untapped growth opportunities in North AmericaCHALLENGES- High complexity of CRRT- Lack of standard treatment guidelines in developing nations- Shortage of trained ICU professionals in developing nations- Poor reimbursement scenario in developing countries- Lack of awareness about benefits of CRRT
-
5.3 REGULATORY ANALYSISNORTH AMERICAEUROPEASIA PACIFIC- India- China- Japan- South KoreaREST OF THE WORLD (ROW)- Brazil- Argentina
-
5.4 REIMBURSEMENT SCENARIONORTH AMERICAEUROPEASIA PACIFIC- JapanREST OF THE WORLD (ROW)- Brazil- Central America and the Caribbean
- 5.5 KEY CONFERENCES & EVENTS
-
5.6 PATENT ANALYSISPATENT PUBLICATION TRENDS FOR CONTINUOUS RENAL REPLACEMENT THERAPY MARKETINSIGHTS ON JURISDICTION AND TOP APPLICANT ANALYSIS
- 5.7 TRADE ANALYSIS
-
5.8 TECHNOLOGY ANALYSISMINIMALLY INVASIVE CRRTCRRT IN COMBINATION WITH OTHER THERAPIES
-
5.9 ECOSYSTEM ANALYSIS
- 5.10 VALUE CHAIN ANALYSIS
- 5.11 PRICING TREND ANALYSIS
-
5.12 PORTER’S FIVE FORCES ANALYSISTHREAT OF NEW ENTRANTSTHREAT OF SUBSTITUTESBARGAINING POWER OF SUPPLIERSBARGAINING POWER OF BUYERSINTENSITY OF COMPETITIVE RIVALRY
-
5.13 KEY STAKEHOLDERS AND BUYING CRITERIAKEY STAKEHOLDERS IN BUYING PROCESSBUYING CRITERIA
- 5.14 ARTIFICIAL INTELLIGENCE INTEGRATION IN CONTINUOUS RENAL REPLACEMENT THERAPY SYSTEMS
- 5.15 UNMET NEED & END-USER EXPECTATIONS WITH CONTINUOUS RENAL REPLACEMENT THERAPY SYSTEMS
- 6.1 INTRODUCTION
-
6.2 DIALYSATE & REPLACEMENT FLUIDSRISING DEMAND FOR DIALYSATE TO DRIVE MARKET
-
6.3 DISPOSABLESHEMOFILTERS- Widely adopted during CRRT procedures for treatment of AKIBLOODLINE SETS & TUBES- Development of blood tubing with special coding to prevent clotting to offer growth opportunitiesOTHER DISPOSABLES
-
6.4 CRRT SYSTEMSAVAILABILITY OF TECHNOLOGICALLY ADVANCED, EASY-TO-USE SYSTEMS TO BOOST MARKET GROWTH
- 7.1 INTRODUCTION
-
7.2 CONTINUOUS VENOVENOUS HEMOFILTRATIONWIDESPREAD ADOPTION IN TREATMENT OF ACUTE KIDNEY INJURY TO DRIVE MARKET
-
7.3 CONTINUOUS VENOVENOUS HEMODIAFILTRATIONUSED IN PATIENTS WITH CONGESTIVE HEART FAILURE
-
7.4 CONTINUOUS VENOVENOUS HEMODIALYSISMORE EFFECTIVE IN REMOVING SMALL TO MEDIUM-SIZED MOLECULES COMPARED TO OTHER CRRT MODALITIES
-
7.5 SLOW CONTINUOUS ULTRAFILTRATIONDOES NOT USE DIALYSATE OR REPLACEMENT FLUIDS FOR REMOVAL OF EXCESS FLUID FROM BLOODSTREAM
- 8.1 INTRODUCTION
-
8.2 ADULTSLARGEST AND FASTEST-GROWING SEGMENT OF MARKET
-
8.3 PEDIATRICS & NEONATESHIGH PREVALENCE OF AKI IN NEONATES TO SUPPORT MARKET GROWTH
- 9.1 INTRODUCTION
-
9.2 HOSPITALSFASTEST-GROWING END-USER SEGMENT
-
9.3 AMBULATORY CAREREDUCED INPATIENT STAY TO SUPPORT MARKET GROWTH
-
9.4 HOME CARERISING ADOPTION OF PORTABLE AND HOME-BASED DEVICES TO AID MARKET GROWTH
- 9.5 OTHER END USERS
- 10.1 INTRODUCTION
-
10.2 NORTH AMERICANORTH AMERICAN CONTINUOUS RENAL REPLACEMENT THERAPY MARKET: RECESSION IMPACTUS- Large number of AKI patients to drive marketCANADA- High cost of CRRT to negatively impact market growth
-
10.3 EUROPEEUROPEAN CONTINUOUS RENAL REPLACEMENT THERAPY MARKET: RECESSION IMPACTGERMANY- Largest market for continuous renal replacement therapy in EuropeUK- Rising number of sepsis cases to support market growthFRANCE- Growing AKI patient population to propel market growthITALY- Government initiatives to promote awareness of renal care to drive marketSPAIN- Favorable reimbursement scenario to favor market growthREST OF EUROPE
-
10.4 ASIA PACIFICASIA PACIFIC CONTINUOUS RENAL REPLACEMENT THERAPY MARKET: RECESSION IMPACTJAPAN- Well-established medical infrastructure to support market growthCHINA- Increasing prevalence of ESRD and AKI to boost demand for CRRTINDIA- Large patient population to support market growthAUSTRALIA- Government initiatives to increase adoption of CRRTSOUTH KOREA- Increasing awareness through online education programs and events to aid market growthREST OF ASIA PACIFIC
-
10.5 LATIN AMERICALATIN AMERICAN CONTINUOUS RENAL REPLACEMENT THERAPY MARKET: RECESSION IMPACTBRAZIL- Rising incidence of AKI to drive marketMEXICO- Large patient population to drive marketREST OF LATIN AMERICA
-
10.6 MIDDLE EAST & AFRICALACK OF AWARENESS REGARDING CRRT TO RESTRAIN MARKET GROWTHMIDDLE EAST AND AFRICAN CONTINUOUS RENAL REPLACEMENT THERAPY MARKET: RECESSION IMPACT

- 11.1 OVERVIEW
- 11.2 REVENUE SHARE ANALYSIS OF MARKET PLAYERS, 2018–2022 (USD MILLION)
-
11.3 COMPANY EVALUATION MATRIXSTARSEMERGING LEADERSPERVASIVE PLAYERSPARTICIPANTS
-
11.4 COMPANY EVALUATION MATRIX FOR STARTUPS/SMES (2022)PROGRESSIVE COMPANIESSTARTING BLOCKSRESPONSIVE COMPANIESDYNAMIC COMPANIES
- 11.5 FOOTPRINT ANALYSIS OF PLAYERS IN CONTINUOUS RENAL REPLACEMENT THERAPY MARKET
- 11.6 CONTINUOUS RENAL REPLACEMENT THERAPY MARKET: PRODUCT LAUNCHES AND REGULATORY APPROVALS (JANUARY 2019 TO AUGUST 2023)
- 11.7 CONTINUOUS RENAL REPLACEMENT THERAPY MARKET: DEALS (JANUARY 2019 TO AUGUST 2023)
- 11.8 CONTINUOUS RENAL REPLACEMENT THERAPY MARKET: OTHER DEVELOPMENTS (JANUARY 2019 TO AUGUST 2023)
-
12.1 MAJOR PLAYERSBAXTER INTERNATIONAL, INC.- Business overview- Products offered- Recent developments- MnM viewFRESENIUS MEDICAL CARE AG & CO. KGAA- Business overview- Products offered- Recent developments- MnM viewNIKKISO CO., LTD.- Business overview- Products offered- Recent developments- MnM viewB. BRAUN MELSUNGEN AG- Business overview- Products offered- Recent developments- MnM viewMEDTRONIC PLC- Business overview- Products offered- Recent developments- MnM viewASAHI KASEI CORPORATION- Business overview- Products offered- Recent developmentsTORAY MEDICAL CO., LTD.- Business overview- Products offered- Recent developmentsNIPRO CORPORATION- Business overview- Products offered- Recent developmentsINFOMED SA- Business overview- Products offered- Recent developmentsMEDICA SPA- Business overview- Products offeredMEDITES PHARMA SPOL. S.R.O.- Business overview- Products offeredMEDICAL COMPONENTS, INC.- Business overview- Products offered- Recent developmentsSWS HEMODIALYSIS CARE CO., LTD.- Business overview- Products offered- Recent developmentsNINGBO TIANYI MEDICAL DEVICES CO., LTD.- Business overview- Products offeredANJUE MEDICAL EQUIPMENT CO., LTD.- Business overview- Products offered- Recent developmentsKIMAL- Business overview- Products offeredJIANGXI SANXIN MEDTEC CO., LTD.- Business overview- Products offered
-
12.2 OTHER PLAYERSALLMED MEDICAL PRODUCTS CO., LTD.DIALCO MEDICAL INC.BROWNDOVE HEALTHCARE PVT. LTD.STERIS PLCKURARAY MEDICAL PLCLIVANOVA PLCDIAVERUM DEUTSCHLAND GMBHSEMBCORP INDUSTRIES
- 13.1 DISCUSSION GUIDE
- 13.2 KNOWLEDGESTORE: MARKETSANDMARKETS’ SUBSCRIPTION PORTAL
- 13.3 CUSTOMIZATION OPTIONS
- 13.4 RELATED REPORTS
- 13.5 AUTHOR DETAILS
- TABLE 1 RISK ASSESSMENT: CONTINUOUS RENAL REPLACEMENT THERAPY MARKET
- TABLE 2 NUMBER OF PEOPLE AGED 65 OR OVER, BY REGION, 2019 VS. 2050
- TABLE 3 KEY CONFERENCES & EVENTS, 2023
- TABLE 4 CONTINUOUS RENAL REPLACEMENT THERAPY MARKET: LIST OF MAJOR PATENTS
- TABLE 5 AVERAGE PRICE OF CRRT SYSTEMS AND CONSUMABLES, BY COUNTRY, 2020 (USD)
- TABLE 6 CONTINUOUS RENAL REPLACEMENT THERAPY MARKET: PORTER’S FIVE FORCES ANALYSIS
- TABLE 7 INFLUENCE OF STAKEHOLDERS ON BUYING PROCESS FOR CONTINUOUS RENAL REPLACEMENT THERAPY MARKET
- TABLE 8 KEY BUYING CRITERIA FOR CONTINUOUS RENAL REPLACEMENT THERAPY MARKET
- TABLE 9 CONTINUOUS RENAL REPLACEMENT THERAPY MARKET, BY PRODUCT, 2021–2028 (USD MILLION)
- TABLE 10 DIALYSATE & REPLACEMENT FLUIDS MARKET, BY COUNTRY, 2021–2028 (USD MILLION)
- TABLE 11 DISPOSABLES MARKET, BY TYPE, 2021–2028 (USD MILLION)
- TABLE 12 DISPOSABLES MARKET, BY COUNTRY, 2021–2028 (USD MILLION)
- TABLE 13 HEMOFILTERS MARKET, BY COUNTRY, 2021–2028 (USD MILLION)
- TABLE 14 BLOODLINE SETS & TUBES MARKET, BY COUNTRY, 2021–2028 (USD MILLION)
- TABLE 15 OTHER DISPOSABLES MARKET, BY COUNTRY, 2021–2028 (USD MILLION)
- TABLE 16 CRRT SYSTEMS MARKET BY COUNTRY, 2021–2028 (USD MILLION)
- TABLE 17 CONTINUOUS RENAL REPLACEMENT THERAPY MARKET, BY MODALITY, 2021–2028 (USD MILLION)
- TABLE 18 CONTINUOUS VENOVENOUS HEMOFILTRATION MARKET, BY COUNTRY, 2021–2028 (USD MILLION)
- TABLE 19 CONTINUOUS VENOVENOUS HEMODIAFILTRATION MARKET, BY COUNTRY, 2021–2028 (USD MILLION)
- TABLE 20 CONTINUOUS VENOVENOUS HEMODIALYSIS MARKET, BY COUNTRY, 2021–2028 (USD MILLION)
- TABLE 21 SLOW CONTINUOUS ULTRAFILTRATION MARKET, BY COUNTRY, 2021–2028 (USD MILLION)
- TABLE 22 CONTINUOUS RENAL REPLACEMENT THERAPY MARKET, BY AGE GROUP, 2021–2028 (USD MILLION)
- TABLE 23 CONTINUOUS RENAL REPLACEMENT THERAPY MARKET FOR ADULTS, BY COUNTRY, 2021–2028 (USD MILLION)
- TABLE 24 CONTINUOUS RENAL REPLACEMENT THERAPY MARKET FOR PEDIATRICS & NEONATES, BY COUNTRY, 2021–2028 (USD MILLION)
- TABLE 25 CONTINUOUS RENAL REPLACEMENT THERAPY MARKET, BY END USER, 2021–2028 (USD MILLION)
- TABLE 26 CONTINUOUS RENAL REPLACEMENT THERAPY MARKET FOR HOSPITALS, BY COUNTRY, 2021–2028 (USD MILLION)
- TABLE 27 CONTINUOUS RENAL REPLACEMENT THERAPY MARKET FOR AMBULATORY CARE, BY COUNTRY, 2021–2028 (USD MILLION)
- TABLE 28 CONTINUOUS RENAL REPLACEMENT THERAPY MARKET FOR HOME CARE, BY COUNTRY, 2021–2028 (USD MILLION)
- TABLE 29 CONTINUOUS RENAL REPLACEMENT THERAPY MARKET FOR OTHER END USERS, BY COUNTRY, 2021–2028 (USD MILLION)
- TABLE 30 CONTINUOUS RENAL REPLACEMENT THERAPY MARKET, BY REGION, 2021–2028 (USD MILLION)
- TABLE 31 NORTH AMERICA: CONTINUOUS RENAL REPLACEMENT THERAPY MARKET, BY COUNTRY, 2021–2028 (USD MILLION)
- TABLE 32 NORTH AMERICA: CONTINUOUS RENAL REPLACEMENT THERAPY MARKET, BY PRODUCT, 2021–2028 (USD MILLION)
- TABLE 33 NORTH AMERICA: CONTINUOUS RENAL REPLACEMENT THERAPY DISPOSABLES MARKET, BY TYPE, 2021–2028 (USD MILLION)
- TABLE 34 NORTH AMERICA: CONTINUOUS RENAL REPLACEMENT THERAPY MARKET, BY MODALITY, 2021–2028 (USD MILLION)
- TABLE 35 NORTH AMERICA: CONTINUOUS RENAL REPLACEMENT THERAPY MARKET, BY AGE GROUP, 2021–2028 (USD MILLION)
- TABLE 36 NORTH AMERICA: CONTINUOUS RENAL REPLACEMENT THERAPY MARKET, BY END USER, 2021–2028 (USD MILLION)
- TABLE 37 US: CONTINUOUS RENAL REPLACEMENT THERAPY MARKET, BY PRODUCT, 2021–2028 (USD MILLION)
- TABLE 38 US: CONTINUOUS RENAL REPLACEMENT THERAPY DISPOSABLES MARKET, BY TYPE, 2021–2028 (USD MILLION)
- TABLE 39 US: CONTINUOUS RENAL REPLACEMENT THERAPY MARKET, BY MODALITY, 2021–2028 (USD MILLION)
- TABLE 40 US: CONTINUOUS RENAL REPLACEMENT THERAPY MARKET, BY AGE GROUP, 2021–2028 (USD MILLION)
- TABLE 41 US: CONTINUOUS RENAL REPLACEMENT THERAPY MARKET, BY END USER, 2021–2028 (USD MILLION)
- TABLE 42 CANADA: CONTINUOUS RENAL REPLACEMENT THERAPY MARKET, BY PRODUCT, 2021–2028 (USD MILLION)
- TABLE 43 CANADA: CONTINUOUS RENAL REPLACEMENT THERAPY DISPOSABLES MARKET, BY TYPE, 2021–2028 (USD MILLION)
- TABLE 44 CANADA: CONTINUOUS RENAL REPLACEMENT THERAPY MARKET, BY MODALITY, 2021–2028 (USD MILLION)
- TABLE 45 CANADA: CONTINUOUS RENAL REPLACEMENT THERAPY MARKET, BY AGE GROUP, 2021–2028 (USD MILLION)
- TABLE 46 CANADA: CONTINUOUS RENAL REPLACEMENT THERAPY MARKET, BY END USER, 2021–2028 (USD MILLION)
- TABLE 47 EUROPE: CONTINUOUS RENAL REPLACEMENT THERAPY MARKET, BY COUNTRY, 2021–2028 (USD MILLION)
- TABLE 48 EUROPE: CONTINUOUS RENAL REPLACEMENT THERAPY MARKET, BY PRODUCT, 2021–2028 (USD MILLION)
- TABLE 49 EUROPE: CONTINUOUS RENAL REPLACEMENT THERAPY DISPOSABLES MARKET, BY TYPE, 2021–2028 (USD MILLION)
- TABLE 50 EUROPE: CONTINUOUS RENAL REPLACEMENT THERAPY MARKET, BY MODALITY, 2021–2028 (USD MILLION)
- TABLE 51 EUROPE: CONTINUOUS RENAL REPLACEMENT THERAPY MARKET, BY AGE GROUP, 2021–2028 (USD MILLION)
- TABLE 52 EUROPE: CONTINUOUS RENAL REPLACEMENT THERAPY MARKET, BY END USER, 2021–2028 (USD MILLION)
- TABLE 53 GERMANY: CONTINUOUS RENAL REPLACEMENT THERAPY MARKET, BY PRODUCT, 2021–2028 (USD MILLION)
- TABLE 54 GERMANY: CONTINUOUS RENAL REPLACEMENT THERAPY DISPOSABLES MARKET, BY TYPE, 2021–2028 (USD MILLION)
- TABLE 55 GERMANY: CONTINUOUS RENAL REPLACEMENT THERAPY MARKET, BY MODALITY, 2021–2028 (USD MILLION)
- TABLE 56 GERMANY: CONTINUOUS RENAL REPLACEMENT THERAPY MARKET, BY AGE GROUP, 2021–2028 (USD MILLION)
- TABLE 57 GERMANY: CONTINUOUS RENAL REPLACEMENT THERAPY MARKET, BY END USER, 2021–2028 (USD MILLION)
- TABLE 58 UK: CONTINUOUS RENAL REPLACEMENT THERAPY MARKET, BY PRODUCT, 2021–2028 (USD MILLION)
- TABLE 59 UK: CONTINUOUS RENAL REPLACEMENT THERAPY DISPOSABLES MARKET, BY TYPE, 2021–2028 (USD MILLION)
- TABLE 60 UK: CONTINUOUS RENAL REPLACEMENT THERAPY MARKET, BY MODALITY, 2021–2028 (USD MILLION)
- TABLE 61 UK: CONTINUOUS RENAL REPLACEMENT THERAPY MARKET, BY AGE GROUP, 2021–2028 (USD MILLION)
- TABLE 62 UK: CONTINUOUS RENAL REPLACEMENT THERAPY MARKET, BY END USER, 2021–2028 (USD MILLION)
- TABLE 63 FRANCE: CONTINUOUS RENAL REPLACEMENT THERAPY MARKET, BY PRODUCT, 2021–2028 (USD MILLION)
- TABLE 64 FRANCE: CONTINUOUS RENAL REPLACEMENT THERAPY DISPOSABLES MARKET, BY TYPE, 2021–2028 (USD MILLION)
- TABLE 65 FRANCE: CONTINUOUS RENAL REPLACEMENT THERAPY MARKET, BY MODALITY, 2021–2028 (USD MILLION)
- TABLE 66 FRANCE: CONTINUOUS RENAL REPLACEMENT THERAPY MARKET, BY AGE GROUP, 2021–2028 (USD MILLION)
- TABLE 67 FRANCE: CONTINUOUS RENAL REPLACEMENT THERAPY MARKET, BY END USER, 2021–2028 (USD MILLION)
- TABLE 68 ITALY: CONTINUOUS RENAL REPLACEMENT THERAPY MARKET, BY PRODUCT, 2021–2028 (USD MILLION)
- TABLE 69 ITALY: CONTINUOUS RENAL REPLACEMENT THERAPY DISPOSABLES MARKET, BY TYPE, 2021–2028 (USD MILLION)
- TABLE 70 ITALY: CONTINUOUS RENAL REPLACEMENT THERAPY MARKET, BY MODALITY, 2021–2028 (USD MILLION)
- TABLE 71 ITALY: CONTINUOUS RENAL REPLACEMENT THERAPY MARKET, BY AGE GROUP, 2021–2028 (USD MILLION)
- TABLE 72 ITALY: CONTINUOUS RENAL REPLACEMENT THERAPY MARKET, BY END USER, 2021–2028 (USD MILLION)
- TABLE 73 SPAIN: CONTINUOUS RENAL REPLACEMENT THERAPY MARKET, BY PRODUCT, 2021–2028 (USD MILLION)
- TABLE 74 SPAIN: CONTINUOUS RENAL REPLACEMENT THERAPY DISPOSABLES MARKET, BY TYPE, 2021–2028 (USD MILLION)
- TABLE 75 SPAIN: CONTINUOUS RENAL REPLACEMENT THERAPY MARKET, BY MODALITY, 2021–2028 (USD MILLION)
- TABLE 76 SPAIN: CONTINUOUS RENAL REPLACEMENT THERAPY MARKET, BY AGE GROUP, 2021–2028 (USD MILLION)
- TABLE 77 SPAIN: CONTINUOUS RENAL REPLACEMENT THERAPY MARKET, BY END USER, 2021–2028 (USD MILLION)
- TABLE 78 REST OF EUROPE: CONTINUOUS RENAL REPLACEMENT THERAPY MARKET, BY PRODUCT, 2021–2028 (USD MILLION)
- TABLE 79 REST OF EUROPE: CONTINUOUS RENAL REPLACEMENT THERAPY DISPOSABLES MARKET, BY TYPE, 2021–2028 (USD MILLION)
- TABLE 80 REST OF EUROPE: CONTINUOUS RENAL REPLACEMENT THERAPY MARKET, BY MODALITY, 2021–2028 (USD MILLION)
- TABLE 81 REST OF EUROPE: CONTINUOUS RENAL REPLACEMENT THERAPY MARKET, BY AGE GROUP, 2021–2028 (USD MILLION)
- TABLE 82 REST OF EUROPE: CONTINUOUS RENAL REPLACEMENT THERAPY MARKET, BY END USER, 2021–2028 (USD MILLION)
- TABLE 83 ASIA PACIFIC: CONTINUOUS RENAL REPLACEMENT THERAPY MARKET, BY COUNTRY, 2021–2028 (USD MILLION)
- TABLE 84 ASIA PACIFIC: CONTINUOUS RENAL REPLACEMENT THERAPY MARKET, BY PRODUCT, 2021–2028 (USD MILLION)
- TABLE 85 ASIA PACIFIC: CONTINUOUS RENAL REPLACEMENT THERAPY DISPOSABLES MARKET, BY TYPE, 2021–2028 (USD MILLION)
- TABLE 86 ASIA PACIFIC: CONTINUOUS RENAL REPLACEMENT THERAPY MARKET, BY MODALITY, 2021–2028 (USD MILLION)
- TABLE 87 ASIA PACIFIC: CONTINUOUS RENAL REPLACEMENT THERAPY MARKET, BY AGE GROUP, 2021–2028 (USD MILLION)
- TABLE 88 ASIA PACIFIC: CONTINUOUS RENAL REPLACEMENT THERAPY MARKET, BY END USER, 2021–2028 (USD MILLION)
- TABLE 89 JAPAN: CONTINUOUS RENAL REPLACEMENT THERAPY MARKET, BY PRODUCT, 2021–2028 (USD MILLION)
- TABLE 90 JAPAN: CONTINUOUS RENAL REPLACEMENT THERAPY DISPOSABLES MARKET, BY TYPE, 2021–2028 (USD MILLION)
- TABLE 91 JAPAN: CONTINUOUS RENAL REPLACEMENT THERAPY MARKET, BY MODALITY, 2021–2028 (USD MILLION)
- TABLE 92 JAPAN: CONTINUOUS RENAL REPLACEMENT THERAPY MARKET, BY AGE GROUP, 2021–2028 (USD MILLION)
- TABLE 93 JAPAN: CONTINUOUS RENAL REPLACEMENT THERAPY MARKET, BY END USER, 2021–2028 (USD MILLION)
- TABLE 94 CHINA: CONTINUOUS RENAL REPLACEMENT THERAPY MARKET, BY PRODUCT, 2021–2028 (USD MILLION)
- TABLE 95 CHINA: CONTINUOUS RENAL REPLACEMENT THERAPY DISPOSABLES MARKET, BY TYPE, 2021–2028 (USD MILLION)
- TABLE 96 CHINA: CONTINUOUS RENAL REPLACEMENT THERAPY MARKET, BY MODALITY, 2021–2028 (USD MILLION)
- TABLE 97 CHINA: CONTINUOUS RENAL REPLACEMENT THERAPY MARKET, BY AGE GROUP, 2021–2028 (USD MILLION)
- TABLE 98 CHINA: CONTINUOUS RENAL REPLACEMENT THERAPY MARKET, BY END USER, 2021–2028 (USD MILLION)
- TABLE 99 INDIA: CONTINUOUS RENAL REPLACEMENT THERAPY MARKET, BY PRODUCT, 2021–2028 (USD MILLION)
- TABLE 100 INDIA: CONTINUOUS RENAL REPLACEMENT THERAPY DISPOSABLES MARKET, BY TYPE, 2021–2028 (USD MILLION)
- TABLE 101 INDIA: CONTINUOUS RENAL REPLACEMENT THERAPY MARKET, BY MODALITY, 2021–2028 (USD MILLION)
- TABLE 102 INDIA: CONTINUOUS RENAL REPLACEMENT THERAPY MARKET, BY AGE GROUP, 2021–2028 (USD MILLION)
- TABLE 103 INDIA: CONTINUOUS RENAL REPLACEMENT THERAPY MARKET, BY END USER, 2021–2028 (USD MILLION)
- TABLE 104 AUSTRALIA: CONTINUOUS RENAL REPLACEMENT THERAPY MARKET, BY PRODUCT, 2021–2028 (USD MILLION)
- TABLE 105 AUSTRALIA: CONTINUOUS RENAL REPLACEMENT THERAPY DISPOSABLES MARKET, BY TYPE, 2021–2028 (USD MILLION)
- TABLE 106 AUSTRALIA: CONTINUOUS RENAL REPLACEMENT THERAPY MARKET, BY MODALITY, 2021–2028 (USD MILLION)
- TABLE 107 AUSTRALIA: CONTINUOUS RENAL REPLACEMENT THERAPY MARKET, BY AGE GROUP, 2021–2028 (USD MILLION)
- TABLE 108 AUSTRALIA: CONTINUOUS RENAL REPLACEMENT THERAPY MARKET, BY END USER, 2021–2028 (USD MILLION)
- TABLE 109 SOUTH KOREA: CONTINUOUS RENAL REPLACEMENT THERAPY MARKET, BY PRODUCT, 2021–2028 (USD MILLION)
- TABLE 110 SOUTH KOREA: CONTINUOUS RENAL REPLACEMENT THERAPY DISPOSABLES MARKET, BY TYPE, 2021–2028 (USD MILLION)
- TABLE 111 SOUTH KOREA: CONTINUOUS RENAL REPLACEMENT THERAPY MARKET, BY MODALITY, 2021–2028 (USD MILLION)
- TABLE 112 SOUTH KOREA: CONTINUOUS RENAL REPLACEMENT THERAPY MARKET, BY AGE GROUP, 2021–2028 (USD MILLION)
- TABLE 113 SOUTH KOREA: CONTINUOUS RENAL REPLACEMENT THERAPY MARKET, BY END USER, 2021–2028 (USD MILLION)
- TABLE 114 REST OF ASIA PACIFIC: CONTINUOUS RENAL REPLACEMENT THERAPY MARKET, BY PRODUCT, 2021–2028 (USD MILLION)
- TABLE 115 REST OF ASIA PACIFIC: CONTINUOUS RENAL REPLACEMENT THERAPY DISPOSABLES MARKET, BY TYPE, 2021–2028 (USD MILLION)
- TABLE 116 REST OF ASIA PACIFIC: CONTINUOUS RENAL REPLACEMENT THERAPY MARKET, BY MODALITY, 2021–2028 (USD MILLION)
- TABLE 117 REST OF ASIA PACIFIC: CONTINUOUS RENAL REPLACEMENT THERAPY MARKET, BY AGE GROUP, 2021–2028 (USD MILLION)
- TABLE 118 REST OF ASIA PACIFIC: CONTINUOUS RENAL REPLACEMENT THERAPY MARKET, BY END USER, 2021–2028 (USD MILLION)
- TABLE 119 LATIN AMERICA: CONTINUOUS RENAL REPLACEMENT THERAPY MARKET, BY COUNTRY, 2021–2028 (USD MILLION)
- TABLE 120 LATIN AMERICA: CONTINUOUS RENAL REPLACEMENT THERAPY MARKET, BY PRODUCT, 2021–2028 (USD MILLION)
- TABLE 121 LATIN AMERICA: CONTINUOUS RENAL REPLACEMENT THERAPY DISPOSABLES MARKET, BY TYPE, 2021–2028 (USD MILLION)
- TABLE 122 LATIN AMERICA: CONTINUOUS RENAL REPLACEMENT THERAPY MARKET, BY MODALITY, 2021–2028 (USD MILLION)
- TABLE 123 LATIN AMERICA: CONTINUOUS RENAL REPLACEMENT THERAPY MARKET, BY AGE GROUP, 2021–2028 (USD MILLION)
- TABLE 124 LATIN AMERICA: CONTINUOUS RENAL REPLACEMENT THERAPY MARKET, BY END USER, 2021–2028 (USD MILLION)
- TABLE 125 BRAZIL: CONTINUOUS RENAL REPLACEMENT THERAPY MARKET, BY PRODUCT, 2021–2028 (USD MILLION)
- TABLE 126 BRAZIL: CONTINUOUS RENAL REPLACEMENT THERAPY DISPOSABLES MARKET, BY TYPE, 2021–2028 (USD MILLION)
- TABLE 127 BRAZIL: CONTINUOUS RENAL REPLACEMENT THERAPY MARKET, BY MODALITY, 2021–2028 (USD MILLION)
- TABLE 128 BRAZIL: CONTINUOUS RENAL REPLACEMENT THERAPY MARKET, BY AGE GROUP, 2021–2028 (USD MILLION)
- TABLE 129 BRAZIL: CONTINUOUS RENAL REPLACEMENT THERAPY MARKET, BY END USER, 2021–2028 (USD MILLION)
- TABLE 130 MEXICO: CONTINUOUS RENAL REPLACEMENT THERAPY MARKET, BY PRODUCT, 2021–2028 (USD MILLION)
- TABLE 131 MEXICO: CONTINUOUS RENAL REPLACEMENT THERAPY DISPOSABLES MARKET, BY TYPE, 2021–2028 (USD MILLION)
- TABLE 132 MEXICO: CONTINUOUS RENAL REPLACEMENT THERAPY MARKET, BY MODALITY, 2021–2028 (USD MILLION)
- TABLE 133 MEXICO: CONTINUOUS RENAL REPLACEMENT THERAPY MARKET, BY AGE GROUP, 2021–2028 (USD MILLION)
- TABLE 134 MEXICO: CONTINUOUS RENAL REPLACEMENT THERAPY MARKET, BY END USER, 2021–2028 (USD MILLION)
- TABLE 135 REST OF LATIN AMERICA: CONTINUOUS RENAL REPLACEMENT THERAPY MARKET, BY PRODUCT, 2021–2028 (USD MILLION)
- TABLE 136 REST OF LATIN AMERICA: CONTINUOUS RENAL REPLACEMENT THERAPY DISPOSABLES MARKET, BY TYPE, 2021–2028 (USD MILLION)
- TABLE 137 REST OF LATIN AMERICA: CONTINUOUS RENAL REPLACEMENT THERAPY MARKET, BY MODALITY, 2021–2028 (USD MILLION)
- TABLE 138 REST OF LATIN AMERICA: CONTINUOUS RENAL REPLACEMENT THERAPY MARKET, BY AGE GROUP, 2021–2028 (USD MILLION)
- TABLE 139 REST OF LATIN AMERICA: CONTINUOUS RENAL REPLACEMENT THERAPY MARKET, BY END USER, 2021–2028 (USD MILLION)
- TABLE 140 MIDDLE EAST & AFRICA: CONTINUOUS RENAL REPLACEMENT THERAPY MARKET, BY PRODUCT, 2021–2028 (USD MILLION)
- TABLE 141 MIDDLE EAST & AFRICA: CONTINUOUS RENAL REPLACEMENT THERAPY DISPOSABLES MARKET, BY TYPE, 2021–2028 (USD MILLION)
- TABLE 142 MIDDLE EAST & AFRICA: CONTINUOUS RENAL REPLACEMENT THERAPY MARKET, BY MODALITY, 2021–2028 (USD MILLION)
- TABLE 143 MIDDLE EAST & AFRICA: CONTINUOUS RENAL REPLACEMENT THERAPY MARKET, BY AGE GROUP, 2021–2028 (USD MILLION)
- TABLE 144 MIDDLE EAST & AFRICA: CONTINUOUS RENAL REPLACEMENT THERAPY MARKET, BY END USER, 2021–2028 (USD MILLION)
- TABLE 145 CONTINUOUS RENAL REPLACEMENT THERAPY MARKET: DEGREE OF COMPETITION
- TABLE 146 PRODUCT, REGIONAL, AND END-USER FOOTPRINT ANALYSIS OF PLAYERS IN CONTINUOUS RENAL REPLACEMENT THERAPY MARKET
- TABLE 147 PRODUCT FOOTPRINT OF COMPANIES
- TABLE 148 END-USER FOOTPRINT OF COMPANIES
- TABLE 149 REGIONAL FOOTPRINT OF COMPANIES
- TABLE 150 KEY PRODUCT LAUNCHES AND REGULATORY APPROVALS
- TABLE 151 KEY DEALS
- TABLE 152 OTHER KEY DEVELOPMENTS
- TABLE 153 BAXTER INTERNATIONAL, INC.: BUSINESS OVERVIEW
- TABLE 154 BAXTER INTERNATIONAL, INC.: PRODUCT OFFERINGS
- TABLE 155 FRESENIUS MEDICAL CARE AG & CO. KGAA: BUSINESS OVERVIEW
- TABLE 156 FRESENIUS MEDICAL CARE AG & CO. KGAA: PRODUCT OFFERINGS
- TABLE 157 NIKKISO CO., LTD.: BUSINESS OVERVIEW
- TABLE 158 NIKKISO CO., LTD.: PRODUCT OFFERINGS
- TABLE 159 B. BRAUN MELSUNGEN AG: BUSINESS OVERVIEW
- TABLE 160 B. BRAUN MELSUNGEN AG: PRODUCT OFFERINGS
- TABLE 161 MEDTRONIC PLC: BUSINESS OVERVIEW
- TABLE 162 MEDTRONIC PLC: PRODUCT OFFERINGS
- TABLE 163 ASAHI KASEI CORPORATION: BUSINESS OVERVIEW
- TABLE 164 ASAHI KASEI CORPORATION: PRODUCT OFFERINGS
- TABLE 165 TORAY MEDICAL CO., LTD.: BUSINESS OVERVIEW
- TABLE 166 TORAY MEDICAL CO., LTD.: PRODUCT OFFERINGS
- TABLE 167 NIPRO CORPORATION: BUSINESS OVERVIEW
- TABLE 168 NIPRO CORPORATION: PRODUCT OFFERINGS
- TABLE 169 INFOMED SA: BUSINESS OVERVIEW
- TABLE 170 INFOMED SA: PRODUCT OFFERINGS
- TABLE 171 MEDICA SPA: BUSINESS OVERVIEW
- TABLE 172 MEDICA SPA: PRODUCT OFFERINGS
- TABLE 173 MEDITES PHARMA SPOL. S.R.O.: BUSINESS OVERVIEW
- TABLE 174 MEDITES PHARMA SPOL. S.R.O.: PRODUCT OFFERINGS
- TABLE 175 MEDICAL COMPONENTS, INC.: BUSINESS OVERVIEW
- TABLE 176 MEDICAL COMPONENTS, INC.: PRODUCT OFFERINGS
- TABLE 177 SWS HEMODIALYSIS CARE CO., LTD.: BUSINESS OVERVIEW
- TABLE 178 SWS HEMODIALYSIS CARE CO., LTD.: PRODUCT OFFERINGS
- TABLE 179 NINGBO TIANYI MEDICAL DEVICES CO., LTD.: BUSINESS OVERVIEW
- TABLE 180 NINGBO TIANYI MEDICAL DEVICES CO., LTD.: PRODUCT OFFERINGS
- TABLE 181 ANJUE MEDICAL EQUIPMENT CO., LTD.: BUSINESS OVERVIEW
- TABLE 182 ANJUE MEDICAL EQUIPMENT CO., LTD.: PRODUCT OFFERINGS
- TABLE 183 KIMAL: BUSINESS OVERVIEW
- TABLE 184 KIMAL.: PRODUCT OFFERINGS
- TABLE 185 JIANGXI SANXIAN MEDTECH CO., LTD.: BUSINESS OVERVIEW
- TABLE 186 JIANGXI SANXIAN MEDTECH CO., LTD.: PRODUCT OFFERINGS
- FIGURE 1 CONTINUOUS RENAL REPLACEMENT THERAPY MARKET: REGIONAL SEGMENTATION
- FIGURE 2 RESEARCH DESIGN
- FIGURE 3 PRIMARY SOURCES
- FIGURE 4 BREAKDOWN OF PRIMARY INTERVIEWS: SUPPLY-SIDE AND DEMAND-SIDE PARTICIPANTS
- FIGURE 5 BREAKDOWN OF PRIMARIES: CONTINUOUS RENAL REPLACEMENT THERAPY (CRRT) MARKET
- FIGURE 6 BREAKDOWN OF PRIMARY INTERVIEWS (DEMAND SIDE): BY END USER, DESIGNATION, AND REGION
- FIGURE 7 SUPPLY-SIDE MARKET ESTIMATION: REVENUE SHARE ANALYSIS
- FIGURE 8 REVENUE SHARE ANALYSIS ILLUSTRATION: BAXTER INTERNATIONAL INC.
- FIGURE 9 REVENUE SHARE ANALYSIS FOR TOP PLAYERS
- FIGURE 10 DEMAND-SIDE MARKET ESTIMATION: CONTINUOUS RENAL REPLACEMENT THERAPY MARKET
- FIGURE 11 DEMAND-SIDE MARKET ESTIMATION: CONTINUOUS RENAL REPLACEMENT THERAPY CONSUMABLES
- FIGURE 12 CAGR PROJECTIONS FROM ANALYSIS OF DRIVERS, RESTRAINTS, OPPORTUNITIES, AND CHALLENGES IN CONTINUOUS RENAL REPLACEMENT THERAPY MARKET (2023–2028)
- FIGURE 13 CAGR PROJECTIONS: SUPPLY-SIDE ANALYSIS
- FIGURE 14 TOP-DOWN APPROACH
- FIGURE 15 DATA TRIANGULATION METHODOLOGY
- FIGURE 16 CONTINUOUS RENAL REPLACEMENT THERAPY MARKET, BY PRODUCT, 2023 VS. 2028 (USD MILLION)
- FIGURE 17 CONTINUOUS RENAL REPLACEMENT THERAPY MARKET, BY MODALITY, 2023 VS. 2028 (USD MILLION)
- FIGURE 18 CONTINUOUS RENAL REPLACEMENT THERAPY MARKET, BY AGE GROUP, 2023 VS. 2028 (USD MILLION)
- FIGURE 19 CONTINUOUS RENAL REPLACEMENT THERAPY MARKET, BY END USER, 2023 VS. 2028 (USD MILLION)
- FIGURE 20 GEOGRAPHICAL SNAPSHOT OF CONTINUOUS RENAL REPLACEMENT THERAPY MARKET
- FIGURE 21 RISING PREVALENCE OF ACUTE KIDNEY INJURY AND GROWING AWARENESS OF CRRT TO DRIVE MARKET
- FIGURE 22 DIALYSATE & REPLACEMENT FLUIDS SEGMENT ACCOUNTED FOR LARGEST SHARE OF NORTH AMERICAN MARKET IN 2022
- FIGURE 23 INDIA TO REGISTER HIGHEST GROWTH DURING FORECAST PERIOD
- FIGURE 24 NORTH AMERICA WILL CONTINUE TO DOMINATE MARKET DURING FORECAST PERIOD
- FIGURE 25 EMERGING MARKETS TO REGISTER HIGHER GROWTH DURING FORECAST PERIOD
- FIGURE 26 CONTINUOUS RENAL REPLACEMENT THERAPY MARKET: DRIVERS, RESTRAINTS, OPPORTUNITIES, AND CHALLENGES
- FIGURE 27 GLOBAL INCIDENCE OF ACUTE KIDNEY INJURY, 2010 VS. 2015 VS. 2020
- FIGURE 28 IMPACT OF ICU-ACQUIRED AKI IN US
- FIGURE 29 PATENT PUBLICATION TRENDS (JANUARY 2013–AUGUST 2023)
- FIGURE 30 TOP APPLICANTS AND OWNERS (COMPANIES/INSTITUTES) FOR CONTINUOUS RENAL REPLACEMENT PATENTS, 2013–2023
- FIGURE 31 TOP 10 APPLICANT COUNTRIES/REGIONS FOR CONTINUOUS RENAL REPLACEMENT PATENTS, 2013–2023
- FIGURE 32 VALUE CHAIN OF CONTINUOUS RENAL REPLACEMENT THERAPY MARKET
- FIGURE 33 INFLUENCE OF STAKEHOLDERS ON BUYING PROCESS FOR CONTINUOUS RENAL REPLACEMENT THERAPY MARKET
- FIGURE 34 KEY BUYING CRITERIA FOR CONTINUOUS RENAL REPLACEMENT THERAPY MARKET
- FIGURE 35 NORTH AMERICA: CONTINUOUS RENAL REPLACEMENT THERAPY MARKET SNAPSHOT
- FIGURE 36 ASIA PACIFIC: CONTINUOUS RENAL REPLACEMENT THERAPY MARKET SNAPSHOT
- FIGURE 37 GROWTH STRATEGIES ADOPTED BY KEY PLAYERS IN CONTINUOUS RENAL REPLACEMENT THERAPY MARKET
- FIGURE 38 REVENUE SHARE ANALYSIS OF TOP PLAYERS IN CONTINUOUS RENAL REPLACEMENT THERAPY MARKET
- FIGURE 39 MARKET SHARE ANALYSIS, BY KEY PLAYER, 2022
- FIGURE 40 CONTINUOUS RENAL REPLACEMENT THERAPY MARKET: COMPANY EVALUATION MATRIX, 2022
- FIGURE 41 CONTINUOUS RENAL REPLACEMENT THERAPY MARKET: COMPANY EVALUATION MATRIX FOR STARTUPS/SMES, 2022
- FIGURE 42 BAXTER INTERNATIONAL, INC.: COMPANY SNAPSHOT (2022)
- FIGURE 43 FRESENIUS MEDICAL CARE AG & CO. KGAA: COMPANY SNAPSHOT (2022)
- FIGURE 44 NIKKISO CO., LTD.: COMPANY SNAPSHOT (2022)
- FIGURE 45 B. BRAUN MELSUNGEN AG: COMPANY SNAPSHOT (2022)
- FIGURE 46 MEDTRONIC PLC: COMPANY SNAPSHOT (2022)
- FIGURE 47 ASAHI KASEI CORPORATION: COMPANY SNAPSHOT (2022)
- FIGURE 48 TORAY MEDICAL CO., LTD.: COMPANY SNAPSHOT (2022)
- FIGURE 49 NIPRO CORPORATION: COMPANY SNAPSHOT (2022)
The study involved four major activities to estimate the current size of the Continuous Renal Replacement Therapy (CRRT) market. Exhaustive secondary research was carried out to collect information on the market and its different subsegments. The next step was to validate these findings, assumptions, and sizing with industry experts across the value chain through primary research. Top-down and bottom-up approaches were employed to estimate the complete market size. Thereafter, market breakdown and data triangulation procedures were used to estimate the size of segments and subsegments.
Secondary Research
In the secondary research process, various secondary sources, such as annual reports, press releases & investor presentations of companies, white papers, certified publications, articles by recognized authors, regulatory bodies, and publications from government sources [such as National Institutes of Health (NIH), US FDA, US Census Bureau, World Health Organization (WHO), American Society Nephrology (ASN), American Association of Kidney Patients (AAKP), European Renal Association were referred to identify and collect information for the CRRTmarket study.
Primary Research
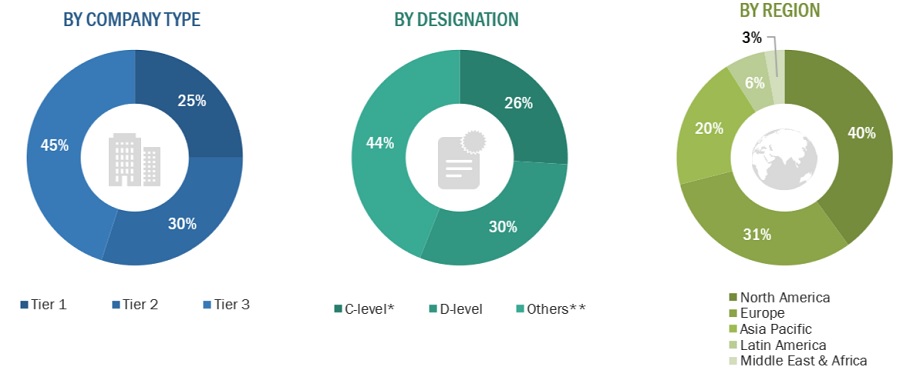
The CRRT market comprises several stakeholders such as manufacturers Of CRRT machine, CRRT disposables, dialysates and replacement fluids, market research and consulting firms. The demand side of this market is characterized by the increasing AKI, growing awareness of CRRT, and increased in number of players in the market. Various primary sources from both the supply and demand sides of the market were interviewed to obtain qualitative and quantitative information. The following is the breakdown of primary respondents:
To know about the assumptions considered for the study, download the pdf brochure
Market Size Estimation
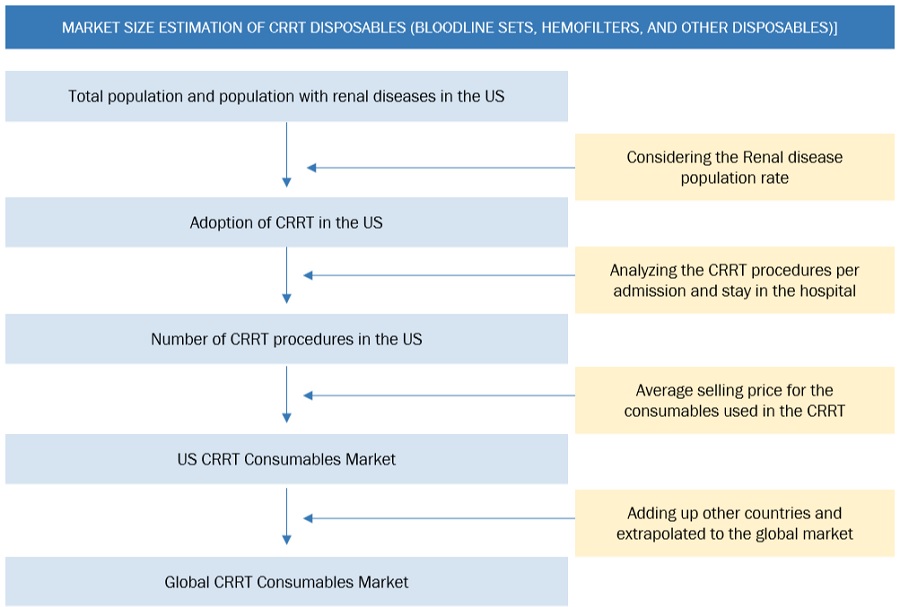
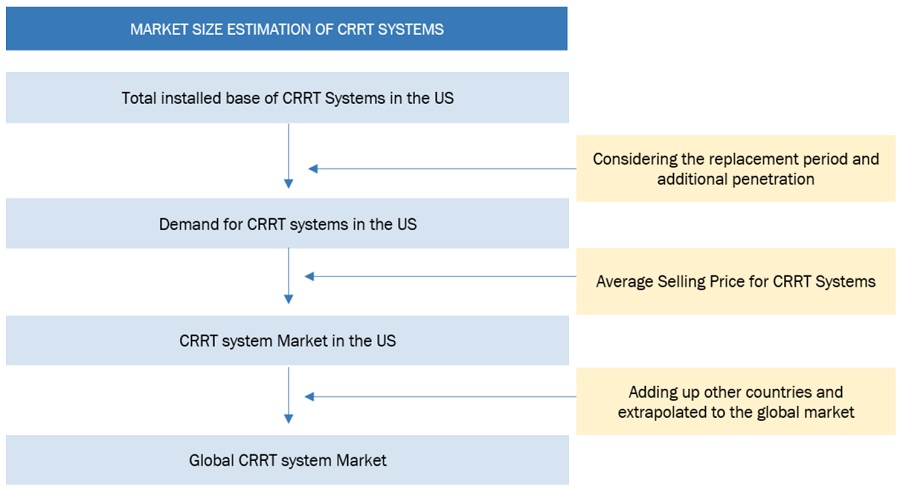
Both top-down and bottom-up approaches were used to estimate and validate the total size of the CRRT market. These methods were also used extensively to estimate the size of various subsegments in the market. The research methodology used to estimate the market size includes the following:
- The key players in the industry and markets have been identified through extensive secondary research
- The industry’s supply chain and market size, in terms of value, have been determined through primary and secondary research
- All percentage shares, splits, and breakdowns have been determined using secondary sources and verified through primary sources
To know about the assumptions considered for the study, Request for Free Sample Report
Data Triangulation
After arriving at the overall size of the global CRRT market through the above-mentioned methodology, this market was split into several segments and subsegments. The data triangulation and market breakdown procedures were employed, wherever applicable, to complete the overall market engineering process and arrive at the exact market value data for the key segments and subsegments. The extrapolated market data was triangulated by studying various macro indicators and regional trends from both demand- and supply-side participants.
Market Definition
Continuous renal replacement therapy (CRRT) is a dialysis modality used to treat critically ill, hospitalised patients in intensive care units (ICUs) with acute kidney injury (AKI). It is designed to provide round the clock treatment for impaired renal function over an extended period. CRRT is one of the preferred treatment choice among nephrologists for the treatment of haemodynamically unstable AKI patients. It offers hemodynamic tolerance by slowly and efficiently removing solutes compared to other dialysis techniques such as intermittent hemodialysis (IHD) and sustained low effiicncy dialysis (SLED).
Key stakeholders
- CRRT manufacturers, vendors, and distributors
- Distributors, channel partners, and third-party suppliers
- CRRT service providers
- Renal research laboratories
- Renal associations and organizations
- Healthcare service providers (including hospitals, critical care centers, and dialysis centers)
- Academic medical centers and universities
- Business research and consulting service providers
- Venture capitalists and other government funding organizations
Report Objectives
- To define, describe, and forecast the global CRRT market on the basis of product, modality, age group and region.
- To provide detailed information regarding the major factors influencing the market growth (such as drivers, restraints, opportunities, and challenges)
- To strategically analyze micromarkets1 with respect to individual growth trends, future prospects, and contributions to the overall market
- To analyze the opportunities in the market for key stakeholders and provide details of the competitive landscape for major market leaders
- To forecast the size of the market segments with respect to five main regions, namely, North America (the US and Canada), Europe (Germany, the UK, France, Italy, Spain, and Rest of Europe), Asia Pacific (Japan, China, India, Australia, South Korea, and Rest of Asia Pacific), Latin America (Brazil, Mexico, and Rest of Latin America), and the Middle East & Africa
- To profile the key market players and comprehensively analyze their market shares and core competencies2
- To track and analyze competitive developments such as mergers and acquisitions, new product developments, partnerships, agreements, collaborations, and expansions in the global CRRT market
Available Customizations
With the given market data, MarketsandMarkets offers customizations as per your company’s specific needs. The following customization options are available for the global CRRT market report
Product Analysis
- Product Matrix, which gives a detailed comparison of the product portfolios of the top five global players.
Company Information
- Detailed analysis and profiling of additional market players (up to 5 OEMs)
Geographic Analysis
- Further breakdown of the Rest of Europe CRRT market into Belgium, Austria,
- Denmark, Greece, Poland, and Russia, among other countries
- Further breakdown of the Rest of Asia Pacific CRRT market into New Zealand, Vietnam, Philippines, Singapore, Malaysia, Thailand, and Indonesia, among other countries
- Further breakdown of the Rest of Latin America CRRT market into Argentina, and Colombia, among other countries.


 Generating Response ...


Growth opportunities and latent adjacency in Continuous Renal Replacement Therapy Market