[258 Pages Report] The global hemodialysis and peritoneal dialysis market is projected to grow from an estimated USD 74.2 billion in 2019 to USD 99.2 billion by 2024, at a CAGR of 6.0% during the forecast period.
Clients Problem Statement
The client, a leading healthcare company, was interested in investing in the hemodialysis and peritoneal dialysis market. The client wanted MnM to provide data on the number of dialysis patients and incidence of dialysis across major countries including the US, Germany, and Australia, among others. The other objective of the study was to understand the regulatory scenario for hemodialysis and peritoneal procedures, reimbursement status, and competitive analysis in countries including Australia, New Zealand, and Singapore, among others.
MnM Approach
A detailed analysis of the number of ESRD/CKD patients opting for each dialysis modality was studied. Further, a list of leading end user facilities providing dialysis services was estimated to arrive at value market sizes. Secondary research, which involved scanning through company websites, annual reports, and corporate presentations, was conducted to gain a preliminary understanding of the market. These sources were also referred to understand the geographic reach and width and depth of portfolio of the competitors in the country. Primary research involved identification of key industry experts with extensive knowledge and exposure to the dialysis market. This was followed by a detailed analysis of the gathered data to arrive at the current market scenario and opportunities for the next five years. The analysis also involved insights into the competitive scenario and strategies adopted by major players to penetrate the market.
Through this, MnM was able to provide its client an in-depth understanding of the market opportunities, total patient population, reimbursement, regulatory scenario, and competitive landscape in the hemodialysis and peritoneal dialysis market across various countries. The strategic recommendations focused on launching new products against the competitors portfolio and positioning them to address unmet needs among end users.
Revenue Impact (RI)
Helped a leading medical device manufacturer to tap into USD 6 billion peritoneal dialysis market with an expected revenue gain of USD 25 million during next 5 years
On the basis of type, the dialysis market is segmented into hemodialysis and peritoneal dialysis. The hemodialysis segment is further categorized into products (machines, & consumables/supplies) & services (in-center hemodialysis services and home hemodialysis (HHD) services). The peritoneal dialysis segment is further divided into products (machines & consumables) & services. The hemodialysis segment is expected to hold the largest share of the dialysis market as of 2019 mainly owing to greater accessibility of HD centers, growing number of community dialysis centers, higher physician expertise & awareness to administer HD, reimbursement coverage, and socio-demographic factors.
Hemodialysis and peritoneal dialysis market, by end user, is segmented into two categoriesin-center dialysis and home dialysis. The in-center dialysis end-user segment is expected to hold the largest share of the dialysis end user market in 2019; mainly due to the increasing number of dialysis centers across the globe, new product launches, and the availability of healthcare professionals in dialysis centers are propelling the growth of the in-center dialysis market.
The Asia Pacific is one of the major revenue-generating regions in the hemodialysis and peritoneal dialysis market market. China, India, and Japan are the major countries responsible for the high growth of this regional market owing to factors such as the increasing per capita income, improving healthcare infrastructure, and supportive government activities in these emerging countries. Furthermore, the increasing geriatric population, the growing incidence of ESRD, and the rising acceptance of home hemodialysis ad peritoneal dilaysis are also driving the growth of this regional market.
Market growth is largely driven by factors such as increasing number of ESRD patients, growing prevalence of diabetes & hypertension (major causes of kidney failure), and preference for dialysis treatments over kidney transplants due to lack of donors. Furthermore, rise in the number of dialysis centers across globe shortage of organ donors and risks associated with transplant, technological advancements and initiatives taken by leading players to introduce advanced products & services are adding growth opportunities to hemodialysis and peritoneal dialysis market.
Dialysis (including hemodialysis and peritoneal dialysis) and kidney transplantation are the available treatment options for CKD and ESRD, of which dialysis is the most preferred treatment option owing to the shortage of organ donors. According to the USRDS 2018 Annual Report, there are more than 100,000 ESRD patients on the US transplant wait list. Also, in 2016, only 20,161 kidney transplants were performed in the US.
The other factors contributing to the reduced preference for kidney transplants include patient aversion toward organ donation, financial constraints, lack of sufficient surgical facilities, risks of surgery such as organ rejection, and complications due to adverse effects of immunosuppressive drugs. These challenges associated with kidney transplants have led to the low preference for these procedures, which in turn has resulted in an increase in the number of patients opting for dialysis. Some key statistics in this regard have been listed below:
Furthermore, the transplanted kidney is treated as a foreign object by the body, and the patient must take immunosuppressants, which can have numerous side effects. As a result, the transplant recipient is at a greater risk for infections and cancers. Thus, the risk of organ rejection and the shortage.
Developing countries such as China and India, which account for a huge ESRD population base, do not have a well-established system for full reimbursement and insurance coverage for dialysis.
Reimbursement is essential for the wider acceptability of dialysis owing to the high cost of the treatment. As a result, most patients in emerging nations either leave the treatment mid-way or do not have access to treatment due to financial constraints. This is a key factor expected to hamper the growth of the hemodialysis and peritoneal dialysis market.
Report Metric |
Details |
Market Size Available for Years |
20172024 |
Base Year Considered |
2018 |
Forecast Period |
20192024 |
Forecast Units |
Value (USD) |
Segments Covered |
Type, Product Type, Modality, End User and Region |
Geographies Covered |
North America (US & Canada), Europe (Germany, France, UK, and RoE), APAC (Japan, China, India, and RoAPAC), and the RoW (Latin America, Middle East, and Africa) |
Companies Covered |
Fresenius Medical Care AG & Co. KGaA (Germany), DaVita Healthcare Partners, Inc. (US), Baxter International, Inc. (US), B. Braun Melsungen AG (Germany). Other players in this market include Ion Nipro Corporation (Japan), Cantel Medical Corporation (US), NIKKISO CO., LTD (Japan), Diaverum Healthcare Partners (Germany), Asahi Kasei Corporation (Japan), Medtronic Plc (Ireland), Rockwell Medical, Inc. (US), Becton, Dickinson and Company (US), Dialife Group (Switzerland), and Isopure Corp. (US),. Major 15 players covered. |
This research report categorizes the hemodialysis and peritoneal dialysis market based on type, product & services, modality, and end user.
Fresenius Medical Care AG & Co. KGaA (Germany), DaVita Healthcare Partners, Inc. (US), Baxter International, Inc. (US), B. Braun Melsungen AG (Germany), ae key players dominating the market. Other players in this market include Nipro Corporation (Japan), Cantel Medical Corporation (US), NIKKISO CO., LTD (Japan), Diaverum Healthcare Partners (Germany), Asahi Kasei Corporation (Japan), Medtronic Plc (Ireland), Rockwell Medical, Inc. (US), Becton, Dickinson and Company (US), Dialife Group (Switzerland), and Isopure Corp. (US), among others.
Fresenius Medical Care AG & Co. KGaA (Germany) is one of the leading players in the global hemodialysis and peritoneal dialysis market. Its broad portfolio of dialysis products is the key factor accounting for its large share in this market. The company has adopted both organic and inorganic growth strsategies such as agreements, partnerships, collaborations, product launches, and contracts to maintain its top position. The company is also focused on providing training and conducting workshops to increase the adoption of its products.
To speak to our analyst for a discussion on the above findings, click Speak to Analyst
Table of Contents
1 Introduction (Page No. - 30)
1.1 Objectives of the Study
1.2 Market Definition
1.3 Market Scope
1.3.1 Markets Covered
1.3.2 Years Considered for the Study
1.4 Currency
1.5 Stakeholders
2 Research Methodology (Page No. - 33)
2.1 Research Data
Figure 1 Hemodialysis and Peritoneal Dialysis Market:Research Methodology Steps
Figure 2 Research Design
2.1.1 Secondary Data
2.1.1.1 Key Data From Secondary Sources
2.1.2 Primary Data
2.1.2.1 Key Data From Primary Sources
2.1.2.2 Breakdown of Primaries
Figure 3 Research Methodology: Hypothesis Building
2.2 Market Size Estimation Methodology
2.2.1 Product-Based Market Estimation
Figure 4 Bottom-Up Approach Market Size Estimation: Hemodialysis and Peritoneal Dialysis Market
Figure 5 Top-Down Approach Market Size Estimation: Hemodialysis and Peritoneal Dialysis Market
Figure 6 Research Methodology: Top-Down Approach (For HD and PD Dialysis Services Market)
2.3 Market Data Validation and Triangulation
Figure 7 Data Triangulation Methodology
2.4 Research Limitations and Assumptions
2.4.1 Limitations
2.4.2 Assumptions
3 Executive Summary (Page No. - 44)
Figure 8 Hemodialysis & Peritoneal Dialysis Market, By Type & Region, 2019 (USD Billion)
Figure 9 Hemodialysis Market, By Product & Service, 2019 vs 2024 (USD Billion)
Figure 10 Peritoneal Dialysis Products Market, By Type, 2019 vs 2024 (USD Billion)
Figure 11 Dialysis Water Treatment Systems Market Share, By Type, 2019 vs 2024
Figure 12 Hemodialysis & Peritoneal Dialysis Market Share, By Usage, 2019 vs 2024
Figure 13 Hemodialysis & Peritoneal Dialysis Market, By Region
4 Premium Insights (Page No. - 49)
4.1 Hemodialysis & Peritoneal Dialysis: Market Overview
Figure 14 Increasing Number of ESRD Patients to Drive the Growth of the Hemodialysis & Peritoneal Dialysis Market During the Forecast Period
4.2 Hemodialysis & Peritoneal Dialysis Market Share, By Type, 2019 vs 2024
Figure 15 Hemodialysis Segment is Expected to Dominate the Global Hemodialysis & Peritoneal Dialysis Market During the Forecast Period
4.3 Hemodialysis Market, By Product & Service, 2019 vs 2024 (USD Billion)
Figure 16 Hemodialysis Services to Register the Highest Growth in the Hemodialysis Market During the Forecast Period
4.4 Hemodialysis Market, By Modality, 2019 vs 2024 (USD Billion)
Figure 17 Short Daily Hemodialysis Segment to Register the Highest CAGR in the Market During the Forecast Period
4.5 Peritoneal Dialysis Market, By Product, 2019 vs 2024 (USD Billion)
Figure 18 Peritoneal Dialysis Concentrates/Dialysate Segment to Dominate the Peritoneal Dialysis Products Market During the Forecast Period
4.6 Peritoneal Dialysis Market, By Modality, 2019 vs 2024 (USD Billion)
Figure 19 Automated Peritoneal Dialysis Segment to Register the Highest CAGR in the Market During the Forecast Period
4.7 Regional Analysis: Hemodialysis & Peritoneal Dialysis Market, By Usage
Figure 20 North America to Dominate the Hemodialysis & Peritoneal Dialysis Market in 2019
4.8 Hemodialysis & Peritoneal Dialysis Market, By Country
Figure 21 India to Witness the Highest CAGR During the Forecast Period (20192024)
5 Market Overview (Page No. - 57)
5.1 Introduction
5.2 Market Dynamics
Figure 22 Hemodialysis and Peritoneal Dialysis Market: Drivers, Restraints, Opportunities, and Challenges
5.2.1 Drivers
5.2.1.1 Increasing Number of ESRD Patients
Figure 23 Number of Patients With Renal Disorders, By Treatment Type
Figure 24 Number of Dialysis Patients, By Region, 2017
5.2.1.2 Growing Prevalence of Diabetes and Hypertension
5.2.1.3 Shortage of Organ Donors and Risks Associated With Transplant
5.2.1.4 Technological Advancements and New Product Launches
5.2.1.5 Rising R&D Expenditure for Developing New Dialysis Products
5.2.2 Restraints
5.2.2.1 Risks and Complications Associated With Dialysis
5.2.2.2 Product Recalls
5.2.2.3 Reimbursement Concerns in Emerging Markets
5.2.2.4 Stringent Regulatory Policies for the Approval and Manufacturing of Dialysis Products
5.2.3 Opportunities
5.2.3.1 Emerging Markets
Figure 25 Emerging Markets Represent A Large Untreated Patient Population
5.2.3.2 Development of User-Friendly and Low-Cost Dialysis Products
5.2.3.3 Increasing Number of Dialysis Centers
5.2.3.4 Growing Preference for Home Hemodialysis (HHD) Treatment
5.2.4 Challenges
5.2.4.1 Benefits of Renal Transplantation
5.2.4.1.1 Low-Cost Solution
5.2.4.1.2 Better Patient Survival Rate
5.2.4.2 Sustainability of Small and Medium-Sized Companies in the Highly Competitive Market
5.3 Industry Trends
5.3.1 Focus on Wearable and Miniature Dialysis Machines
5.3.2 Consolidation of the Dialysis Services Market
Table 1 Prominent Acquisitions in the Dialysis Services Industry (20152017)
5.3.3 Partnerships Among Dialysis Product and Service Providers
5.3.4 Robust Private Equity Activity
5.3.5 Increasing Preference for Private Dialysis Providers
5.4 Reimbursement Scenario
Figure 26 Reimbursement Scenario for Dialysis (2017)
5.4.1 North America
5.4.2 Europe
Figure 27 Level of Reimbursement for HD and PD Across Key Countries in Europe, 2017
Table 2 Dialysis Reimbursement Base Across European Countries
5.4.2.1 Germany
5.4.2.2 France
5.4.2.3 Belgium
5.4.2.4 UK
5.4.2.5 Netherlands
Figure 28 Europe: Variance in Reimbursement Structures
Table 3 Table Reimbursement Per Week for Dialysis Services in European Countries (USD)
5.4.3 Asia Pacific
Figure 29 Dialysis Reimbursement Coverage in Asia Pacific Countries (2015)
5.4.3.1 Asia (Except Japan)
5.4.3.2 Japan
5.4.3.3 Pacific Region
5.5 Regulatory Landscape
Figure 30 Key Regulatory Bodies Involved in the Approval of New Dialysis Products
5.5.1 North America
5.5.1.1 US
5.5.1.2 Canada
5.5.2 Europe
5.5.3 Asia Pacific
5.5.3.1 India
5.5.3.2 China
5.5.3.3 Japan
5.5.3.4 South Korea
5.5.4 Rest of the World
5.5.4.1 Latin America
5.5.4.1.1 Brazil
5.5.4.1.2 Mexico
5.5.4.2 Middle East
5.5.4.3 Africa
6 Hemodialysis Market (Page No. - 86)
6.1 Hemodialysis Market, By Products & Services
6.1.1 Introduction
Table 4 Hemodialysis Market, By Product & Service, 20172024 (USD Billion)
6.1.2 Hemodialysis Services
Table 5 Hemodialysis Services Market, By Type, 20172024 (USD Billion)
Table 6 Hemodialysis Services Market, By Region, 20172024 (USD Billion)
6.1.2.1 In-Center Hemodialysis Services
6.1.2.1.1 Growth in Patient Base and Support for Treatment are Driving the Demand for In-Center Services
Table 7 In-Center Hemodialysis Services Market, By Region, 20172024 (USD Billion)
6.1.2.2 Home Hemodialysis Services
6.1.2.2.1 Poor Reimbursement Scenario for HHD has Hindered Market Growth
Table 8 Home Hemodialysis Services Market, By Region, 20172024 (USD Billion)
6.1.3 Hemodialysis Products
Table 9 Hemodialysis Products Market, By Type, 20172024 (USD Billion)
Table 10 Hemodialysis Products Market, By Region, 20172024 (USD Billion)
6.1.3.1 Hemodialysis Machines
Table 11 Hemodialysis Machines Market, By Type, 20172024 (USD Billion)
Table 12 Hemodialysis Machines Market, By Region, 20172024 (USD Billion)
6.1.3.1.1 Center-Use Hemodialysis Machines
6.1.3.1.1.1 Increasing Number of Renal Care Centers has Ensured A Steady Demand for Center-Use Machines
Table 13 Center-Use Hemodialysis Machines Market, By Region, 20172024 (USD Billion)
6.1.3.1.2 Home-Use Hemodialysis Machines
6.1.3.1.2.1 HHD Machines have Gained Significance Due to Their Improved Clinical Outcomes & Better Quality of Life for Patients
Table 14 Home-Use Hemodialysis Machines Market, By Region, 20172024 (USD Billion)
6.1.3.2 Hemodialysis Consumables & Supplies
Table 15 Hemodialysis Consumables & Supplies Market, By Type, 20172024 (USD Billion)
Table 16 Hemodialysis Consumables & Supplies Market, By Region, 20172024 (USD Billion)
6.1.3.2.1 Dialyzers
Table 17 Dialyzers Market, By Region, 20172024 (USD Billion)
6.1.3.2.2 Dialyzers Market, By Material Type
Table 18 Dialyzers Market, By Material Type, 20172024 (USD Billion)
6.1.3.2.2.1 Synthetic Dialyzers
6.1.3.2.2.1.1 Ease of Sterilization, High Strength, and Resistance of Synthetic Dialyzers Account for Their Wide Use
Table 19 Synthetic Dialyzers Market, By Region, 20172024 (USD Billion)
6.1.3.2.2.2 Cellulose-Based Dialyzers
6.1.3.2.2.2.1 High Biocompatibility and Affordability have Enabled Market Growth
Table 20 Cellulose-Based Dialyzers Market, By Region, 20172024 (USD Billion)
6.1.3.2.3 Dialyzers Market, By Flux Type
Table 21 Dialyzers Market, By Flux Type, 20172024 (USD Billion)
6.1.3.2.3.1 High-Flux Dialyzers
6.1.3.2.3.1.1 High-Flux Dialyzers Can Clear Medium-Sized Molecules and Prevent the Removal of Proteins From the Blood
Table 22 High-Flux Dialyzers Market, By Region, 20172024 (USD Billion)
6.1.3.2.3.2 Low-Flux Dialyzers
6.1.3.2.3.2.1 Capability to Remove Smaller-Sized Molecules have Made Low-Flux Dialyzers Popular
Table 23 Low-Flux Dialyzers Market, By Region, 20172024 (USD Billion)
6.1.3.2.4 Bloodlines
6.1.3.2.4.1 Bloodline Reuse in Emerging Markets is A Key Challenge to the Growth of This Segment
Table 24 Bloodlines Market, By Region, 20172024 (USD Billion)
6.1.3.2.5 Concentrates/Dialysates
6.1.3.2.5.1 Maintaining the Quality of Concentrates is A Key Challenge for Market Players
Table 25 Concentrates/Dialysates Market, By Region, 20172024 (USD Billion)
6.1.3.2.6 Access Products
Table 26 Access Products Market, By Type, 20172024 (USD Billion)
Table 27 Access Products Market, By Region, 20172024 (USD Billion)
6.1.3.2.6.1 AV Fistula Needles
6.1.3.2.6.1.1 AV Fistula Access Provides Better Blood Flow and Lower Risk of Infections
Table 28 Arteriovenous Fistula Needles Market, By Region, 20172024 (USD Billion)
6.1.3.2.6.2 Arteriovenous Grafts
6.1.3.2.6.2.1 Synthetic AV Grafts are More Widely Used Than Their Biological Counterparts Are
Table 29 Arteriovenous Grafts Market, By Region, 20172024 (USD Billion)
6.1.3.2.6.3 Central Venous Catheters
6.1.3.2.6.3.1 Catheters Can Be Used in the Long Term If Grafts and Fistulas are Unsuccessful
Table 30 Central Venous Catheters Market, By Region, 20172024 (USD Billion)
6.1.3.2.7 Other Hemodialysis Consumables
Table 31 Other Hemodialysis Consumables Market, By Region, 20172024 (USD Billion)
6.2 Hemodialysis Market, By Modality
Table 32 Hemodialysis Market, By Modality, 20172024 (USD Billion)
6.2.1 Conventional Long-Term Hemodialysis
6.2.1.1 Technological Advancements and Rising Number of Dialysis Centers are Driving Market Growth
Table 33 Conventional Long-Term Hemodialysis Market, By Region, 20172024 (USD Billion)
6.2.2 Short Daily Hemodialysis
6.2.2.1 Daily HD has Demonstrated Better Outcomes Than Conventional HD
Table 34 Short Daily Hemodialysis Market, By Region, 20172024 (USD Billion)
6.2.3 Nocturnal Hemodialysis
6.2.3.1 Rising Awareness Will Drive Demand for Nhd in the Coming Years
Table 35 Nocturnal Hemodialysis Market, By Region, 20172024 (USD Billion)
6.3 Water Treatment Systems Market, By Type
Table 36 Water Treatment Systems Market, By Type, 20172024 (USD Million)
Table 37 Water Treatment Systems Market, By Region, 20172024 (USD Million)
6.3.1 Central Water Disinfection Systems
Table 38 Central Water Disinfection Systems Market, By Type, 20172024 (USD Million)
Table 39 Central Water Disinfection Systems Market, By Region, 20172024 (USD Million)
6.3.1.1 Chemical Disinfection Systems
6.3.1.1.1 Chemical Disinfection Systems Segment to Dominate the Central Water Disinfection Systems Market During the Forecast Period
Table 40 Central Water Chemical Disinfection Systems Market, By Region, 20172024 (USD Million)
6.3.1.2 Heat Disinfection Systems
6.3.1.2.1 Heat Disinfection Lowers the Labor Costs and Disposal Issues Associated With Disinfection Using Chemicals
Table 41 Central Water Heat Disinfection Systems Market, By Region, 20172024 (USD Million)
6.3.1.3 Accessories
Table 42 Central Water Disinfection System Accessories Market, By Region, 20172024 (USD Million)
6.3.2 Portable Water Disinfection Systems
Table 43 Portable Water Disinfection Systems Market, By Type, 20172024 (USD Million)
Table 44 Portable Water Disinfection Systems Market, By Region, 20172024 (USD Million)
6.3.2.1 Chemical Disinfection Systems
6.3.2.1.1 Development of New Ozone Disinfection Systems With High Safety and Efficacy Profiles to Drive Market Growth
Table 45 Portable Water Chemical Disinfection Systems Market, By Type, 20172024 (USD Million)
6.3.2.2 Heat Disinfection Systems
6.3.2.2.1 Launch of Advanced Portable Heat Disinfection Systems to Drive Market Growth
Table 46 Portable Water Heat Disinfection Systems Market, By Region, 20172024 (USD Million)
6.3.2.3 Accessories
Table 47 Portable Water Disinfection System Accessories Market, By Region, 20172024 (USD Million)
7 Peritoneal Dialysis Market (Page No. - 122)
7.1 Peritoneal Dialysis Market, By Product & Service
7.1.1 Introduction
Table 48 Peritoneal Dialysis Market, By Product & Service, 20172024 (USD Billion)
7.1.2 Products
Table 49 Peritoneal Dialysis Products Market, By Type, 20172024 (USD Billion)
Table 50 Peritoneal Dialysis Products Market, By Region, 20172024 (USD Billion)
7.1.2.1 Peritoneal Dialysis Concentrates/Dialysates
7.1.2.1.1 High Demand for PD Concentrates has Prompted Players to Focus on Improving Their Manufacturing Capabilities for PD Products
Table 51 Peritoneal Dialysis Concentrates/Dialysates Market, By Region, 20172024 (USD Billion)
7.1.2.2 Peritoneal Dialysis Machines
7.1.2.2.1 Emerging Countries are Witnessing Growing Adoption of Home Peritoneal Dialysis Treatments
Table 52 Peritoneal Dialysis Machines Market, By Region, 20172024 (USD Billion)
7.1.2.3 Peritoneal Dialysis Catheters
7.1.2.3.1 Development of New Approaches for PD Catheter Placement is Driving Their Adoption
Table 53 Peritoneal Dialysis Catheters Market, By Region, 20172024 (USD Billion)
7.1.2.4 Peritoneal Dialysis Transfer Sets
7.1.2.4.1 Baxter International and Fresenius Medical Care are the Major Providers of PD Transfer Sets
Table 54 Peritoneal Dialysis Transfer Sets Market, By Region, 20172024 (USD Billion)
7.1.2.5 Other Peritoneal Dialysis Products
Table 55 Other Peritoneal Dialysis Products Market, By Region, 20172024 (USD Billion)
7.1.3 Peritoneal Dialysis Services
7.1.3.1 Self-Administrative Nature of PD Leading to the Slow Growth of the Services Market
Table 56 Peritoneal Dialysis Services Market, By Region, 20172024 (USD Billion)
7.2 Peritoneal Dialysis Market, By Modality
Table 57 Peritoneal Dialysis Market, By Modality, 20172024 (USD Billion)
7.2.1 Continuous Ambulatory Peritoneal Dialysis
7.2.1.1 Capd Offers A Wide Range of Advantages Over APD
Table 58 Continuous Ambulatory Peritoneal Dialysis Market, By Region, 20172024 (USD Billion)
7.2.2 Automated Peritoneal Dialysis
7.2.2.1 Risk of Rapid Decline in Residual Renal Functions With APD to Limit Its Adoption
Table 59 Automated Peritoneal Dialysis Market, By Region, 20172024 (USD Billion)
8 Hemodialysis & Peritoneal Dialysis Market, By Usage (Page No. - 133)
8.1 Introduction
Table 60 Hemodialysis & Peritoneal Dialysis Market, By Usage, 20172024 (USD Billion)
8.2 In-Center Dialysis
Table 61 In-Center Dialysis Market, By Type, 20172024 (USD Billion)
Table 62 In-Center Dialysis Market, By Region, 20172024 (USD Billion)
8.2.1 Hospital Dialysis
8.2.1.1 Increasing Government Support to Develop Dialysis Treatment Facilities in Hospitals to Propel the Growth of This Market Segment
Table 63 Hospital Dialysis Market, By Region, 20172024 (USD Billion)
8.2.2 Independent Dialysis
8.2.2.1 Changing Reimbursement Policies in Developed Countries and A Scarcity of Skilled Nephrologists are Key Restraints for Market Growth
Table 64 Independent In-Center Dialysis Market, By Region, 20172024 (USD Billion)
8.3 Home Dialysis
Table 65 Home Dialysis Market, By Type, 20172024 (USD Billion)
Table 66 Home Dialysis Market, By Region, 20172024 (USD Billion)
8.3.1 Peritoneal Dialysis
8.3.1.1 Technological Improvements, Freedom for Patients to Travel During Treatment, and Fewer Dietary Restrictions are Driving the Growth of the Peritoneal Dialysis Market
Table 67 Peritoneal Dialysis Market, By Region, 20172024 (USD Billion)
8.3.2 Home Hemodialysis (HHD)
8.3.2.1 Advantages Such as A Higher Dose of Dialysis, Improved Quality of Life, and Better Clinical Outcomes are Majorly Responsible for the Growing Demand for HHD Among Patients
Table 68 Home Hemodialysis Market , By Region, 20172024 (USD Billion)
9 Hemodialysis and Peritoneal Dialysis Market, By Region (Page No. - 142)
9.1 Introduction
Table 69 Hemodialysis and Peritoneal Dialysis Market, By Region, 20172024 (USD Billion)
9.2 North America
Figure 31 North America: Hemodialysis and Peritoneal Market Snapshot
Table 70 North America: Hemodialysis and Peritoneal Dialysis Market, By Country, 20172024 (USD Billion)
Table 71 North America: Hemodialysis and Peritoneal Dialysis Market, By Type, 20172024 (USD Billion)
Table 72 North America: Hemodialysis Market, By Product & Service, 20172024 (USD Billion)
Table 73 North America: Hemodialysis Market, By Modality, 20172024 (USD Billion)
Table 74 North America: Water Treatment Systems Market, By Type, 20172024 (USD Million)
Table 75 North America: Peritoneal Dialysis Market, By Product & Service, 20172024 (USD Billion)
Table 76 North America: Peritoneal Dialysis Market, By Modality, 20172024(USD Billion)
Table 77 North America: Hemodialysis and Peritoneal Dialysis Market, By Usage, 20172024(USD Billion)
9.2.1 US
9.2.1.1 Bundled Reimbursement is A Strong Incentive for Dialysis Providers to Encourage the Adoption of Home PD
Table 78 US: Hemodialysis and Peritoneal Dialysis Market, By Type, 20172024 (USD Billion)
Table 79 US: Hemodialysis Market, By Product & Service, 20172024 (USD Billion)
Table 80 US: Peritoneal Dialysis Market, By Product & Service, 20172024 (USD Billion)
9.2.2 Canada
9.2.2.1 The Shortage of Dialysis Facilities is Restraining the Growth of the Market in Canada
Table 81 Canada: Hemodialysis and Peritoneal Dialysis Market, By Type, 20172024 (USD Billion)
Table 82 Canada: Hemodialysis Market, By Product & Service, 20172024 (USD Billion)
Table 83 Canada: Peritoneal Dialysis Market, By Product & Service, 20172024 (USD Billion)
9.3 Europe
Figure 32 Europe: Hemodialysis and Peritoneal Dialysis Market Snapshot
Table 84 Europe: Hemodialysis and Peritoneal Dialysis Market, By Country, 20172024 (USD Billion)
Table 85 Europe: Hemodialysis and Peritoneal Dialysis Market, By Type, 20172024 (USD Billion)
Table 86 Europe: Hemodialysis Market, By Product & Service, 20172024 (USD Billion)
Table 87 Europe: Hemodialysis Market, By Modality, 20172024 (USD Billion)
Table 88 Europe: Water Treatment Systems Market, By Type, 20172024 (USD Million)
Table 89 Europe: Peritoneal Dialysis Market, By Product & Service, 20172024 (USD Billion)
Table 90 Europe: Peritoneal Dialysis Market, By Modality, 20172024 (USD Billion)
Table 91 Europe: Hemodialysis and Peritoneal Dialysis Market, By Usage, 20172024(USD Billion)
9.3.1 Germany
9.3.1.1 Germany is the Only Country in Europe Where PD is Better Reimbursed Than HD
Table 92 Germany: Hemodialysis and Peritoneal Dialysis Market, By Type, 20172024 (USD Billion)
Table 93 Germany: Hemodialysis Market, By Product & Service, 20172024 (USD Billion)
Table 94 Germany: Peritoneal Dialysis Market, By Product & Service, 20172024 (USD Billion)
9.3.2 France
9.3.2.1 High Cost of Dialysis Treatment and Variations in Reimbursement Policies are Restraining Market Growth
Table 95 France: Hemodialysis and Peritoneal Dialysis Market, By Type, 20172024 (USD Billion)
Table 96 France: Hemodialysis Market, By Product & Service, 20172024 (USD Billion)
Table 97 France: Peritoneal Dialysis Market, By Product & Service, 20172024 (USD Billion)
9.3.3 UK
9.3.3.1 The Number of New Dialysis Centers Being Established in the Country is Expected to Drive the Market
Table 98 UK: Hemodialysis and Peritoneal Dialysis Market, By Type, 20172024 (USD Billion)
Table 99 UK: Hemodialysis Market, By Product & Service, 20172024 (USD Billion)
Table 100 UK: Peritoneal Dialysis Market, By Product & Service, 20172024 (USD Billion)
9.3.4 Rest of Europe
Table 101 Rest of Europe: Hemodialysis and Peritoneal Dialysis Market, By Type, 20172024 (USD Billion)
Table 102 Rest of Europe: Hemodialysis Market, By Product & Service, 20172024 (USD Billion)
Table 103 Rest of Europe: Peritoneal Dialysis Market, By Product & Service, 20172024 (USD Billion)
9.4 Asia Pacific
Figure 33 Asia Pacific: Hemodialysis and Peritoneal Dialysis Market Snapshot
Table 104 Asia Pacific: Hemodialysis and Peritoneal Dialysis Market, By Country, 20172024 (USD Billion)
Table 105 Asia Pacific: Hemodialysis and Peritoneal Dialysis Market, By Type, 20172024 (USD Billion)
Table 106 Asia Pacific: Hemodialysis Market, By Product & Service, 20172024 (USD Billion)
Table 107 Asia Pacific: Hemodialysis Market, By Modality, 20172024 (USD Billion)
Table 108 Asia Pacific: Water Treatment Systems Market, By Type, 20172024 (USD Million)
Table 109 Asia Pacific: Peritoneal Dialysis Market, By Product & Service, 20172024 (USD Billion)
Table 110 Asia Pacific: Peritoneal Dialysis Market, By Modality, 20172024 (USD Billion)
Table 111 Asia Pacific: Hemodialysis and Peritoneal Dialysis Market, By Usage, 20172024 (USD Billion)
9.4.1 Japan
9.4.1.1 High Prevalence of ESRD to Support Market Growth in Japan
Table 112 Japan: Hemodialysis and Peritoneal Dialysis Market, By Type, 20172024 (USD Billion)
Table 113 Japan: Hemodialysis Market, By Product & Service, 20172024 (USD Billion)
Table 114 Japan: Peritoneal Dialysis Market, By Product & Service, 20172024 (USD Billion)
9.4.2 China
9.4.2.1 Growing Prevalence of Diabetes and Hypertension to Drive Market Growth
Table 115 China: Hemodialysis and Peritoneal Dialysis Market, By Type, 20172024 (USD Billion)
Table 116 China: Hemodialysis Market, By Product & Service, 20172024 (USD Billion)
Table 117 China: Peritoneal Dialysis Market, By Product & Service, 20172024 (USD Billion)
9.4.3 India
9.4.3.1 India to Register the Highest Growth Rate in the Global Hemodialysis and Peritoneal Dialysis Market During the Study Period
Table 118 India: Hemodialysis and Peritoneal Dialysis Market, By Type, 20172024 (USD Billion)
Table 119 India: Hemodialysis Market, By Product & Service, 20172024 (USD Billion)
Table 120 India: Peritoneal Dialysis Market, By Product & Service, 20172024 (USD Billion)
9.4.4 Rest of Asia Pacific (RoAPAC)
Table 121 RoAPAC: Hemodialysis and Peritoneal Dialysis Market, By Type, 20172024 (USD Billion)
Table 122 RoAPAC: Hemodialysis Market, By Product & Service, 20172024 (USD Billion)
Table 123 RoAPAC: Peritoneal Dialysis Market, By Product & Service, 20172024 (USD Billion)
9.5 Rest of the World
Figure 34 RoW: Hemodialysis and Peritoneal Dialysis Market Snapshot
Table 124 RoW: Hemodialysis and Peritoneal Dialysis Market, By Region, 20172024 (USD Billion)
Table 125 RoW: Hemodialysis and Peritoneal Dialysis Market, By Type, 20172024 (USD Billion)
Table 126 RoW: Hemodialysis Market, By Product & Service, 20172024 (USD Billion)
Table 127 RoW: Hemodialysis Market, By Modality, 20172024 (USD Billion)
Table 128 RoW: Water Treatment Systems Market, By Type, 20172024 (USD Million)
Table 129 RoW: Peritoneal Dialysis Market, By Product & Service, 20172024 (USD Billion)
Table 130 RoW: Peritoneal Dialysis Market, By Modality, 20172024 (USD Billion)
Table 131 RoW: Hemodialysis and Peritoneal Dialysis Market, By Usage, 20172024 (USD Billion)
9.5.1 Latin America
9.5.1.1 Latin America Dominates the Hemodialysis and Peritoneal Dialysis Market in the RoW Due to A Large Number of Dialysis Patients in the Region
Table 132 Latin America: Hemodialysis and Peritoneal Dialysis Market, By Type, 20172024 (USD Billion)
Table 133 Latin America: Hemodialysis Market, By Product & Service, 20172024 (USD Billion)
Table 134 Latin America: Peritoneal Dialysis Market, By Product & Service, 20172024 (USD Billion)
9.5.2 Middle East
9.5.2.1 Increasing Number of ESRD Patients and the Growing Number of Dialysis Centers to Drive Market Growth
Table 135 Middle East: Hemodialysis and Peritoneal Dialysis Market, By Type, 20172024 (USD Billion)
Table 136 Middle East: Hemodialysis Market, By Product & Service, 20172024 (USD Billion)
Table 137 Middle East: Peritoneal Dialysis Market, By Product & Service, 20172024 (USD Billion)
9.5.3 Africa
9.5.3.1 Poor Economic Condition and the High Cost of Dialysis Treatment to Hamper Market Growth
Table 138 Africa: Hemodialysis and Peritoneal Dialysis Market, By Type, 20172024 (USD Billion)
Table 139 Africa: Hemodialysis Market, By Product & Service, 20172024 (USD Billion)
Table 140 Africa: Peritoneal Dialysis Market, By Product & Service, 20172024 (USD Billion)
10 Competitive Landscape (Page No. - 188)
10.1 Introduction
Figure 35 Key Developments By Leading Market Players in the Hemodialysis and Peritoneal Dialysis Market, 20152019
10.2 Market Share Analysis, By Key Player, 2018
Figure 36 Fresenius to Be the Leading Company in the Dialysis Market Due to Its Leadership in All Segments
Figure 37 Global Hemodialysis and Peritoneal Dialysis Market Share, By Key Player, 2018
10.2.1 Key Players in the Hemodialysis Products Market
Figure 38 Global Hemodialysis Products Market Share, By Key Players, 2018
10.2.2 Key Players in the Dialysis Services Market
Figure 39 Top Dialysis Services Providers, By Region, 2018
10.2.3 Key Players in the Peritoneal Dialysis Products Market
Figure 40 Key Players in the Peritoneal Dialysis Products Market, 2018
10.3 Competitive Situation and Trends
10.3.1 Product Launches and Approvals
10.3.2 Expansions
10.3.3 Mergers & Acquisitions
10.3.4 Partnerships, Agreements, and Collaborations
10.4 Vendor Dive Overview
10.5 Vendor Inclusion Criteria
10.6 Vendor Dive
10.6.1 Visionary Leaders
10.6.2 Innovators
10.6.3 Dynamic Differentiators
10.6.4 Emerging Companies
Figure 41 Vendor Dive: Evaluation Overview
10.7 Competitive Intensity: Dialysis Products Market
10.7.1 Evaluation Parameters and Scores
10.7.2 Scoring Methodology
Figure 42 Scoring Methodology
10.7.3 Competitive Intensity Score, By Company
10.7.3.1 Fresenius Medical Care AG & Co. KGaA
10.7.3.2 Baxter International, Inc.
10.7.3.3 B. Braun Melsungen AG
10.7.4 Competitive Intensity - Mapping of Baxter, B. Braun, and Fresenius
Figure 43 Comparison of Competitive Intensity Scores: Fresenius, Baxter, and B. Braun
11 Company Profiles (Page No. - 205)
(Business Overview, Products and Services Offered, Recent Developments, and MnM View)*
11.1 Asahi Kasei Medical Co., Ltd. (A Subsidiary of Asahi Kasei Corporation)
Figure 44 Asahi Kasei Corporation: Company Snapshot (2017)
11.2 Baxter International Inc.
Figure 45 Baxter International Inc.: Company Snapshot (2018)
11.3 B. Braun Melsungen AG
11.3.1 Business Overview
Figure 46 B. Braun Melsungen AG: Company Snapshot (2018)
11.4 Becton, Dickinson and Company
Figure 47 Becton, Dickinson and Company: Company Snapshot (2018)
11.5 Cantel Medical Corporation
Figure 48 Cantel Medical Corporation.: Company Snapshot (2018)
11.6 Davita Inc.
Figure 49 Davita Healthcare Partners Inc.: Company Snapshot (2018)
11.7 Diaverum
11.8 Dialife Group
11.9 Fresenius Medical Care AG & Co. KGaA
Figure 50 Fresenius Medical Care AG & Co. KGaA: Company Snapshot (2018)
11.10 Isopure Corp
11.11 Medtronic PLC
Figure 51 Medtronic PLC: Company Snapshot (2018)
11.12 Nipro Corporation
Figure 52 Nipro Corporation: Company Snapshot (2017)
11.13 Nikkiso Co., Ltd.
Figure 53 Nikkiso Co., Ltd: Company Snapshot (2017)
11.14 Rockwell Medical, Inc.
Figure 54 Rockwell Medical, Inc.: Company Snapshot (2018)
11.15 Toray Medical Co., Ltd.
*Details on Business Overview, Products and Services Offered, Recent Developments, and MnM View Might Not Be Captured in Case of Unlisted Companies.
12 Appendix (Page No. - 247)
12.1 Discussion Guide
12.2 Knowledge Store: Marketsandmarkets Subscription Portal
12.3 Available Customizations
12.4 Related Reports
12.5 Author Details
12.5 Author Details To get more details on this report,
This study involved four major activities to estimate the current size of the hemodialysis and peritoneal dialysis market. Exhaustive secondary research was done to collect information on the market and its different subsegments. The next step was to validate these findings, assumptions, and sizing with industry experts across the value chain through primary research. Both top-down and bottom-up approaches were employed to estimate the complete market size. Thereafter, market breakdown and data triangulation procedures were used to estimate the size of segments and subsegments.
In the secondary research process, various secondary sources, such as annual reports, press releases, and investor presentations of companies; white papers, certified publications, articles by recognized authors, gold-standard & silver-standard websites, and regulatory bodies; and databases such as D&B Hoovers, Bloomberg Business, and Factiva were referred to in order to identify and collect information for this study.
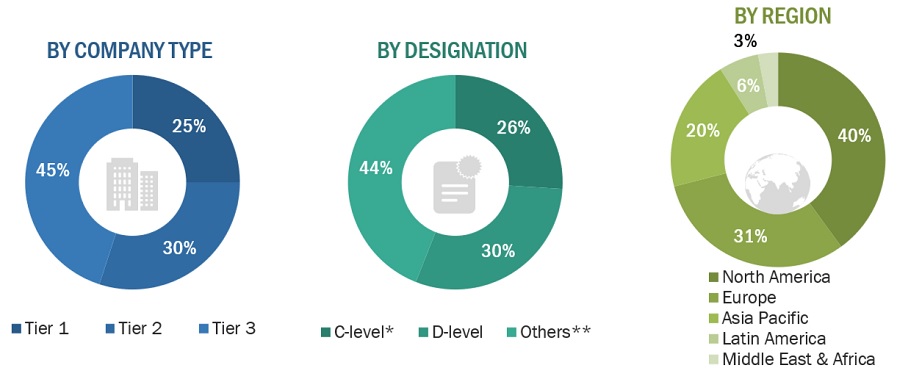
The hemodialysis and peritoneal dialysis market comprises several stakeholders such as dialysis equipment and consumables manufacturing companies, dialysis service providers, nephrologists, dialysis & critical care nurses, hospitals, clinics, and dialysis centers. The demand side of this market is characterized by the increasing awareness about dialysis treatment options and the rising prevalence of ESRD. The supply side is characterized by advancements in technology. Various primary sources from both the supply and demand sides of the market were interviewed to obtain qualitative and quantitative information. The following is the breakdown of primary respondents:
To know about the assumptions considered for the study, download the pdf brochure
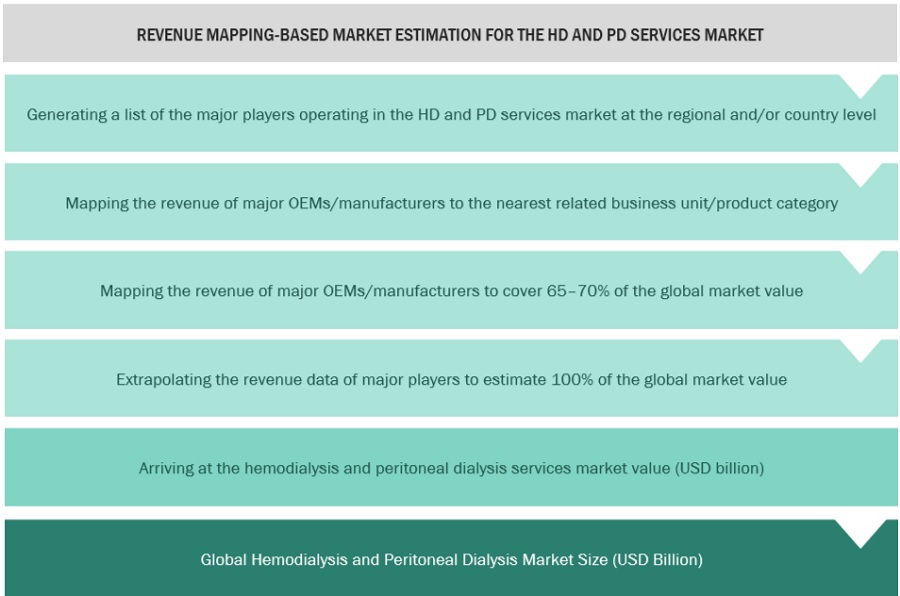
Both top-down and bottom-up approaches were used to estimate and validate the total size of the dialysis (hemodialysis & peritoneal dialysis) market. These methods were also used extensively to estimate the size of various subsegments in the market. The research methodology used to estimate the market size includes the following:
After arriving at the overall market sizeusing the market size estimation processes as explained abovethe market was split into several segments and subsegments. In order to complete the overall market engineering process and arrive at the exact statistics of each market segment and subsegment, data triangulation and market breakdown procedures were employed, wherever applicable. The data was triangulated by studying various factors and trends from both the demand and supply sides in the dialysis industry.
With the given market data, MarketsandMarkets offers customizations as per the companys specific needs. The following customization options are available for the current hemodialysis and peritoneal dialysis market report:
Benchmarking the rapid strategy shifts of the Top 100 companies in the Hemodialysis and Peritoneal Dialysis Market
Request For Special Pricing
Growth opportunities and latent adjacency in Hemodialysis and Peritoneal Dialysis Market
I would like to know opportunities for growth and adopciσn of peritoneal dialysis in Mexico