Coriolis Meters Market by Application (Oil & Gas, Chemicals and Petrochemicals, Food and Beverage, and Others), by Fluid Type (Liquid and Gas) & Geography - Global Trends and Forecast till 2019


[162 Pages Report] Coriolis mass flowmeters measure the mass flow of fluids, such as water, acids, caustic, chemicals, and gases/vapors. These meters can measure the flow with such high accuracy that they are widely used to measure high value products or the introduction of fluids that affect the production of high value products. Since they measure mass flow, the measurement is not affected by fluid density changes. The Coriolis meters is gaining importanceglobally, as the demand for energy is rising, thereby increasing the number of upcoming energy sector projects.
The global Coriolis meters market is segmented on the basis of their applications such as oil & gas, chemicals and petrochemicals, and food and beverages,among others (others include pulp and paper, textiles, water and waste-water treatment industry).They are further segmented on the basis of the usage of the fluid type such as liquid and gas usage. The Coriolis meter market is segmented on the basis of regionsinto North America, Europe, Asia-Pacific, Latin America, the Middle-East, and Africa. Each region has been analyzed with respect to its market trends, growth, and future prospectsin terms of the Coriolis meters market. This report basically aims to estimate the global market for Coriolis meters from 2014 to 2019.
The global Coriolis meters market size is estimated to reach $1,932.5 million by 2019. The major factors responsible driving the growth of this market include the energy sector growth in Asia-Pacific and the Middle East along with, rising investments in oil & gas projects in the said regions.
The Latin American region remains the largest market for Coriolis meters, followed by Middle East, Africa, and Asia-Pacific. The Latin American market continues to be the key growth area due to increasing demand for innovative technology in terms of oil & gas application, which is backed by new investments.
The main concern regarding the Coriolis meters is its high cost of installation and calibration. This has limited the adoption of this technology by high end customerswho can bearits cost.
Coriolis Meters Market Size ($ Million), 2014
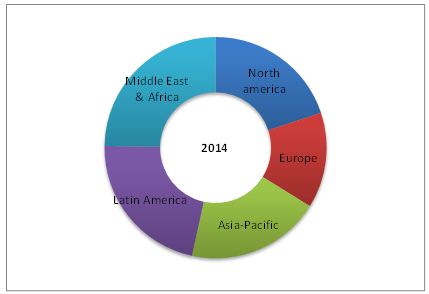
Source: MarketsandMarkets Analysis
The report classifies and defines the market size for Coriolis meters industry. It includes qualitative data about the Coriolis meters used in various applications. The report also provides a comprehensive review of major market drivers, restraints, opportunities, winning imperatives, and key burning issues.
Key players in the industry are profiled in detail along with, their recent developments. Some of them include Emerson Inc. (U.S.), Siemens AG (Germany), Yokogawa Electric Corporation (Japan), ABB Ltd. (Switzerland), and Schneider Electric Co. (France) among others.
Scope of the Report
The research report categorizes the global market for Coriolis meters on the basis of the aforesaid applications, usage, and by region.
- By Application
- Oil and Gas
- Chemicals and Petrochemicals
- Food and Beverages
- Others
- By fluid Type
- Liquid
- Gas
- By Geography
- North America
- Europe
- Asia-Pacific
- Latin America
- Middle East & Africa
The global Coriolis meters market is estimated to reach $1,932.5 million by 2019 at a projected CAGR of 11.04% during the forecast period, indicating a high demand in oil & gas, chemicals & petrochemicals, food & beverages applications. By 2019, the liquid usage market is estimated to reach $1,521.4 million, whereas gas usage market is projected to reach $411.1 million.
Coriolis mass flowmeters measure the mass flow of fluids, such as water, acids, caustic, chemicals, and gases/vapors. These meters can measure the flow with such high accuracy that they are widely used to measure high value products like hydrocarbons or the introduction of fluids that affect the production of high value products. Since they measure mass flow, the measurement is not affected by the changes in fluid density.Major factors driving this market growth include bulk investments in energy sector especially in oil & gas projects.
North American is the largest market for Coriolis meters, followed by Asia-Pacific.The Latin American market continues to be the key growth area due to increasing demand for innovative technology in terms of oil & gas application, which is backed by new investments in the market. The Middle East and Africa is also an exciting market, given the fact of investment.
Coriolis Meters Market Size, by Geography, 2012 - 2019 ($Million)
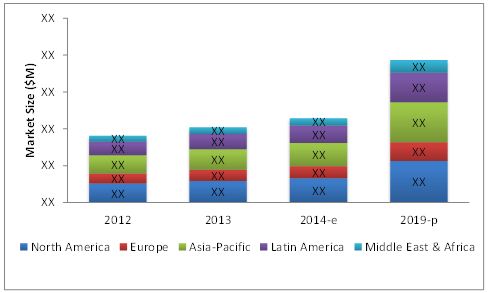
Source: Secondary Literature, Investor Presentations, Expert Interviews, and MarketsandMarkets Analysis
 Exclusive indicates content/data unique to MarketsandMarkets and not available with any competitors.
Table of Content
1. Introduction
1.1. Onjectives of the Study
1.2. Markets Covered
1.3. Stakeholders
1.4. Market Scope
2. Research Methodology
2.1. Introduction
2.2. Market Size Estimation
2.3. Market Crackdown Using Primary and Secondary Sources
2.3.1. Market Crackdown and Data Triangulation
2.4. Market Estimation
2.4.1. Key Data Points From Secondary Sources
2.4.2. Key Data Points Taken From Primary Sources
2.5. Assumptions
3. Executive Summary
4. Premium Insights
4.1. Attractive Market Opportunities in Coriolis Meters Market
4.2. Coriolis Maters Market By Application
4.3. North America and Asia Pacific Regions Command More Than Half of the Market
4.4. Coriolis Meter Market: Developed Vs Developing Nations
4.5. Life Cycle Analysis, By Geography
5. Market Overview
5.1. Introduction
5.2. Evolution
5.3. Coriolis Meters, By Application
5.4. Coriolis Meters, By Type
5.5. Coriolis Meters, By Region
5.6. Market Dynamics
5.6.1. Drivers
5.6.1.1. Energy Sector Projects
5.6.1.2. High Demand From Asia Pacific and Middle East
5.6.1.3. Increasing Demand in Process Industry
5.6.2. Restraints
5.6.2.1. Slow Growth in European Market
5.6.2.2. High Cost
5.6.3. Opportunities
5.6.3.1. Shale Gas and Oil Sands Projects in U.S. & Canada
5.7. Winning Imperatives
5.7.1. Focus on New Technology
5.8. Challenges
5.8.1. Less Presence in Gas Due to Line Size
6. Industry Trends
6.1. Introduction
6.2. Value Chain Analysis
6.3. Supply Chain Analysis
6.4. Porter�s Five forces Model
6.4.1. Threat of Substitutes
6.4.2. Threat of New Entrants
6.4.3. Bargaining Power of Customers
6.4.4. Bargaining Power of Suppliers
6.5. Industry Competition
7. Global Coriolis Meter Market By Fluid Type 2014-2019
7.1. Overview of Market
7.1.1. Gas Usage
7.1.1.1. Global Coriolis Meter Market By Gas Usage
7.1.1.1.1. North America Coriolis Market By Gas Usage
7.1.1.1.2. Europe Coriolis Market By Gas Usage
7.1.1.1.3. Asia-Pacific Coriolis Market By Gas Usage
7.1.1.1.4. Latin America Coriolis Market By Gas Usage
7.1.1.1.5. Middle East & Africa Coriolis Market By Gas Usage
7.2. Liquid Usage
7.2.1. Global Coriolis Meter Market By Liquid Usage
7.2.1.1. North America Coriolis Market By Liquid Usage
7.2.1.2. Europe Coriolis Market By Liquid Usage
7.2.1.3. Asia-Pacific Coriolis Market By Liquid Usage
7.2.1.4. Latin America Coriolis Market By Liquid Usage
7.2.1.5. Middle East & Africa Coriolis Market By Liquid Usage
8. Global Coriolis Meter Market By Application 2014-2019
8.1. Overview of the Market
8.2. Oil & Gas Meters
8.2.1. Global Oil & Gas Meters Market
8.2.2. North America Oil & Gas Meter Market
8.2.3. Europe Oil & Gas Meter Market
8.2.4. Asia-Pacific Oil & Gas Meter Market
8.2.5. Latin America Oil & Gas Meter Market
8.2.6. Middle East & Africa Oil & Gas Meter Market
8.3. Chemicals & Petrochemicals Market
8.3.1. Global Chemicals & Petrochemicals Meters Market
8.3.2. North America Chemicals & Petrochemicals Meter Market
8.3.3. Europe Oil & Gas Meter Market
8.3.4. Asia-Pacificchemicals & Petrochemicals Meter Market
8.3.5. Latin America Chemicals & Petrochemicals Meter Market
8.3.6. Middle East & Africa Chemicals & Petrochemicals Meter Market
8.4. Food & Beverages Market
8.4.1. Global Oil & Gas Meters Market
8.4.2. North America Food & Beverages Meter Market
8.4.3. Europe Food & Beverages Meter Market
8.4.4. Asia-Pacific Food & Beverages Meter Market
8.4.5. Latin America Food & Beverages Meter Market
8.4.6. Middle East & Africa Food & Beverages Meter Market
8.5. Other Applications Market
8.5.1. Global Other Applications Meters Market
8.5.2. North America Other Applications Meter Market
8.5.3. Europe Other Applications Meter Market
8.5.4. Asia-Pacific Other Applications Meter Market
8.5.5. Latin America Other Applications Meter Market
8.5.6. Middle East & Africa Other Applications Meter Market
9. Global Coriolis Meter Market By Geography 2014-2019
9.1. Introduction
9.2. Overview
9.3. Global Coriolis Mater Market By Geography
9.3.1. North America Coriolis Market
9.3.2. Europe Coriolis Market
9.3.3. Asia-Pacific Coriolis Market
9.3.4. Latin America Coriolis Market
9.3.5. Middle East Coriolis Market
9.4. Coriolis Meter Market � Major Countries
9.4.1. By Fluid Type
9.4.1.1. Usa
9.4.1.2. Canada
9.4.1.3. Mexico
9.4.1.4. Norway
9.4.1.5. Russia
9.4.1.6. Italy
9.4.1.7. China
9.4.1.8. India
9.4.1.9. Indonesia & Malaysia
9.4.1.10. Japan
9.4.1.11. Australia & Newzealand
9.4.1.12. Venezuela
9.4.1.13. Brazil
9.4.1.14. Argentina
9.4.1.15. Saudi Arabia
9.4.1.16. Africa
9.4.1.17. Algeria
9.4.2. By Application
9.4.2.1. Usa
9.4.2.2. Canada
9.4.2.3. Russia
9.4.2.4. China
10. Competitive Landscape
10.1. Overview
10.2. Competitive Situation and Trends
10.2.1. New Product Launches
10.2.2. Expansions
10.2.3. Mergers & Acquisitions
10.2.4. Contracts and Agreements
10.2.5. Other Developments
10.2.6. Market Share Analysis
11. Company Profiles
11.1. Ge Measurements and Control
11.1.1. Overview
11.1.2. Products & Services
11.1.3. Financials
11.1.4. Strategy
11.1.5. Developments
11.2. Honeywell
11.2.1. Overview
11.2.2. Products & Services
11.2.3. Financials
11.2.4. Strategy
11.2.5. Developments
11.3. Brooks Instruments (Subsidiary of Illinois tool Works)
11.3.1. Overview
11.3.2. Products & Services
11.3.3. Financials
11.3.4. Strategy
11.3.5. Developments
11.4. Yokogawa Electric Corp
11.4.1. Overview
11.4.2. Products & Services
11.4.3. Financials
11.4.4. Strategy
11.4.5. Developments
11.5. Siemens A.G.
11.5.1. Overview
11.5.2. Products & Services
11.5.3. Financials
11.5.4. Strategy
11.5.5. Developments
11.6. Emerson
11.6.1. Overview
11.6.2. Products & Services
11.6.3. Financials
11.6.4. Strategy
11.6.5. Developments
11.7. ABB Limited
11.7.1. Overview
11.7.2. Products & Services
11.7.3. Financials
11.7.4. Strategy
11.7.5. Developments
11.8. Tricor Coriolis Technology
11.8.1. Overview
11.8.2. Products & Services
11.8.3. Financials
11.8.4. Strategy
11.8.5. Developments
11.9. Foxboro (Invensys) (Schneider)
11.9.1. Overview
11.9.2. Products & Services
11.9.3. Financials
11.9.4. Strategy
11.9.5. Developments
11.10. Fmc Technologies
11.10.1. Overview
11.10.2. Products & Services
11.10.3. Financials
11.10.4. Strategy
11.10.5. Developments
11.11. Liquid Controls(Idex )
11.11.1. Overview
11.11.2. Products & Services
11.11.3. Financials
11.11.4. Strategy
11.11.5. Developments
11.12. Azbil Corporation
11.12.1. Overview
11.12.2. Products & Services
11.12.3. Financials
11.12.4. Strategy
11.12.5. Developments
11.13. Endress + Hauser AG
11.13.1. Overview
11.13.2. Products & Services
11.13.3. Financials
11.13.4. Strategy
11.13.5. Developments
11.14. Krohne Messtechnik Gmbh
11.14.1. Overview
11.14.2. Products & Services
11.14.3. Financials
11.14.4. Strategy
11.14.5. Developments
11.15. Melema Engineering Corp.
11.15.1. Overview
11.15.2. Products & Services
11.15.3. Financials
11.15.4. Strategy
11.15.5. Developments
12. Appendix
12.1. Insights of Industry Experts
12.2. Discussion Guide
12.3. Related Reports
List of Market Tables (75 Tables)
Table 1 Global Coriolis Meter Market Size, By Type,2012-2019 ($Million)
Table 2 Global Coriolis Meter Market Size, By Gas Usage,2012-2019 ($Million)
Table 3 Global Coriolis Meter Market Size, By Liquid Usage,2012-2019 ($Million)
Table 4 Coriolis Meter Market Size, By Fluid Type, North America,2012-2019($Million)
Table 5 Coriolis Meter Market Size, By Fluid Type, Europe,2012-2019($Million)
Table 6 Coriolis Meter Market Size, By Fluid Type, Asia-Pacific,2012-2019 ($Million)
Table 7 Coriolis Meter Market Size, , By Fluid Type, Latin America ,2012-2019($Million)
Table 8 Coriolis Meter Market Size, By Fluid Type, the Middle-East & Africa, 2012-2019 ($Million)
Table 9 Coriolis Meter Market Size, By Gas Usage, North America, 2012-2019 ($Million)
Table 10 Coriolis Meter Market Size, By Gas Usage, Europe, 2012-2019 ($Million)
Table 11 Coriolis Meter Market Size, By Gas Usage, Asia-Pacific, 2012-2019 ($Million)
Table 12 Coriolis Meter Market Size, By Gas Usage, Latin America, 2012-2019 ($Million)
Table 13 Coriolis Meter Market Size, By Gas Usage, Middle East & Africa, 2012-2019 ($Million)
Table 14 Coriolis Meter Market Size, By Liquid Usage, North America, 2012-2019 ($Million)
Table 15 Coriolis Meter Market Size, By Liquid Usage, Europe, 2012-2019 ($Million)
Table 16 Coriolis Meter Market Size, By Liquid Usage, Asia-Pacific, 2012-2019 ($Million)
Table 17 Coriolis Meter Market Size, By Liquid Usage, Latin America, 2012-2019 ($Million)
Table 18 Coriolis Meter Marlet Size, By Liquid Usage, Middle East & Africa, 2012-2019 ($Million)
Table 19 Global Coriolis Meter Market Size, By Application,2012-2019 ($Million)
Table 20 North America Coriolis Meter Market Size, By Application,2012-2019 ($Million)
Table 21 Europe Coriolis Meter Market Size,By Application,2012-2019($Million)
Table 22 Asia-Pacific Coriolis Meter Market Size, By Application, 2012-2019($Million)
Table 23 Latin America Coriolis Meter Market Size, By Application,2012-2019 ($Million)
Table 24 Middle East & Africa Coriolis Meter Market Size, By Application, 2012-2019 ($Million)
Table 25 Global Coriolis Meter Market Size, By Oil & Gas Application, 2012-2019 ($Million)
Table 26 North America Coriolis Meter Market Size, By Oil & Gas Application, 2012-2019 ($Million)
Table 27 Europe Coriolis Meter Market Size, By Oil & Gas Application, 2012-2019 ($Million)
Table 28 Asia-Pacific Coriolis Meter Market Size, By Oil & Gas Application, 2012-2019 ($Million)
Table 29 Latin America Coriolis Meter Market Size, By Oil & Gas Application, 2012-2019 ($Million)
Table 30 Middle East & Africa Coriolis Meter Market Size, By Oil & Gas Application, 2012-2019 ($Million)
Table 31 Global Coriolis Meter Market Size, By Chemicals & Petrochemicals Application, 2012-2019 ($Million)
Table 32 North America Coriolis Meter Market Size, By Chemicals & Petrochemicals Application, 2012-2019 ($Million)
Table 33 Europe Coriolis Meter Market Size, By Chemicals & Petrochemicals Application, 2012-2019 ($Million)
Table 34 Asia-Pacific Coriolis Meter Market Size, By Chemicals & Petrochemicals Application, 2012-2019 ($Million)
Table 35 Latin America Coriolis Meter Market Size, By Chemicals & Petrochemicals Application, 2012-2019 ($Million)
Table 36 Middle East & Africa Coriolis Meter Market Size, By Chemicals & Petrochemicals Application, 2012-2019 ($Million)
Table 37 Global Coriolis Meter Market Size, By Food & Beverages Application, 2012-2019 ($Million)
Table 38 North America Coriolis Meter Market Size, By Food & Beverages Application, 2012-2019 ($Million)
Table 39 Europe Coriolis Meter Market Size, By Food & Beverages Application, 2012-2019 ($Million)
Table 40 Asia-Pacific Coriolis Meter Market Size, By Food & Beverages Application, 2012-2019 ($Million)
Table 41 Latin America Coriolis Meter Market Size, By Food & Beverages Application, 2012-2019 ($Million)
Table 42 Middle East & Africa Coriolis Meter Market Size, By Food & Beverages Application, 2012-2019 ($Million)
Table 43 Global Coriolis Meter Market Size, By Geography, 2012-2019($Million)
Table 44 North America Coriolis Meter Market Size, By Country 2012-2019 ($Million)
Table 45 Europe Coriolis Meter Market Size, By Country 2012-2019 ($Million)
Table 46 Asia Pacific Coriolis Meter Market Size, By Country 2012-2019 ($Million)
Table 47 Latin America Coriolis Meter Market Size, By Country, 2012-2019 ($Million)
Table 48 Middle East & Africa Coriolis Meter Market Size, By Country, 2012-2019 ($Million)
Table 49 U.S. Coriolis Meter Market Size, By Fluid Types, 2012-2019 ($Million)
Table 50 Canada Coriolis Meter Market Size, By Fluid Types,2012-2019 ($Million)
Table 51 Mexico Coriolis Meter Market Size, By Fluid Types,2012-2019 ($Million)
Table 52 U.K. Coriolis Meter Market Size, By Fluid Types, 2012-2019 ($Million)
Table 53 Norway Coriolis Meter Market Size, By Fluid Types, 2012-2019 ($Million)
Table 54 Russia Coriolis Meter Market Size, By Fluid Types,2012-2019 ($Million)
Table 55 Itlay Coriolis Meter Market Size, By Fluid Types, 2012-2019 ($Million)
Table 56 China Coriolis Meter Market Size, By Fluid Types, 2012-2019($Million)
Table 57 India Coriolis Meter Market Size, By Fluid Types, 2012-2019 ($Million)
Table 58 Indonesia & Malaysia Coriolis Meter Market Size, By Fluid Types, 2012-2019 ($Million)
Table 59 Japan Coriolis Meter Market Size, By Fluid Types, 2012-2019 ($Million)
Table 60 Austrlia & New Zealand Coriolis Meter Market Size, By Fluid Types, 2012-2019 ($Million)
Table 61 Venezuela Coriolis Meter Market Size, By Fluid Types, 2012-2019 ($Million)
Table 62 Brazil Coriolis Meter Market Size,By Fluid Types,2012-2019 ($Million)
Table 63 Argentina Coriolis Meter Market Size,By Fluid Types,2012-2019 ($Million)
Table 64 Saudi Arabia Coriolis Meter Market Size, By Fluid Types,2012-2019 ($Million)
Table 65 Africa Coriolis Meter Market Size, By Fluid Types,2012-2019 ($Million)
Table 66 Algeria Coriolis Meter Market Size, By Fluid Types,2012-2019 ($Million)
Table 67 U.S. Coriolis Meter Market Size, By Application, 2012-2019 ($Million)
Table 68 Canada Coriolis Meter Market Size, By Application, 2012-2019 ($Million)
Table 69 Russia Coriolis Meter Market Size, By Application, 2012-2019 ($Million)
Table 70 China Coriolis Meter Market Size,By Application, 2012-2019 ($Million)
Table 71 New Product Launches 2011-2014
Table 72 Expansions 2011-2014
Table 73 Mergers & Acquisitions 2011-2014
Table 74 Contracts & Agreements 2011-2014
Table 75 Other Developments 2011-2014
List of Figures (42 Figures)
Figure 1 Marketcovered: Coriolis Meters
Figure 2 Coriolis Meters Market: Research Methodology
Figure 3 Market Size Estimation Methodology: Bottom-Up Approach
Figure 4 Market Size Estimation Methodology: Top-Down Approach
Figure 5 Data Triangulation Methodology
Figure 6 Coriolis Mater Market Size, By Region, 2012-2019 ($Million)
Figure 7 Coriolis Mater Market Will Continue to Grow Due to their Accuracy in the Measurement for Mass Flow
Figure 8 Oil& Gas Application Market to Grow At A Faster Rate in Coriolis Meter Market
Figure 9 Asia-Pacific Will Remain the Largest and Fastest Growing Market
Figure 10 Developing Economies to Grow Faster Than the Developed Ones
Figure 11 Middle East & Africa Market Soon to Enter High Growth Phase in Coming Years
Figure 12 Market Segmentation By Type, Application, & Region
Figure 13 Market Dynamics
Figure 14 Global Subsea Oil & Gas Capex Spending By Region, 2005-2016
Figure 15 U.S. Oil & Natural Gas Production, 2013
Figure 16 Value Chain Analysis
Figure 17 Supply Chain Analysis
Figure 18 Porters Five force Model
Figure 19 Battle for Market Share: New Product Launches is the Key Strategy
Figure 20 Coriolis Flowmeters Market Share: top 5 Companies Vs Others, 2013
Figure 21 Coriolis Flowmeters Companies Market Share (Value) Analysis, 2013
Figure 22 ABB Limited: Business Overview
Figure 23 ABB Limited: SWOT Analysis
Figure 24 Azbil Group: Business Overview
Figure 25 Emerson Electric Co.: Business Overview
Figure 26 Emerson Electric Co.: SWOT Analysis
Figure 27 Endress+Hauser AG: Business Overview
Figure 28 Fmc Technologies: Business Overview
Figure 29 General Electric: Business Overview
Figure 30 General Electric:SWOT Analysis
Figure 31 Honeywell International Inc.: Business Overview
Figure 32 Idex Corporation: Business Overview
Figure 33 Illinois Tool Works Inc.: Business Overview
Figure 34 Krohne Grou : Business Overview
Figure 35 Malema Engineering Corporation:Business Overview
Figure 36 Schneider Electric Se: Business Overview
Figure 37 Schneider Electric Se: SWOT Analysis
Figure 38 Siemens AG: Business Overview
Figure 39 Siemens AG : SWOT Analysis
Figure 40 Tricor Coriolis Technology: Business Overview
Figure 41 Yokogawa Electric Corp.: Business Overview
Figure 42 Yokogawa Electric Corporations:SWOT Analysis


Growth opportunities and latent adjacency in Coriolis Meters Market