Fluid Handling System Market by Pumps (Centrifugal and Positive Displacement), Control Valves (Rotary and Linear), Flow Meters (Magnetic, Coriolis, Differential Pressure, Ultrasonic), Industry, and Geography - Global Forecast to 2032


Fluid Handling System Market Summary
The global Fluid Handling System Market is experiencing significant expansion as industries accelerate investments in industrial automation, smart manufacturing, and digital process optimization. In 2025, the market size is estimated at approximately USD 72.4 billion and is projected to reach nearly USD 128.6 billion by 2032, registering a CAGR of 8.5% during the forecast period. Increasing demand for energy-efficient pumping systems, advanced valves, intelligent flow control technologies, and automated fluid management infrastructure is driving market growth across manufacturing, oil & gas, pharmaceuticals, food processing, chemicals, semiconductors, and water treatment sectors.
The integration of Artificial Intelligence (AI), Industrial Internet of Things (IIoT), robotics, predictive maintenance software, and cloud-based monitoring systems is transforming the operational efficiency of fluid handling systems. Smart sensors and AI-powered analytics are enabling real-time monitoring of pressure, flow rate, leakage, and system health, reducing downtime and maintenance costs. Rising industrial digitalization, stricter environmental regulations, and growing investments in wastewater treatment and smart factories are further strengthening demand for advanced fluid handling technologies worldwide.
The growing emphasis on sustainable manufacturing and energy conservation has also increased adoption of high-efficiency pumps, automated valves, and intelligent fluid transfer systems. Industries are increasingly prioritizing smart fluid management platforms capable of minimizing resource wastage, optimizing energy consumption, and improving operational safety. Furthermore, rapid infrastructure development in emerging economies and rising adoption of Industry 4.0 technologies continue to create long-term opportunities for market players.
Key Market Trends & Insights
-
North America remains the leading regional market due to strong industrial automation adoption, smart manufacturing investments, and modernization of aging infrastructure.
-
Asia Pacific is expected to witness the fastest growth through 2032 owing to rapid industrialization, urbanization, semiconductor manufacturing growth, and infrastructure expansion.
-
Pumps continue to dominate the product segment because of extensive deployment across chemical, oil & gas, water treatment, and food processing industries.
-
AI-enabled predictive maintenance and cloud-connected monitoring systems are becoming major competitive differentiators in industrial fluid handling operations.
-
Smart valves integrated with IoT sensors are gaining strong traction in energy-efficient industrial process management.
-
Sustainability initiatives and stringent wastewater regulations are accelerating demand for intelligent fluid handling systems in municipal and industrial applications.
Market Size & Forecast
-
Base year market size (2025): USD 72.4 billion
-
Forecast market value (2032): USD 128.6 billion
-
CAGR (2025–2032): 8.5%
-
Growth drivers include industrial automation, AI-based monitoring systems, wastewater management investments, smart factory expansion, and increased energy efficiency requirements.
Fluid Handling System Market Top 10 key takeaway
-
Industrial automation is significantly accelerating global demand for intelligent fluid handling systems.
-
AI-driven predictive maintenance is reducing operational downtime across process industries.
-
Asia Pacific is projected to emerge as the fastest-growing regional market through 2032.
-
Pumps remain the dominant product category due to broad industrial deployment.
-
Smart sensors and IoT-enabled monitoring systems are transforming operational efficiency.
-
Pharmaceutical and semiconductor industries are creating high-value growth opportunities.
-
Sustainability regulations are increasing investments in energy-efficient fluid systems.
-
Cloud-connected fluid monitoring platforms are becoming mainstream in industrial facilities.
-
Water and wastewater treatment applications continue to drive large-scale infrastructure spending.
-
Strategic partnerships and AI integration remain central competitive strategies among leading companies.
Product Insights
The pump segment continues to dominate the Fluid Handling System Market due to its critical role in industrial liquid transfer, pressure control, chemical processing, wastewater management, and oil transportation operations. Centrifugal pumps account for a substantial share because of their high operational efficiency, low maintenance requirements, and widespread deployment across municipal water systems, manufacturing plants, refineries, and energy facilities. Positive displacement pumps are also witnessing growing adoption in industries requiring precise fluid transfer, including pharmaceuticals, food processing, and specialty chemicals.
Valves represent another major product category within the market. Automated control valves equipped with smart sensors are increasingly being deployed to improve process accuracy, reduce leakage risks, and optimize energy consumption. Industries are adopting intelligent valve systems capable of transmitting operational data in real time to centralized industrial management platforms. This shift is particularly prominent in oil & gas, petrochemical, and water treatment facilities where process continuity and safety are critical.
Compressors and filtration systems are also emerging as important product categories. Advanced filtration technologies are becoming essential in semiconductor manufacturing, pharmaceutical production, and food processing industries where contamination control requirements are stringent. Furthermore, smart filtration systems integrated with AI-based monitoring capabilities are helping organizations reduce maintenance cycles and improve process consistency.
The growing popularity of modular fluid handling systems is another notable trend. Manufacturers are increasingly offering compact, scalable, and energy-efficient solutions that can be customized according to industrial requirements. These systems support digital monitoring, automated diagnostics, and remote operational management, making them highly attractive for modern industrial facilities.
AI integration is reshaping product innovation across the market. Smart pumps equipped with predictive analytics software can identify performance anomalies, forecast maintenance needs, and optimize energy consumption. Similarly, intelligent fluid handling platforms are increasingly incorporating digital twin technology to simulate operational conditions and improve process planning.
Technology / Component Insights
Technological innovation is playing a transformative role in the evolution of the Fluid Handling System Market. Industrial Internet of Things (IIoT), artificial intelligence, cloud computing, edge analytics, robotics, and advanced sensor technologies are redefining operational standards across industrial fluid management applications.
IoT-enabled sensors have become essential components in modern fluid handling systems. These sensors continuously monitor parameters such as pressure, temperature, flow rate, viscosity, and leakage conditions. The collected data is transmitted to centralized cloud platforms where AI algorithms analyze system performance and identify operational inefficiencies. This capability enables predictive maintenance strategies that significantly reduce unexpected downtime and maintenance costs.
Artificial intelligence is becoming increasingly important in industrial fluid management. AI-driven analytics platforms can evaluate historical and real-time operational data to optimize pump speed, detect leakage patterns, predict equipment failures, and improve energy efficiency. Manufacturers are leveraging machine learning models to automate fluid control operations and enhance system reliability.
Cloud-based monitoring systems are also gaining traction. Industrial operators are increasingly deploying cloud-connected platforms to monitor distributed fluid infrastructure across multiple facilities. These platforms provide remote access to operational data, maintenance schedules, energy usage statistics, and process optimization recommendations.
Automation technologies are further accelerating market growth. Automated valves, robotic process control systems, and programmable logic controllers (PLCs) are improving production efficiency across chemical plants, food processing units, pharmaceutical manufacturing facilities, and energy infrastructure projects. Robotics-enabled fluid transfer systems are increasingly used in hazardous industrial environments where human exposure must be minimized.
Digital twin technology is expected to emerge as a major innovation trend through 2032. Digital twins allow industrial operators to create virtual simulations of fluid handling infrastructure, enabling predictive diagnostics, operational optimization, and scenario analysis. These capabilities improve asset utilization and reduce operational risks.
Advanced materials technology is another area of innovation. Manufacturers are developing corrosion-resistant materials, lightweight composites, and energy-efficient fluid transfer components capable of operating in extreme industrial conditions. Such advancements are particularly important in offshore oil platforms, chemical processing plants, and semiconductor manufacturing facilities.
Application Insights
The water and wastewater treatment segment represents one of the largest application areas in the Fluid Handling System Market. Rapid urbanization, industrial expansion, and increasing concerns regarding water scarcity are driving substantial investments in smart water management infrastructure globally. Governments and municipalities are increasingly deploying intelligent pumping systems, automated valves, and real-time monitoring technologies to improve water distribution efficiency and reduce leakage losses.
The oil & gas sector also remains a major contributor to market demand. Fluid handling systems play a critical role in upstream, midstream, and downstream operations, including drilling, refining, chemical processing, and pipeline transportation. Rising investments in energy infrastructure modernization and digital oilfield technologies are creating significant growth opportunities for advanced fluid handling solutions.
The pharmaceutical industry is witnessing increasing adoption of hygienic and precision-based fluid handling systems. Strict regulatory standards regarding contamination control, product purity, and process consistency are encouraging pharmaceutical manufacturers to invest in automated fluid transfer systems integrated with AI-powered monitoring technologies.
Food and beverage manufacturing represents another important application segment. Growing demand for packaged foods, beverages, and processed products is increasing deployment of sanitary pumps, filtration systems, and automated fluid transfer technologies. Smart fluid handling systems help manufacturers maintain hygiene standards, improve operational efficiency, and reduce product wastage.
Semiconductor manufacturing is emerging as a high-growth application area due to increasing demand for ultra-pure fluid handling technologies. Semiconductor fabrication facilities require highly precise chemical transfer systems capable of maintaining contamination-free operations. The expansion of AI hardware manufacturing and advanced electronics production is expected to strengthen demand for specialized fluid handling infrastructure.
Chemical processing industries continue to invest heavily in intelligent fluid management systems to improve operational safety, reduce energy consumption, and comply with environmental regulations. Automated control technologies and AI-enabled process optimization platforms are becoming increasingly important in hazardous industrial environments.
Regional Insights
North America remains the largest regional market for fluid handling systems due to strong adoption of industrial automation technologies, advanced manufacturing infrastructure, and high investments in smart industrial systems. The United States dominates regional demand because of large-scale deployment across oil & gas, pharmaceuticals, chemicals, food processing, and water treatment industries. Industrial modernization initiatives and rising adoption of AI-enabled predictive maintenance solutions continue to strengthen market expansion across the region. Canada is witnessing increasing investments in wastewater treatment and energy infrastructure, while Mexico is benefiting from growing manufacturing activities and industrial automation adoption.
Europe represents another major regional market supported by strict environmental regulations, sustainability goals, and industrial digitization strategies. Germany continues to lead the regional market due to its strong industrial manufacturing base and rapid Industry 4.0 implementation. The United Kingdom and France are witnessing increasing adoption of smart fluid management systems in pharmaceuticals, energy, and food processing industries. European Union sustainability initiatives aimed at reducing industrial emissions and improving energy efficiency are encouraging deployment of intelligent fluid infrastructure.
Asia Pacific is expected to register the fastest CAGR through 2032 owing to rapid industrialization, urban population growth, and large-scale infrastructure development. China remains a dominant manufacturing hub with substantial investments in semiconductor production, chemicals, energy, and wastewater treatment infrastructure. Japan is focusing on robotics-enabled industrial automation and smart factory technologies. India is emerging as a key growth market due to expanding manufacturing activities, government infrastructure initiatives, and increasing adoption of automated industrial systems. South Korea and Singapore are also investing heavily in semiconductor manufacturing and smart industrial technologies.
The Middle East and Africa region is witnessing growing demand from oil & gas, desalination, and infrastructure development sectors. Gulf countries are investing in advanced water management systems and smart industrial infrastructure to diversify their economies and improve sustainability.
Latin America is experiencing moderate growth supported by industrial modernization and mining sector investments. Brazil and Mexico continue to represent major regional markets for fluid handling systems.
-
North America leads the market due to strong industrial automation and infrastructure modernization.
-
Asia Pacific is projected to witness the highest growth rate through 2032.
-
Europe benefits from sustainability regulations and Industry 4.0 initiatives.
-
Smart water management projects are accelerating demand across emerging economies.
-
Semiconductor and pharmaceutical industries are driving advanced system adoption globally.
Country-Specific Market Trends
China is projected to grow at a CAGR of approximately 10.2% during the forecast period due to rapid industrial expansion, semiconductor manufacturing investments, and large-scale infrastructure projects. Government-backed smart manufacturing initiatives and wastewater treatment investments continue to strengthen demand for intelligent fluid handling systems.
Japan is expected to register a CAGR of around 7.4% as industries increasingly deploy robotics, AI-driven automation, and smart manufacturing technologies. The country’s advanced electronics and automotive manufacturing sectors are major adopters of precision fluid management systems.
The United States remains the largest country-level market with strong investments in oil & gas modernization, pharmaceutical manufacturing, and industrial AI deployment. The market is expected to grow at a CAGR of nearly 8.1% through 2032.
Canada is witnessing growing adoption of energy-efficient fluid handling systems in mining, wastewater treatment, and energy sectors. Environmental sustainability initiatives are supporting long-term market expansion.
Mexico is emerging as a manufacturing hub for automotive and industrial equipment production, increasing deployment of automated fluid handling technologies.
Germany continues to lead Europe due to extensive Industry 4.0 adoption, advanced manufacturing capabilities, and strong industrial automation investments. The country is expected to maintain stable market growth throughout the forecast period.
France is witnessing rising demand for intelligent fluid systems in pharmaceuticals, food processing, and water treatment industries. Sustainability initiatives and industrial modernization programs continue to support market development.
-
China remains the fastest-growing country market in Asia Pacific.
-
The United States leads global adoption of AI-enabled fluid management systems.
-
Germany dominates Europe through strong industrial automation capabilities.
-
India is emerging as a major growth opportunity due to infrastructure investments.
-
Japan continues to focus on robotics-integrated industrial fluid technologies.
Key Fluid Handling System Market Company Insights
Leading companies operating in the Fluid Handling System Market are focusing heavily on AI integration, smart monitoring platforms, digital process automation, and strategic partnerships to strengthen their market positions. Companies are investing significantly in research and development activities to introduce energy-efficient, cloud-connected, and predictive maintenance-enabled fluid handling solutions.
Xylem Inc. continues to strengthen its smart water infrastructure portfolio through digital monitoring technologies and AI-powered water analytics platforms. Flowserve Corporation is focusing on intelligent pumping solutions integrated with predictive maintenance capabilities. Grundfos is investing heavily in energy-efficient pumping systems and smart building technologies.
Emerson Electric Co. remains a major player in industrial automation and fluid control technologies, offering AI-enabled monitoring platforms and intelligent valve systems. Alfa Laval is expanding its advanced fluid transfer and filtration technologies for food processing and pharmaceutical applications. Pentair plc is strengthening its smart water management and filtration system portfolio.
Honeywell International Inc. is integrating industrial IoT and AI technologies into advanced process management platforms. Sulzer Ltd. is focusing on high-efficiency pumps and digital service solutions for industrial applications. Parker Hannifin Corporation continues to expand its motion and fluid control technology capabilities across aerospace, industrial, and energy sectors.
Strategic acquisitions, automation-focused product launches, and cloud-based service platforms remain common competitive strategies across the industry. Companies are also prioritizing sustainability initiatives and energy-efficient product development to align with evolving environmental regulations.
-
Companies are prioritizing AI-enabled predictive maintenance technologies.
-
Strategic partnerships are accelerating smart fluid management innovation.
-
Energy-efficient product development remains a major competitive focus.
-
Cloud-connected monitoring platforms are becoming standard offerings.
-
Sustainability and digitalization continue to shape long-term business strategies.
Recent Developments
-
In 2025, a major industrial automation company launched an AI-powered smart pump monitoring platform capable of reducing maintenance downtime by nearly 30% through predictive diagnostics.
-
In 2026, a leading fluid technology manufacturer partnered with a cloud analytics provider to develop IoT-enabled industrial fluid management solutions for smart factories.
-
In 2027, an international water infrastructure company introduced next-generation energy-efficient wastewater pumping systems integrated with advanced digital twin capabilities.
Market Segmentation
The Fluid Handling System Market is segmented based on product, technology/component, application, and region. By product, the market includes pumps, valves, compressors, filters, flow meters, and fluid transfer systems. Pumps continue to dominate due to extensive industrial deployment and operational importance across water management, chemicals, pharmaceuticals, and energy sectors.
By technology/component, the market includes AI-enabled monitoring systems, IoT sensors, cloud analytics platforms, automation controllers, robotics-enabled systems, and predictive maintenance software. Industrial IoT and AI analytics platforms are witnessing particularly strong demand due to increasing focus on operational optimization and maintenance efficiency.
By application, the market covers water and wastewater treatment, oil & gas, pharmaceuticals, chemicals, food & beverage, semiconductors, power generation, and manufacturing industries. Water treatment and industrial manufacturing remain the largest application areas due to rising infrastructure investments and automation adoption.
By region, the market is segmented into North America, Europe, Asia Pacific, Latin America, and Middle East & Africa. North America currently leads the market while Asia Pacific is expected to register the fastest growth through the forecast period.
-
Pumps represent the dominant product segment globally.
-
AI and IoT technologies are transforming industrial fluid management.
-
Water treatment remains the leading application segment.
-
Asia Pacific is projected to witness the highest regional CAGR.
-
Semiconductor and pharmaceutical industries are emerging high-growth verticals.
Conclusion
The Fluid Handling System Market is poised for strong long-term growth as industrial sectors increasingly prioritize automation, energy efficiency, predictive maintenance, and smart manufacturing technologies. The integration of artificial intelligence, industrial IoT, cloud computing, and digital twin platforms is fundamentally transforming the operational capabilities of fluid handling infrastructure across industries.
Rising investments in wastewater treatment, semiconductor manufacturing, pharmaceutical production, and industrial modernization are expected to create substantial growth opportunities through 2032. North America is expected to maintain its leadership position due to advanced industrial infrastructure and strong AI adoption, while Asia Pacific will continue emerging as the fastest-growing regional market.
As businesses focus on sustainability, operational efficiency, and digital transformation, intelligent fluid handling systems will become increasingly essential for industrial competitiveness. Companies capable of delivering AI-powered, energy-efficient, and cloud-connected solutions are expected to gain significant market advantages during the forecast period.
FAQs
1. What is the current size of the Fluid Handling System Market?
The Fluid Handling System Market is estimated at approximately USD 72.4 billion in 2025.
2. What is the projected growth rate of the market?
The market is projected to grow at a CAGR of 8.5% between 2025 and 2032.
3. What are the key drivers of market growth?
Major growth drivers include industrial automation, AI integration, smart manufacturing adoption, wastewater treatment investments, and increasing demand for energy-efficient systems.
4. Which region leads the Fluid Handling System Market?
North America currently leads the market due to strong industrial automation adoption and advanced manufacturing infrastructure.
5. Which companies are major players in the market?
Key companies include Xylem Inc., Flowserve Corporation, Grundfos, Emerson Electric Co., Alfa Laval, Pentair plc, Honeywell International Inc., Sulzer Ltd., and Parker Hannifin Corporation.
 Exclusive indicates content/data unique to MarketsandMarkets and not available with any competitors.
Table of Contents
1 Introduction (Page No. - 16)
1.1 Study Objectives
1.2 Definition
1.3 Study Scope
1.3.1 Markets Covered
1.3.2 Geographic Scope
1.3.3 Years Considered for the Study
1.4 Currency
1.5 Limitations
1.6 Stakeholders
2 Research Methodology (Page No. - 20)
2.1 Research Data
2.2 Value Chain Analysis: Industrial Automation Industry
2.3 Secondary and Primary Research
2.3.1 Secondary Data
2.3.1.1 Secondary Sources
2.3.2 Primary Data
2.3.2.1 Primary Interviews With Experts
2.3.2.2 Key Industry Insights
2.3.2.3 Breakdown of Primaries
2.3.2.4 Key Data From Primary Sources
2.4 Market Size Estimation
2.4.1 Bottom-Up Approach
2.4.1.1 Approach for Capturing Market Share By Bottom-Up Analysis (Demand Side)
2.4.2 Top-Down Approach
2.4.2.1 Approach for Capturing Market Share By Top-Down Analysis (Supply Side)
2.5 Market Breakdown and Data Triangulation
2.6 Research Assumptions
3 Executive Summary (Page No. - 32)
4 Premium Insights (Page No. - 36)
4.1 Market, 2017–2023 (USD Billion)
4.2 Control Valves in Fluid Handling Systems, By Type (2017-2023)
4.3 System Market for Pumps, By Type (2017)
4.4 North American Fluid Handling System Market, By Hardware and Country (2017)
4.5 Market, By Geography (2017)
5 Market Overview (Page No. - 40)
5.1 Introduction
5.2 Market Dynamics
5.2.1 Drivers
5.2.1.1 Increasing Demand for Different Types of Pumps in the Oil and Gas Industry
5.2.1.2 Growing Need for Advanced Systems in the Chemical and Wastewater Management Industries
5.2.1.3 Rising Focus on Plant Automation
5.2.2 Restraints
5.2.2.1 High Investment and Operational Costs of Fluid Handling Systems
5.2.3 Opportunities
5.2.3.1 Integration of Iiot With Fluid Handling Systems
5.2.4 Challenges
5.2.4.1 Tough Competition From Local Manufacturers
5.3 Value Chain Analysis
6 Services and IoT Solutions for Fluid Handling Systems (Page No. - 45)
6.1 Introduction : Services for Fluid Handling Systems
6.1.1 Installation and Commissioning
6.1.2 Maintenance
6.1.3 Support
6.1.4 Replacement and Retrofit
6.2 Introduction: IoT Solutions for Fluid Handling Systems
6.2.1 Sensors
6.2.2 Remote Monitoring
6.2.3 Predictive and Preventive Maintenance
7 Pump Based Fluid Handling System Market, By Type (Page No. - 49)
7.1 Introduction
7.2 Centrifugal Pumps
7.2.1 Advantages of Centrifugal Pumps
7.3 Positive Displacement Pump
7.3.1 Advantages of Positive Displacement Pumps
8 Control Valve Based Fluid Handling System Market, By Type (Page No. - 58)
8.1 Introduction
8.2 Rotary Valve
8.2.1 Ball Valves
8.2.2 Butterfly Valves
8.2.3 Plug Valves
8.3 Linear Valves
8.3.1 Gate Valves
8.3.2 Diaphragm Valves
8.3.3 Other Valves
9 Flow Meter Based Fluid Handling System Market, By Type (Page No. - 68)
9.1 Introduction
9.2 Magnetic Flow Meters
9.3 Coriolis
9.4 Ultrasonic
9.5 Vortex
9.6 Multiphase
9.7 Thermal
9.8 Variable Area
9.9 Differential Pressure
9.10 Turbine
10 Market Analysis, By Industry (Page No. - 77)
10.1 Introduction
10.2 Oil and Gas
10.3 Water and Wastewater
10.4 Chemical
10.5 Energy and Power
10.6 Food and Beverages
10.7 Pulp and Paper
10.8 Metal and Mining
10.9 Pharmaceutical
10.10 Building and Construction
10.11 Others
11 Geographic Analysis (Page No. - 92)
11.1 Introduction
11.2 North America
11.2.1 US
11.2.1.1 Increasing Investment in the Chemical, and Water and Wastewater Industries
11.2.2 Canada
11.2.2.1 Favorable Government Regulations and Development in Various End-User Industries
11.2.3 Mexico
11.3 Europe
11.3.1 UK
11.3.1.1 Increasing Demand From Various Industries
11.3.2 Germany
11.3.2.1 Events and Conferences Related to Fluid Handling Systems
11.3.3 France
11.3.3.1 Increasing Government Initiatives and Support
11.3.4 Rest of Europe
11.4 APAC
11.4.1 China
11.4.1.1 Favorable Government Policies and Increasing Investment
11.4.2 Japan
11.4.2.1 Increasing Demand From the Water and Wastewater and Building and Construction Industries
11.4.3 India
11.4.3.1 Rapid Industrialization and Infrastructural Development in the Country
11.4.4 Rest of APAC
11.5 RoW
11.5.1 South America
11.5.2 Middle East
11.5.3 Africa
12 Competitive Landscape (Page No. - 117)
12.1 Overview
12.2 Market Ranking Analysis: Fluid Handling System Market, 2016
12.3 Competitive Situation and Trends
12.3.1 New Product Launches and Developments
12.3.2 Expansions and Acquisitions
12.3.3 Contracts
13 Company Profiles (Page No. - 123)
(Business Overview, Products Offered, Strength of product Portfolio, Business Strategy Excellence, Recent Developments, Key Relationships)*
13.1 Introduction
13.2 Alfa Laval
13.3 Colfax
13.4 Crane
13.5 Graco
13.6 Flowserve
13.7 Ingersoll-Rand
13.8 IDEX
13.9 SPX Flow
13.10 Dover
13.11 Bürkert
*Details on Business Overview, Products Offered, Strength of product Portfolio, Business Strategy Excellence, Recent Developments, Key Relationships might not be captured in case of unlisted companies.
13.12 Key Innovators
13.12.1 Fluid Global Solutions
13.12.2 Alpeco
13.12.3 Ebara International
14 Appendix (Page No. - 155)
14.1 Insights of Industry Experts
14.2 Discussion Guide
14.3 Knowledge Store: Marketsandmarkets’ Subscription Portal
14.4 Introducing RT: Real-Time Market Intelligence
14.5 Available Customizations
14.6 Related Reports
14.7 Author Details
List of Tables (69 Tables)
Table 1 Major Secondary Sources
Table 2 Fluid Handling System Market for Pumps, in Terms of Value and Volume, 2014–2023
Table 3 Market for Pumps, By Type, 2014–2023 (USD Billion)
Table 4 Market for Pumps, By Industry, 2014–2023 (USD Billion)
Table 5 Market for Pumps, By Region, 2014–2023 (USD Billion)
Table 6 Market for Pumps in North America, By Country, 2014–2023 (USD Million)
Table 7 Market for Pumps in Europe, By Country, 2014–2023 (USD Million)
Table 8 Market for Pumps in APAC, By Country, 2014–2023 (USD Million)
Table 9 Market for Pumps in RoW, By Region, 2014–2023 (USD Million)
Table 10 Market for Centrifugal Pumps, By Industry, 2014–2023 (USD Million)
Table 11 Market for Positive Displacement Pumps, By Industry, 2014–2023 (USD Million)
Table 12 Market for Control Valves, in Terms of Value and Volume, 2014–2023
Table 13 Market for Control Valves, By Valve Type, 2014–2023 (USD Billion)
Table 14 Market for Control Valves, By Industry, 2014–2023 (USD Million)
Table 15 Market for Control Valves, By Region, 2014–2023 (USD Million)
Table 16 Market for Control Valves in North America, By Country, 2014–2023 (USD Million)
Table 17 Market for Control Valves in Europe, By Country, 2014–2023 (USD Million)
Table 18 Market for Control Valves in APAC, By Country, 2014–2023 (USD Million)
Table 19 Market for Control Valves in RoW, By Region, 2014–2023 (USD Million)
Table 20 Fluid Handling System Market for Rotary Valves, By Type, 2014–2023 (USD Million)
Table 21 Market for Rotary Valve, By Industry, 2014–2023 (USD Million)
Table 22 Market for Linear Valves, By Type, 2014–2023 (USD Million)
Table 23 Market for Linear Valves, By Industry, 2014–2023, (USD Million)
Table 24 Market for Flow Meters, in Terms of Value and Volume, 2014–2023
Table 25 Market for Flow Meters, By Type, 2014–2023 (USD Million)
Table 26 Market for Flow Meters, By Industry, 2014–2023 (USD Million)
Table 27 Market for Flow Meters, By Region, 2014–2023 (USD Million)
Table 28 Market for Flow Meters in North America, By Country, 2014–2023 (USD Million)
Table 29 Market for Flow Meters in Europe, By Country, 2014–2023 (USD Million)
Table 30 Market for Flow Meters in APAC, By Country, 2014–2023 (USD Million)
Table 31 Market for Flow Meters in RoW, By Region, 2014–2023 (USD Million)
Table 32 Market, By Industry, 2014–2023 (USD Million)
Table 33 Market for Oil and Gas, By Hardware, 2014–2023 (USD Million)
Table 34 Market for Water and Wastewater, By Hardware, 2014–2023 (USD Million)
Table 35 Market for Chemical, By Hardware, 2014–2023 (USD Million)
Table 36 Market for Energy and Power, By Hardware, 2014–2023 (USD Million)
Table 37 Market for Food and Beverages, By Hardware, 2014–2023 (USD Million)
Table 38 Market for Pulp and Paper, By Hardware, 2014–2023 (USD Million)
Table 39 Market for Metal and Mining, By Hardware, 2014–2023 (USD Million)
Table 40 Market for Pharmaceutical, By Hardware, 2014–2023 (USD Million)
Table 41 Market for Building and Construction, By Hardware, 2014–2023 (USD Million)
Table 42 Market for Other Industries, By Hardware, 2014–2023 (USD Million)
Table 43 Market, By Region, 2014–2023 (USD Billion)
Table 44 Market in North America, By Hardware, 2014–2023 (USD Billion)
Table 45 Market in North America, By Country, 2014–2023 (USD Million)
Table 46 Market in US, By Hardware, 2014–2023 (USD Million)
Table 47 Market in Canada, By Hardware, 2014–2023 (USD Million)
Table 48 Market in Mexico, By Hardware, 2014–2023 (USD Million)
Table 49 Market in Europe, By Hardware, 2014–2023 (USD Million)
Table 50 Market in Europe, By Country, 2014–2023 (USD Billion)
Table 51 Market in UK, By Hardware, 2014–2023 (USD Million)
Table 52 Market in Germany, By Hardware, 2014–2023 (USD Million)
Table 53 Market in France, By Hardware, 2014–2023 (USD Million)
Table 54 Market in Rest of Europe, By Hardware, 2014–2023 (USD Million)
Table 55 Fluid Handling System Market in APAC, By Hardware, 2014–2023 (USD Billion)
Table 56 Market in APAC, By Country, 2014–2023 (USD Billion)
Table 57 Market in China, By Hardware, 2014–2023 (USD Million)
Table 58 Market in Japan, By Hardware, 2014–2023 (USD Million)
Table 59 System Market in India, By Hardware, 2014–2023 (USD Million)
Table 60 Market in Rest of APAC, By Hardware, 2014–2023 (USD Million)
Table 61 Market in RoW, By Hardware, 2014–2023 (USD Million)
Table 62 Market in RoW, By Region, 2014–2023 (USD Million)
Table 63 Market in South America, By Hardware, 2014–2023 (USD Million)
Table 64 Market in Middle East, By Hardware, 2014–2023 (USD Million)
Table 65 Market in Africa, By Hardware, 2014–2023 (USD Million)
Table 66 Market Ranking of Leading Manufacturers of Fluid Handling System, 2016
Table 67 New Product Launches and Developments
Table 68 Expansions and Acquisitions
Table 69 Contracts
List of Figures (61 Figures)
Figure 1 Fluid Handling System Market Segmentation
Figure 2 Market: Research Design
Figure 3 Value Chain: Industrial Automation
Figure 4 Bottom-Up Approach to Arrive at the Market Size
Figure 5 Top-Down Approach to Arrive at the Market Size
Figure 6 Data Triangulation
Figure 7 Market for Pumps Expected to Remain Dominant During the Forecast Period
Figure 8 Market for Plug Valves to Register the Highest CAGR Between 2017 and 2023
Figure 9 Market for Building and Construction Industry Expected to Grow at the Highest CAGR Between 2017 and 2023
Figure 10 APAC Expected to Hold the Largest Share of the Market During the Forecast Period
Figure 11 High Demand for Advanced Systems in Chemical and Wastewater Management Industries Expected to Drive the Growth of the Market
Figure 12 Market for Rotary Valves Expected to Grow at the Highest CAGR Between 2017 and 2023
Figure 13 Centrifugal Pumps Expected to Lead the Market Between 2017 and 2023
Figure 14 Pumps to Hold the Largest Share of the Market in North America in 2017
Figure 15 US Expected to Hold the Largest Size of the Market in 2017
Figure 16 Drivers, Restraints, Opportunities, and Challenges
Figure 17 Value Chain Analysis: Maximum Value Added During Manufacturing and Assembly Stage
Figure 18 Services for Fluid Handling Systems
Figure 19 IoT Solutions for Fluid Handling Systems
Figure 20 Market for Pumps in APAC Expected to Register the Highest CAGR Between 2017 and 2023
Figure 21 China to Dominate the Market for Pumps in APAC Throughout the Forecast Period
Figure 22 Water and Wastewater Industry Expected to Lead the Market for Centrifugal Pumps
Figure 23 Water and Wastewater Industry to Witness the Highest Growth in the Market for Positive Displacement Pumps Between 2017 and 2023
Figure 24 Ball Valves to Lead the Market for Control Valves Throughout the Forecast Period
Figure 25 Gate Valves to Dominate the Market for Linear Valves Throughout the Forecast Period
Figure 26 Chemical Industry to Witness the Highest Growth in the Market for Flow Meters During the Forecast Period
Figure 27 APAC to Lead the Market for Flow Meters During the Forecast Period
Figure 28 Germany to Register the Highest CAGR in the Market for Flow Meters in Europe Between 2017 and 2023
Figure 29 Market for Flow Meter in South America to Grow at A Higher CAGR in the RoW Region During the Forecast Period
Figure 30 The Market for Water and Wastewater Industry to Remain Dominant Throughout the Forecast Period
Figure 31 Pumps to Dominate the Market for the Oil and Gas Industry Throughout the Forecast Period
Figure 32 Market for Flow Meters in the Chemical Industry to Witness the Highest CAGR Between 2017 and 2023
Figure 33 Control Valve Market for the Food and Beverages Industry to Register the Highest Growth Rate During the Forecast Period
Figure 34 Market for Flow Meters for the Metal and Mining Industry to Witness A Higher Growth Rate Between 2017 and 2023
Figure 35 Pumps to Hold the Larger Market Size for the Building and Construction Industry Throughout the Forecast Period
Figure 36 The Market for Control Valves to Remain Dominant Throughout the Forecast Period
Figure 37 Geographic Snapshot: Global Market
Figure 38 North America: Market Snapshot
Figure 39 US Expected to Lead the Market in North America During the Forecast Period
Figure 40 Control Valves to Witness the Highest Growth Rate in the Fluid Handling Market in Canada
Figure 41 Europe: Market Snapshot
Figure 42 Germany to Witness the Highest Growth Rate in the Market in Europe Between 2017 and 2023
Figure 43 Pumps to Dominate the Fluid Handling Market in Germany Throughout the Forecast Period
Figure 44 APAC: Market Snapshot
Figure 45 China Expected to Dominate the Market During the Forecast Period
Figure 46 Pumps to Dominate the Market in Japan Throughout the Forecast Period
Figure 47 Pumps to Dominate the Market in Rest of APAC Throughout the Forecast Period
Figure 48 Middle East Expected to Dominate the Market in the RoW Region Throughout the Forecast Period
Figure 49 Pumps to Witness the Highest CAGR in the Market in the Middle East Between 2017 and 2023
Figure 50 New Product Launches and Developments—Key Growth Strategies Adopted By Fluid Handling Market Players Between 2015 and 2017
Figure 51 Market Evolution Framework: New Product Launches and Developments Fueled the Growth of the Market (2015–2017)
Figure 52 Battle for Market Share: New Product Launches and Developments Were Key Strategies Adopted By Players
Figure 53 Alfa Laval: Company Snapshot
Figure 54 Colfax: Company Snapshot
Figure 55 Crane : Company Snapshot
Figure 56 Graco Inc.: Company Snapshot
Figure 57 Flowserve: Company Snapshot
Figure 58 Ingersoll-Rand : Company Snapshot
Figure 59 IDEX: Company Snapshot
Figure 60 SPX Flow: Company Snapshot
Figure 61 Dover : Company Snapshot
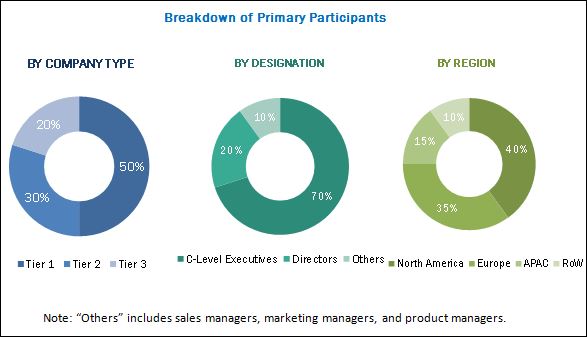
The research methodology used to estimate and forecast the market begins with capturing data on the revenue of key vendors through secondary research. Vendor offerings have also been taken into consideration to determine the market segmentation. The bottom-up procedure has been employed to arrive at the overall size of the market from the revenues of key players. After arriving at the overall market size, the total market size has been split into several segments and subsegments, which have then been verified through primary research by conducting extensive interviews with key experts such as CEOs, VPs, directors, and executives. The market breakdown and data triangulation procedures have been employed to complete the overall market engineering process and arrive at the exact statistics for all segments and subsegments. The breakdown of the profiles of primaries is depicted in the below figure.
To know about the assumptions considered for the study, download the pdf brochure
The fluid handling market ecosystem comprises raw material suppliers, component manufacturers, system integrators, and distributors. Alfa Laval AB (Sweden), Colfax Corporation (US), Crane Co. (US), Flowserve Corporation (US), and Graco Inc. (US) are among the leading players in the fluid handling system market. Other key players in the market include Bürkert GmbH & Co. KG (Germany), Dover Corporation (US), INDEX Corporation (US), Ingersoll-Rand plc (Ireland), and SPX Flow, Inc. (US).
Key Target Audience
- Associations and industrial bodies
- Component suppliers and distributors
- End users of fluid handling systems across industries
- Government bodies such as regulatory authorities and policymakers
- Industrial automation equipment providers
- Market research and consulting firms
- Original equipment manufacturers (OEMs)
- Semiconductor product designers and fabricators
“This study answers several questions for the stakeholders, primarily which market segments to focus on in the next 2–5 years for prioritizing efforts and investments.”
Scope of the Report
This research report categorizes the market on the basis of pump, flow meter, control valve, industry, and geography.
Fluid Handling System Market, by Pump
- Centrifugal Pumps
- Positive Displacement Pumps
Market, by Flow Meter
- Magnetic
- Coriolis
- Differential Pressure
- Ultrasonic
- Vortex
- Turbine
- Thermal
- Multiphase
- Variable Area
Market, by Control Valve
-
Linear Valve
- Gate Valve
- Diaphragm Valve
- Other Valves
-
Rotary Valve
- Ball Valves
- Butterfly Valves
- Plug Valves
Market, by Industry
- Oil and Gas
- Water and Wastewater
- Energy and Power
- Pharmaceutical
- Food and Beverage
- Chemical
- Building and Construction
- Pulp and paper
- Metal and Mining
- Others
Fluid Handling System Market, by Geography
- North America
- Europe
- Asia Pacific (APAC)
- Rest of the World (RoW)
Available Customizations:
With the given market data, MarketsandMarkets offers customizations according to the company’s specific needs. The following customization options are available for the report:
Company Information:
Detailed analysis and profiling of additional market players (up to 5)


Growth opportunities and latent adjacency in Fluid Handling System Market