The study involved four major activities in estimating the market size for flow meter market. Intensive secondary research was done to gather information on the market, the peer market, and the parent market. The next step was to validate these findings, assumptions, and sizing with industry experts across the value chain through primary research. Both top-down and bottom-up approaches were employed to estimate the complete market size. Post that, the market breakdown and data triangulation procedures were used to estimate the market size of the segments and subsegments.
Secondary Research
Secondary sources used in this study included annual reports, press releases, and investor presentations of companies; white papers; certified publications; articles from recognized authors; and gold standard & silver standard websites such as Factiva, ICIS, Bloomberg, and others. The findings of this study were verified through primary research by conducting extensive interviews with key officials such as CEOs, VPs, directors, and other executives. The breakdown of profiles of the primary interviewees is illustrated in the figure below:
Primary Research
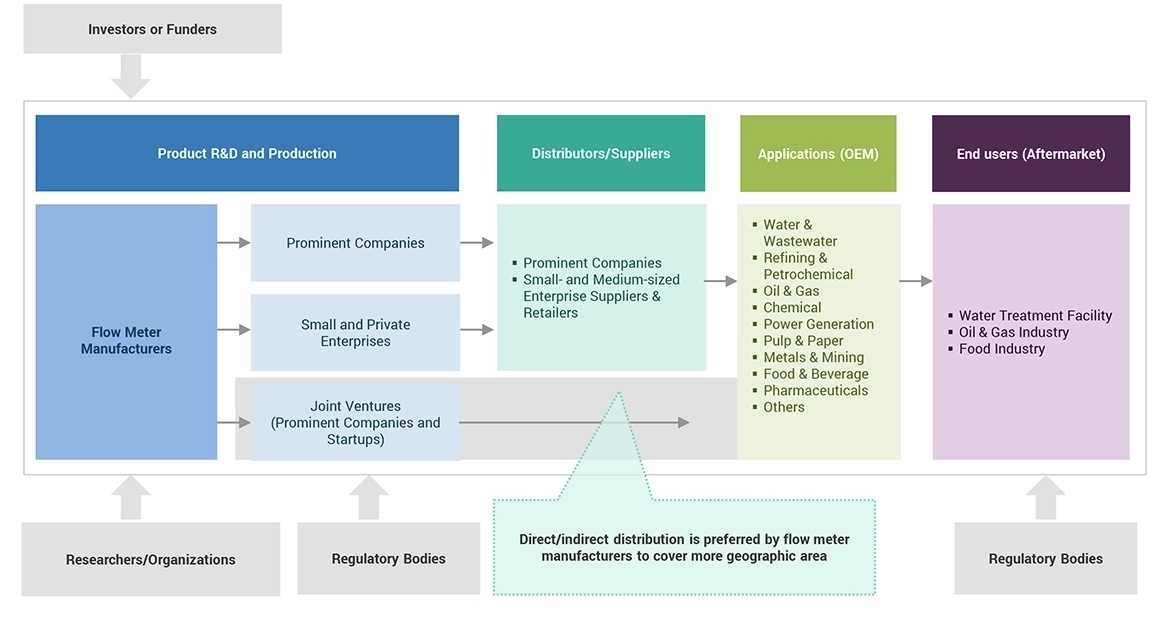
The flow meter market comprises several stakeholders, such as raw material suppliers, end-product manufacturers, and regulatory organizations in the supply chain. The demand side of this market is characterized from key opinion leaders in various applications for the flow meter. The supply side is characterized by advancements in technology and diverse application industries. Various primary sources from both the supply and demand sides of the market were interviewed to obtain qualitative and quantitative information.

To know about the assumptions considered for the study, download the pdf brochure
|
COMPANY NAME
|
DESIGNATION
|
|
Emerson Electric Co.
|
Global Strategy & Innovation Manager
|
|
Siemens AG
|
Technical Sales Manager
|
|
ABB Ltd.
|
Senior Supervisor
|
|
Endress+Hauser Management AG
|
Production Supervisor
|
|
Badger Meter, Inc.
|
Production Manager
|
Market Size Estimation
Both top-down and bottom-up approaches were used to estimate and validate the total size of the flow meter market. These methods were also used extensively to estimate the size of various subsegments in the market. The research methodology used to estimate the market size includes the following:
-
The key players in the industry have been identified through extensive secondary research.
-
The supply chain of the industry has been determined through primary and secondary research.
-
All percentage shares, splits, and breakdowns have been determined using secondary sources and verified through primary sources.
-
All possible parameters that affect the markets covered in this research study have been accounted for, viewed in extensive detail, verified through primary research, and analyzed to obtain the final quantitative and qualitative data.
Flow meter market: Bottom-Up Approach

Flow meter market: Top-Down Approach

Data Triangulation
After arriving at the overall market size—using the market size estimation processes as explained above—the market was split into respective segments and subsegments. To realize the overall market engineering process and arrive at the exact statistics of each market segment and subsegment, the data triangulation, and market breakdown procedures were employed, wherever applicable. The data was triangulated by studying several factors and trends from both the demand and supply sides in the flow meter industry.
Market Definition
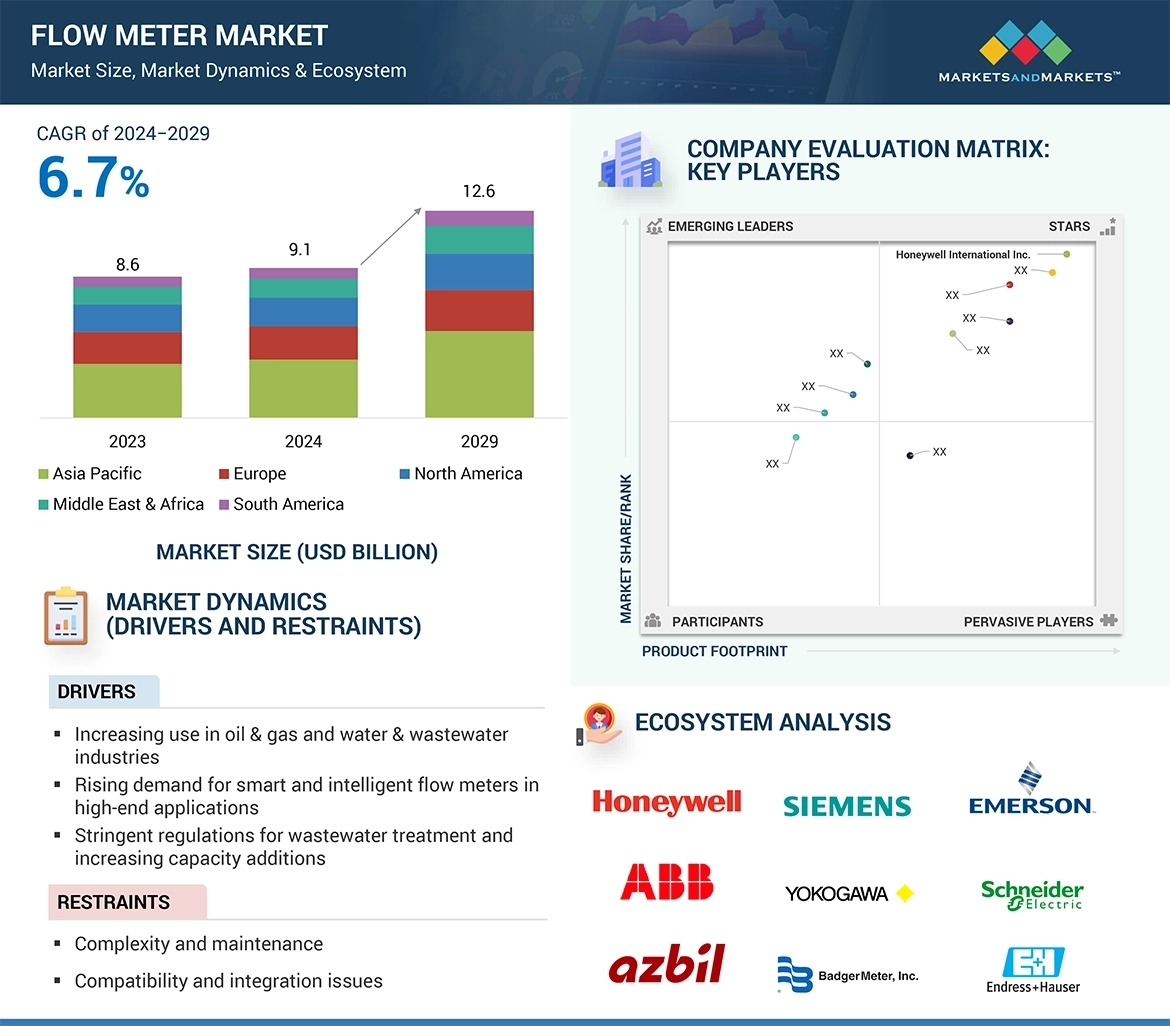
According to OMEGA Engineering Inc., a flow meter (or flow meter) is an instrument used to measure linear, nonlinear, volumetric, or mass flow rate of a liquid or a gas. Flow meters are used for the quantification of liquid and gas flowing through a pipe or system. The flow of liquid and gas can be measured by volumetric or mass flow rates.
Key Stakeholders
-
Flow meter manufacturers
-
Raw material manufacturers
-
Government planning commissions and research organizations
-
Industry associations
-
End-use industries
-
R&D institutions
Report Objectives
-
To analyze and forecast the size of the flow meter market in terms of value
-
To provide detailed information regarding key factors, such as drivers, restraints, challenges, and opportunities influencing the growth of the market
-
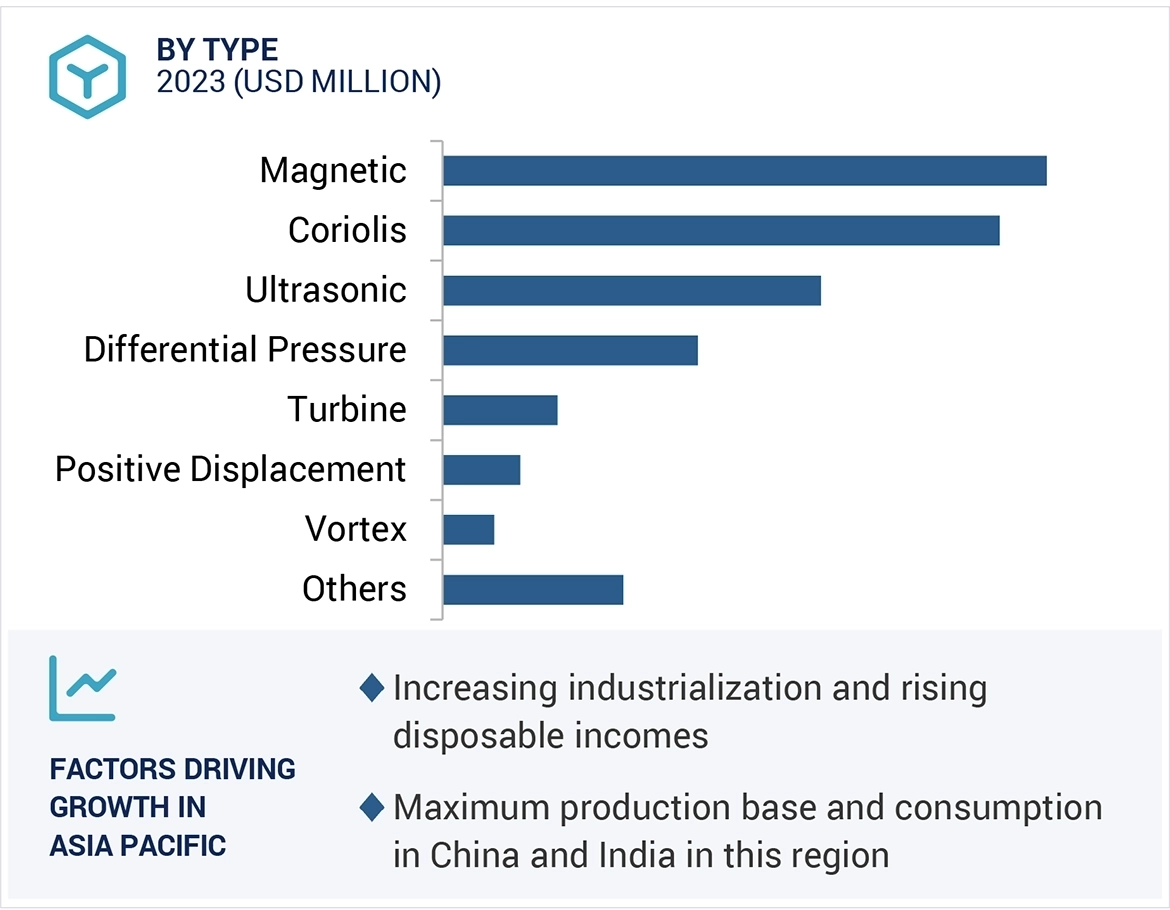
To define, describe, and segment the flow meter market based on type and end-use industry
-
To forecast the size of the market segments for regions such as Asia Pacific, North America, Europe, Middle East & Africa, and South America
-
To strategically analyze the segmented markets with respect to individual growth trends, prospects, and contribution to the overall market
-
To identify and analyze opportunities for stakeholders in the market
-
To strategically profile key players and comprehensively analyze their core competencies
Available Customizations
Along with the given market data, MarketsandMarkets offers customizations according to the company’s specific needs. The following customization options are available for the report:
Regional Analysis
-
Further breakdown of a region with respect to a particular country or additional application
Company Information
-
Detailed analysis and profiles of additional market players (up to five)
Flow Sensor Market Overview
The flow sensor market is a rapidly growing industry driven by increasing demand for accurate flow measurement in various applications. Flow sensors are devices used to measure the flow rate or volume of a fluid or gas in a system. These sensors are used in a wide range of industries, including automotive, aerospace, chemical, pharmaceutical, and food and beverage.
The global flow sensor market is expected to grow significantly in the coming years, driven by factors such as increasing industrial automation, the need for accurate flow measurement, and the growing demand for energy-efficient systems. The market is also expected to benefit from the development of new technologies and the increasing adoption of IoT and cloud computing.
Some of the key types of flow sensors include mass flow sensors, velocity flow sensors, and volumetric flow sensors. Mass flow sensors measure the mass flow rate of a fluid, while velocity flow sensors measure the velocity of a fluid and calculate the flow rate based on the cross-sectional area of the pipe. Volumetric flow sensors measure the volume of a fluid flowing through a system.
The flow sensor market is segmented based on type, application, and geography. Some of the major applications of flow sensors include process control, HVAC, water and wastewater management, medical devices, and automotive. The market is also segmented based on geography, with key regions including North America, Europe, Asia-Pacific, and Rest of the World.
Flow sensors and flow meters are two related but distinct technologies used for measuring the flow of fluids in a system. While both technologies are used to measure the flow of liquids or gases, flow sensors and flow meters differ in terms of their design and functionality.
Flow sensors are typically small devices that are installed in-line with the fluid flow to measure the flow rate or velocity of the fluid. Flow sensors can be based on various technologies, such as thermal, ultrasonic, and Coriolis, and are used in a wide range of applications, including process control, medical devices, automotive, and HVAC systems.
Flow meters, on the other hand, are typically larger devices that are used to measure the volume or mass flow rate of a fluid in a system. Flow meters can be based on various technologies, such as positive displacement, turbine, electromagnetic, and ultrasonic, and are used in a wide range of applications, including water and wastewater management, chemical processing, and oil and gas production.
While flow sensors and flow meters are different in terms of their design and functionality, they are often used in combination with one another in various applications. For example, a flow meter may be used to measure the overall flow rate of a fluid in a system, while a flow sensor may be used to provide more detailed information on the flow profile, such as flow velocity or turbulence.
The market for flow sensors and flow meters is often intertwined, as many manufacturers produce both types of devices. As a result, the growth of the flow sensor market can impact the flow meter market, and vice versa, as advancements in one technology can drive innovation in the other.
The growth of the flow sensor market is expected to have a significant impact on the flow meter market in a number of ways. Here are some potential impacts:
1. Increased adoption of flow sensors may lead to more integrated flow meter systems: As flow sensors become more advanced and accurate, there is a growing trend towards integrating them with flow meters to provide a more complete picture of the flow in a system. This could lead to an increase in the adoption of flow meter systems that incorporate flow sensors, driving growth in the flow meter market.
2. The development of new technologies in the flow sensor market may lead to improvements in flow meter accuracy: As flow sensor technology advances, there may be opportunities to incorporate these advancements into flow meters. This could lead to the development of more accurate flow meters, which could be particularly beneficial in industries such as oil and gas or chemical processing, where even small measurement errors can have significant consequences.
3. The growth of the flow sensor market may drive innovation in the flow meter market: As the demand for flow sensors continues to grow, there may be more research and development into new technologies and applications. This could lead to new opportunities for innovation in the flow meter market as well, as manufacturers seek to differentiate themselves by incorporating the latest advancements in flow sensor technology into their flow meters.
4. Increasing demand for flow sensors may lead to increased competition in the flow meter market: As more manufacturers enter the flow sensor market, there may be more competition for market share. This could lead to increased pressure on flow meter manufacturers to differentiate their products through price, features, or other factors.
Flow Sensor Market Trends
The flow sensor market is expected to continue growing in the coming years, driven by a range of applications across a variety of industries. Here are some potential futuristic growth use-cases for flow sensors:
1. Smart homes and buildings: The rise of smart homes and buildings is creating new opportunities for flow sensors. These sensors can be used to monitor the flow of water, gas, and other fluids, providing valuable data for energy management, leak detection, and other applications.
2. Autonomous vehicles: As the automotive industry moves towards autonomous vehicles, there is a growing need for sensors that can monitor and control fluid flow in the vehicle. Flow sensors can be used to monitor the flow of fuel, coolant, and other fluids, ensuring that the vehicle is running safely and efficiently.
3. Industrial IoT: The industrial internet of things (IIoT) is driving demand for sensors that can monitor and control the flow of fluids in industrial processes. Flow sensors can be used in a wide range of applications, from monitoring the flow of chemicals in a chemical plant to measuring the flow of water in a wastewater treatment plant.
4. Medical devices: Flow sensors are already widely used in medical devices, such as ventilators and anesthesia machines, to monitor and control the flow of air and other gases. As the medical device market continues to grow, there may be new opportunities for flow sensors in applications such as drug delivery and patient monitoring.
5. Agriculture: Flow sensors can be used in a variety of agricultural applications, such as irrigation systems, fertilizer injectors, and pesticide sprayers. As the world's population continues to grow, there is increasing demand for technologies that can improve the efficiency and productivity of agriculture, and flow sensors are likely to play a role in meeting this demand.
Top Companies in Flow Sensor Market
The flow sensor market is highly competitive, with many players offering a variety of products and solutions across a range of industries. Here are some of the top players in the flow sensor market:
1. Honeywell International Inc.
2. Siemens AG
3. TE Connectivity Ltd.
4. Sensirion AG
5. Emerson Electric Co.
6. ABB Ltd.
7. NXP Semiconductors N.V.
8. First Sensor AG
9. STMicroelectronics N.V.
10. Omron Corporation
These companies are all global leaders in the flow sensor market, with a strong presence across a variety of industries, including automotive, industrial automation, healthcare, and consumer electronics. Many of these companies offer a wide range of flow sensors, including thermal flow sensors, mass flow sensors, and differential pressure flow sensors, as well as associated software and services. These companies also have a strong focus on research and development, driving innovation in the flow sensor market and creating new opportunities for growth and differentiation.
Flow Sensor Market Impact on Different Industries
The flow sensor market has a wide range of applications across multiple industries. Here are some examples of industries that are likely to be impacted by the growth of the flow sensor market in the future:
1. Automotive: Flow sensors are used in many automotive applications, including engine management, fuel injection, and exhaust gas recirculation. As the automotive industry continues to evolve, there will be increasing demand for flow sensors to support the development of electric and hybrid vehicles.
2. Aerospace and defense: Flow sensors are used in aerospace and defense applications to measure fluid flow in fuel, hydraulic systems, and other critical systems. As the demand for unmanned aerial vehicles (UAVs) and other unmanned systems grows, there will be new opportunities for flow sensors in these applications.
3. Healthcare: Flow sensors are used in a variety of healthcare applications, including respiratory therapy, anesthesia, and infusion pumps. As the demand for home healthcare and wearable medical devices grows, there will be new opportunities for flow sensors in these markets.
4. Water and wastewater treatment: Flow sensors are used in water and wastewater treatment applications to measure and monitor the flow of water and other fluids. As the demand for water and wastewater treatment grows, there will be new opportunities for flow sensors in these applications.
5. HVAC and building automation: Flow sensors are used in HVAC (heating, ventilation, and air conditioning) and building automation systems to monitor and control fluid flow in these systems. As the demand for energy-efficient and sustainable buildings grows, there will be new opportunities for flow sensors in these applications.
The flow sensor market is likely to continue growing in the future, driven by the increasing demand for more efficient and sustainable technologies across a wide range of industries. With the rise of the Internet of Things and other connected technologies, flow sensors are likely to play an increasingly important role in monitoring and controlling fluid flow in a variety of contexts.
Speak to our Analyst today to know more about Flow Sensor Market!


Growth opportunities and latent adjacency in Flow Meter Market