Crop Oil Concentrates Market by Application (Herbicides, Insecticides, and Fungicides), Crop Type (Cereals & grains, Oilseeds & Pulses, and Fruits & Vegetables), Surfactant Concentration, and Region - Global Forecast to 2025


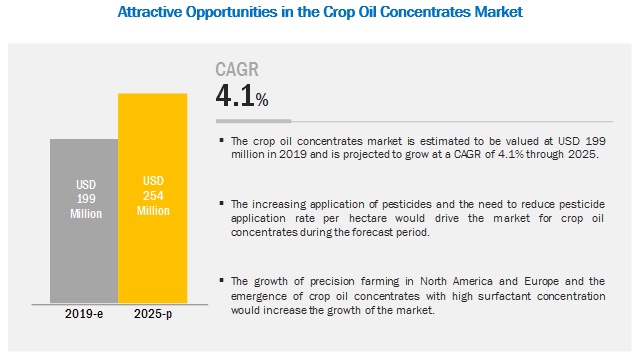
[140 Pages Report] The crop oil concentrates market is estimated to account for USD 199 million in 2019 and is projected to reach USD 254 million by 2025, recording a CAGR of 4.1% during the forecast period. The market is primarily driven by the increasing need to reduce pesticide usage per hectare, growing preference for generic pesticides, and rising adoption of herbicide-tolerant crops.
On the basis of application, the herbicides segment is estimated to account for a major share, in terms of value, in 2019.
Of the various pesticides, the usage of herbicides remains high globally. This due to an increase in the cultivation area of herbicide-tolerant crops and high weed resistance to herbicide formulations. In addition, according to industry experts, application of adjuvants including COC, remains high in herbicides due to its increasing application rate as per labels provided by pesticide manufacturers. Thus, in terms of both value and volume, the herbicides segment is estimated to dominate the global market in 2019.
Higher consumption of herbicides for corn and wheat contributes to the growth of the crop oil concentration market in this segment
COC consumption, on the basis of crop type, is mainly dependent on the consumption of pesticides for each crop. However, the pesticide consumption in each crop depends on multiple factors, such as the type of pest infesting the crop, cropping cycle, number of pesticide applications in the growth phase, and climatic conditions. Since the application of pesticide is high for row crops, including corn, wheat, and rice, the crop oil concentrates market for cereals & grains is estimated to be high in 2019.
On the basis of surfactant concentration, the greater than 25% surfactant concentration segment is projected to witness higher growth in the market
The surfactant content in the product helps attain a better coverage area for the pesticide and also imparts the surfactant�s properties to pesticide application. The surfactant concentration decides the quality of the product as well as defines its price, ranging from less than 15% to more than 25% of a surfactant in a product. Since the products with higher surfactant concentration provide added advantages of the surfactant, the cost of these products is comparatively high. Thus, the market for crop oil concentrates with surfactant concentration greater than 25% is estimated to the high in the global market in 2019.
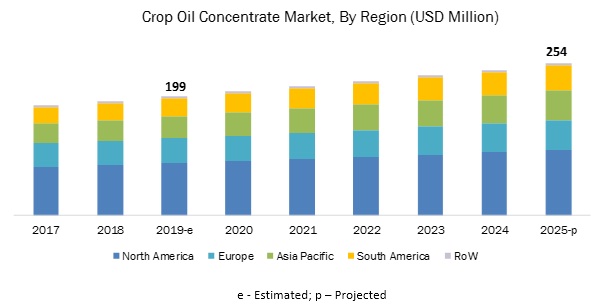
South America is projected to witness the highest growth in the market during the forecast period
The global market was dominated by North America in 2018, in terms of value and volume, due to the high presence of COC manufacturers and adoption of modern agricultural technology such as precision farming and plant biotechnology. However, the demand for COCs in developing regions, such as South America has significantly increased. This is mainly due to the growing adoption of agrochemicals, advancements in farming techniques in Brazil and Argentina, and establishment of distribution channels by global agrochemical players. In addition, the consumption of herbicides is quite high in the region, according to FAOSTAT. Due to these factors, the market in South America is projected to record the highest growth during the forecast period.
Key Market Players
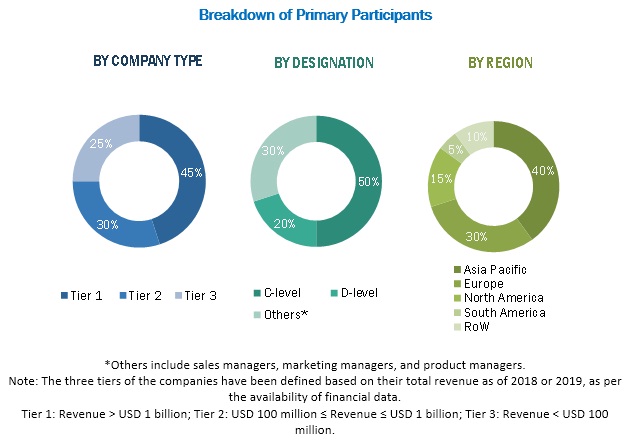
Many domestic and global players provide COC products for various pesticide applications across the world. Major manufacturers have their presence in the North American and European countries. The definition for COCs is not structured by any government authority, and hence, there has been ambiguity in understanding its scope. Hence, the report scope has been restricted to the market for petroleum-based COCs marketed across the globe. Key companies in the crop oil concentrates market are Wilbur-Ellis Holdings, Inc. (US), Croda International Plc (UK), BASF (Germany), Winfield United (US), KALO, Inc. (US), BRANDT Consolidated, Inc. (US), Innvictis Crop Care (US), CHS, Inc. (US), Precision Laboratories, LLC (US), Helena Agri-Enterprises, LLC (US), Nutrien Ag Solutions (US), and Plant Health Technologies (US). Various strategies, such as acquisitions, expansions, and agreements, were adopted by key companies to remain competitive in this market.
Scope of the report
|
Report Metric |
Details |
|
Market size estimation |
2017�2025 |
|
Base year considered |
2017 |
|
Forecast period considered |
2019�2025 |
|
Units considered |
Value (USD) and Volume (Tons) |
|
Segments covered |
Application, Crop Type, Surfactant Concentration, and Region |
|
Regions covered |
North America, Asia Pacific, Europe, South America, and RoW |
|
Companies studied |
Wilbur-Ellis, BASF, Croda International, Winfield United, and Helena Agri-Enterprises |
This research report categorizes the crop oil concentrates market, based on application, crop type, surfactant concentration, and region.
Target Audience
- Supply-side: Adjuvant manufacturers, suppliers, distributors, importers, and exporters
- Traders and suppliers of raw materials such as petrochemical distillers
- Demand-side: Pesticide manufacturers, farmers, farmer organizations, and contract farmers
- Regulatory side: Concerned government authorities, commercial research & development (R&D) institutions, and other regulatory bodies
- Associations and industry bodies: Food and Agriculture Organization (FAO), International Society for Agrochemical Adjuvants (ISAA), US Department of Agriculture (USDA), and Pesticide Action Network (PAN)
Report Scope
Application
- Herbicides
- Insecticides
- Fungicides
- Others (plant growth regulators, defoliants, fertilizers, micronutrients, and miticides)
Crop Type
- Cereals & grains
- Oilseeds & pulses
- Fruits & vegetables
- Others (sugar crops, turfs, and ornamentals)
Surfactant Concentration
- Less than 15%
- Between 15% and 25%
- Greater than 25%
By Region
- North America
- Europe
- Asia Pacific
- South America
- Rest of the World (RoW)
Key questions addressed by the report:
- Which region will account for the highest share in the crop oil concentrates market?
- How would the fluctuations in petroleum oil prices impact the growth of the crop oil concentrates market globally?
- What are the trends and factors responsible for influencing the adoption rate of COCs in key emerging countries? What is the level of support offered by governments across these countries to the manufacturers?
- Which are the key players in the market and how intense is the competition?
To speak to our analyst for a discussion on the above findings, click Speak to Analyst
 Exclusive indicates content/data unique to MarketsandMarkets and not available with any competitors.
Table of Contents
1 Introduction (Page No. - 15)
1.1 Objectives of the Study
1.2 Market Definition
1.3 Study Scope
1.3.1 Regional Segmentation
1.3.2 Periodization Considered
1.4 Currency Considered
1.5 Units Considered
1.6 Stakeholders
2 Research Methodology (Page No. - 19)
2.1 Research Data
2.1.1 Secondary Data
2.1.2 Primary Data
2.1.2.1 Key Industry Insights
2.1.2.2 Breakdown of Primary Interviews
2.2 Market Size Estimation
2.3 Data Triangulation
2.4 Research Assumptions
2.5 Limitations
3 Executive Summary (Page No. - 26)
4 Premium Insights (Page No. - 30)
4.1 Opportunities in this Market
4.2 Crop Oil Concentrate Market, By Application & Region, 2018
4.3 North America: Crop Oil Concentrates Market, By Crop Type & Country, 2018
4.4 Crop Oil Concentrate Market, By Surfactant Concentration, 2018
4.5 Crop Oil Concentrate Market, By Key Country, 2019-2025
5 Market Overview (Page No. - 34)
5.1 Introduction
5.2 Macroeconomic Indicators
5.2.1 Upsurge in Global Pesticide Consumption
5.3 Market Dynamics
5.3.1 Drivers
5.3.1.1 High Acceptance Due to Its Major Role in Improving the Efficiency of Agrochemicals
5.3.1.2 Growing Market for Generic Pesticides
5.3.1.3 Increasing Adoption of Herbicide-Tolerant Crops
5.3.2 Restraints
5.3.2.1 Fluctuations in Raw Material Prices
5.3.2.2 Growing Competition From Vegetable-Derived Oil Concentrates
5.3.3 Opportunities
5.3.3.1 Advent of Precision Farming Can Create Opportunities for Tank Mix Formulations
5.3.4 Challenges
5.3.4.1 Growing Environmental and Human Health Concerns
5.4 Regulatory Framework
5.4.1 North America
5.4.1.1 US
5.4.1.2 Canada
5.4.2 Europe
5.4.2.1 UK
5.4.2.2 Germany
5.4.3 Asia Pacific
5.4.3.1 Australia
5.4.4 South Africa
5.5 Patent Analysis
5.6 Supply Chain Framework
6 Crop Oil Concentrates Market, By Application (Page No. - 47)
6.1 Introduction
6.2 Herbicides
6.2.1 The Post-Emergent Herbicide Segment Continues to Be the Largest in the Market in North America
6.3 Fungicides
6.3.1 Precision Laboratories (US) Develop Crop Oil Concentrate Products Specific for Fungicide Use
6.4 Insecticides
6.4.1 Crop Oil Concentrates are Used With Insecticides at A Lower Scale, Owing to the High Demand for Surfactants
6.5 Others
6.5.1 Gradual Increase in Consumption of Fertilizers is Projected to Drive the Market
7 Crop Oil Concentrates Market, By Surfactant Concentration (Page No. - 55)
7.1 Introduction
7.2 Less Than 15%
7.2.1 Lower Prices of Products With Surfactant Concentration Less Than 15% Resulting in Adoption in Developing Economies
7.3 Between 15% and 25%
7.3.1 Emergence of High Surfactant Crop Oil Concentrates (HsCOC) Lowering the Growth of This Segment
7.4 Greater Than 25%
7.4.1 Growth in Demand for Products With 40% Surfactant Concentration Owing to their Higher Efficacy
8 Crop Oil Concentrates Market, By Crop Type (Page No. - 60)
8.1 Introduction
8.2 Cereals & Grains
8.2.1 Higher Consumption of Herbicides for Corn and Wheat Contributes to Significant Market Growth for COC in This Segment
8.3 Oilseeds & Pulses
8.3.1 Rising Consumption of Industrial Crops Such as Soybean and Cotton has Increased the Demand for Better Pesticides in the Market
8.4 Fruits & Vegetables
8.4.1 Higher Commodity Price of Horticultural Crops is Driving the Demand for HsCOC in the Market
8.5 Others
9 Crop Oil Concentrates Market, By Region (Page No. - 67)
9.1 Introduction
9.2 North America
9.2.1 US
9.2.1.1 Higher Usage of Post-Emergent Herbicides for Corn and Soybean Cultivation Creates Opportunities for the Market
9.2.2 Canada
9.2.2.1 Alberta and British Columbia are A Few Major Provinces in the Country With the Highest Adjuvant Usage
9.2.3 Mexico
9.2.3.1 Decline in Usage of Pesticides in the Country Can Pose A Threat for the Market
9.3 Europe
9.3.1 France
9.3.1.1 Stringent Regulations in the Country Affecting the Growth of the Market
9.3.2 Germany
9.3.2.1 High Demand for Adjuvants Among Farmers to Complement Herbicide Applications
9.3.3 Spain
9.3.3.1 Modernization and High Use of Pesticides Driving the Market
9.3.4 Italy
9.3.4.1 Large Cultivation Driving the Use of Crop Oil Concentrates
9.3.5 Rest of Europe
9.4 Asia Pacific
9.4.1 China
9.4.1.1 Fluctuations in Petroleum Price to Affect Production Cost of COC Products
9.4.2 Australia
9.4.2.1 High Use of COC in Southern and Western Australia to Drive the Market Growth
9.4.3 India
9.4.3.1 Growing Market for Herbicides and Fungicides to Drive the Adoption of Adjuvants in the Country
9.4.4 Japan
9.4.4.1 Advanced Agricultural Practices Drive the Growth of Market
9.4.5 Malaysia
9.4.5.1 High Consumption of Herbicides to Boost the Consumption of COC
9.4.6 Rest of Asia Pacific
9.5 South America
9.5.1 Brazil
9.5.1.1 High Cultivation of Herbicide-Tolerant Crops to Increase the Consumption of Crop Oil Concentrates for Herbicide Applications
9.5.2 Argentina
9.5.2.1 Rising Government Support to Farmers for the Usage of Pesticides to Contribute to the Market Growth During the Forecast Period
9.5.3 Rest of South America
9.6 Rest of the World
9.6.1 South Africa
9.6.1.1 High Growth in Fungicide and Bactericide Consumption Observed in the Country
9.6.2 Turkey
9.6.2.1 Rising Government Support for the Usage of Pesticides Creating Opportunities for Crop Oil Concentrates in the Country
9.6.3 Others in Row
10 Competitive Landscape (Page No. - 103)
10.1 Overview
10.2 Competitive Leadership Mapping
10.2.1 Dynamic Capitalizers
10.2.2 Innovators
10.2.3 Visionary Leaders
10.2.4 Emerging Companies
10.3 Competitive Benchmarking
10.3.1 Strength of Product Portfolio
10.3.2 Business Strategy Excellence
10.4 Competitive Scenario
10.4.1 Expansions & Investments
10.4.2 Mergers & Acquisitions
10.4.3 Agreements
11 Company Profiles (Page No. - 112)
(Business Overview, Products Offered, Recent Developments, SWOT Analysis, MnM View)*
11.1 Wilbur-Ellis
11.2 Innvictis Crop Care
11.3 Precision Laboratories, LLC
11.4 CHS Inc.
11.5 Croda International
11.6 BASF
11.7 Helena Agri-Enterprises
11.8 Winfield United
11.9 BRANDT Consolidated
11.10 KALO Inc.
11.11 Plant Health Technologies (Jr Simplot)
11.12 Nutrien AG Solutions, Inc.
*Details on Business Overview, Products Offered, Recent Developments, SWOT Analysis, MnM View Might Not Be Captured in Case of Unlisted Companies.
12 Appendix (Page No. - 134)
12.1 Discussion Guide
12.2 Knowledge Store: Marketsandmarkets� Subscription Portal
12.3 Available Customizations
12.4 Related Reports
12.5 Author Details
List of Tables (72 Tables)
Table 1 USD Exchange Rates, 2014�2018
Table 2 List of Important Patents for Crop Oil Concentrates, 2015�2018
Table 3 Crop Oil Concentrate Market Size, By Application, 2017�2025 (UD Million)
Table 4 Market Size, By Application, 2017�2025 (Tons)
Table 5 Herbicides: Crop Oil Concentrates Market Size, By Region, 2017�2025 (USD Thousand)
Table 6 Herbicides: By Market Size, By Region, 2017�2025 (Tons)
Table 7 Fungicides: By Market Size, By Region, 2017�2025 (USD Thousand)
Table 8 Fungicides: By Market Size, By Region, 2017�2025 (Tons)
Table 9 Insecticides: By Market Size, By Region, 2017�2025 (USD Thousand)
Table 10 Insecticides: By Market Size, By Region, 2017�2025 (Tons)
Table 11 Others: By Market Size, By Region, 2017�2025 (USD Thousand)
Table 12 Others: By Market Size, By Region, 2017�2025 (Tons)
Table 13 By Market Size, By Surfactant Concentration, 2017�2025 (USD Million)
Table 14 Less Than 15%: By Market Size, By Region, 2017�2025 (USD Thousand)
Table 15 Between 15% and 25%: By Market Size, By Region, 2017�2025 (USD Thousand)
Table 16 Greater Than 25%: By Market Size, By Region, 2017�2025 (USD Million)
Table 17 Market Size, By Crop Type, 2017�2025 (USD Million)
Table 18 Cereals & Grains: Crop Oil Concentrates Market Size, By Region, 2017�2025 (USD Million)
Table 19 World Production of Major Oil Crops, 2015 � 2018 (Mmt)
Table 20 Oilseeds & Pulses: By Market Size, By Region, 2017�2025 (USD Thousand)
Table 21 Fruits & Vegetables: By Market Size, By Region, 2017�2025 (USD Million)
Table 22 Others: By Market Size, By Region, 2017�2025 (USD Thousand)
Table 23 Crop Oil Concentrate Market Size, By Region, 2016�2025 (USD Million)
Table 24 Market Size, By Region, 2017�2025 (Tons)
Table 25 North America: Crop Oil Concentrates Market Size, By Country, 2017�2025 (usD Million)
Table 26 North America: Market Size, By Application, 2017�2025 (USD Million)
Table 27 North America: Market Size, By Application, 2017�2025 (Tons)
Table 28 North America: Market Size, By Crop Type, 2017�2025 (USD Million)
Table 29 North America: Market Size, By Surfactant Concentration, 2017�2025 (USD Million)
Table 30 US: Crop Oil Concentrates Market Size, By Application, 2017�2025 (USD Million)
Table 31 Canada: By Market Size, By Application, 2017�2025 (USD Thousand)
Table 32 Mexico: By Market Size, By Application, 2017�2025 (USD Million)
Table 33 Europe: By Market Size, By Country, 2017�2025 (USD Million)
Table 34 Europe: By Market Size, By Application, 2017�2025 (USD Million)
Table 35 Europe: By Market Size, By Application, 2017�2025 (Tons)
Table 36 Europe: By Market Size, By Crop Type, 2017�2025 (USD Million)
Table 37 Europe: By Market Size, By Surfactant Concentration, 2017�2025 (USD Million)
Table 38 France: Crop Oil Concentrates Market Size, By Application, 2017�2025 (USD Thousand)
Table 39 Germany: By Market Size, By Application, 2017�2025 (USD Thousand)
Table 40 Spain: By Market Size, By Application, 2017�2025 (USD ThoUsand)
Table 41 Italy: By Market Size, By Application, 2017�2025 (USD Thousand)
Table 42 Rest of Europe: By Market Size, By Application, 2017�2025 (USD Thousand)
Table 43 Asia Pacific: By Market Size, By Country, 2017�2025 (USD Million)
Table 44 Asia Pacific: By Market Size, By Application, 2017�2025 (USD Million)
Table 45 Asia Pacific: By Market Size, By Application, 2017�2025 (Tons)
Table 46 Asia Pacific: By Market Size, By Crop Type, 2017�2025 (USD Million)
Table 47 Asia Pacific: By Market Size, By Surfactant Concentration, 2017�2025 (USD Million)
Table 48 China: Crop Oil Concentrates Market Size, By Application, 2017�2025 (USD Million)
Table 49 Australia: By Market Size, By Application, 2017�2025 (USD Thousand)
Table 50 India: By Market Size, By Application, 2017�2025 (USD Thousand)
Table 51 Japan: By Market Size, By Application, 2017�2025 (USD Thousand)
Table 52 Malaysia: By Market Size, By Application, 2017�2025 (USD Thousand)
Table 53 Rest of Asia Pacific: By Market Size, By Application, 2017�2025 (USD Thousand)
Table 54 South America: By Market Size, By Country, 2017�2025 (USD Million)
Table 55 South America: By Market Size, By Crop Type, 2017�2025 (USD Million)
Table 56 South America: By Market Size, By Surfactant Concentration, 2017�2025 (USD Million)
Table 57 South America: Crop Oil Concentrates Market Size, By Application, 2017�2025 (USD Million)
Table 58 South America: By Market Size, By Application, 2017�2025 (Tons)
Table 59 Brazil: By Market, By Application, 2017�2025 (USD Million)
Table 60 Argentina: By Market, By Application, 2017�2025 (USD Thousand)
Table 61 Rest of South America: By Market, By Application, 2017�2025 (USD Thousand)
Table 62 Rest of the World: By Market Size, By Country, 2017�2025 (USD Thousand)
Table 63 Rest of the World: By Market Size, By Crop Type, 2017�2025 (USD Thousand)
Table 64 Rest of the World: Crop Oil Concentrates Market Size, By Surfactant Concentration, 2017�2025 (USD Thousand)
Table 65 Rest of the World: By Market Size, By Application, 2017�2025 (USD Thousand)
Table 66 Rest of the World: By Market Size, By Application, 2017�2025 (Tons)
Table 67 South Africa: By Market Size, By Application, 2017�2025 (USD Thousand)
Table 68 Turkey: Crop Oil Concentrate Market Size, By Application, 2017�2025 (USD Thousand)
Table 69 Others: By Market Size, By Application, 2017�2025 (USD Million)
Table 70 Expansions & Investments, 2015 - 2019
Table 71 Mergers and Acquisitions, 2014 �2019
Table 72 Agreements, 2014�2019
List of Figures (38 Figures)
Figure 1 Crop Oil Concentrates: Market Segmentation
Figure 2 Research Design
Figure 3 Breakdown of Primary Interviews: By Company Type, Designation, and Region
Figure 4 Market Size Estimation Methodology: Bottom-Up Approach
Figure 5 Market Size Estimation Methodology: Top-Down Approach
Figure 6 Data Triangulation Methodology
Figure 7 Crop Oil Concentrates Market Share (Value), By Type, 2019 vs. 2025
Figure 8 Market Share (Value), By Crop Type, 2018
Figure 9 Market Size, By Surfactant Concentration, 2019 vs. 2025 (USD Million)
Figure 10 Crop Oil Concentrate Market (Value): Regional Snapshot
Figure 11 Increasing Adoption of High Surfactant Crop Oil Concentrates Supporting Market Growth
Figure 12 North America Was the Major Consumer of Crop Oil Concentrates Across the Major Applications in 2018
Figure 13 The US Was One of the Major Consumers in 2018
Figure 14 Products With Surfactant Concentration Greater Than 25% Were Widely Consumed in 2018
Figure 15 Asian and South American Countries are Projected to Witness High Growth During the Forecast Period
Figure 16 Pesticide Consumption, 2010�2016 (Million Mt of Active Ingredients)
Figure 17 Crop Oil Concentrate Market: Drivers, Restraints, Opportunities, and Challenges
Figure 18 Number of Patents Approved for Crop Oil Concentrates, By Key Company, 2014�2019
Figure 19 Geographical Analysis: Patent Approval for Crop Oil Concentrates, 2014�2019
Figure 20 Crop Oil Concentrates: Supply Chain Framework
Figure 21 The Herbicides Segment is Projected to Dominate the Market Throughout the Forecast Period
Figure 22 Products With Surfactant Concentration Greater Than 25% Projected to Dominate the Market By 2025
Figure 23 The Cereals & Grains Segment is Estimated to Dominate the Market in 2019
Figure 24 World Cereal Production, 2015 -2018 (MT)
Figure 25 The US Dominated the Market Among the Study Countries
Figure 26 North America: Regional Snapshot
Figure 27 South America: Regional Snapshot
Figure 28 Crop Oil Concentrates Market: Competitive Leadership Mapping, 2018
Figure 29 Key Developments of the Leading Players in the Market, 2014�2019
Figure 30 Wilbur-Ellis: SWOT Analysis
Figure 31 CHS Inc.: Company Snapshot
Figure 32 Croda International: Company Snapshot
Figure 33 Croda International: SWOT Analysis
Figure 34 BASF: Company Snapshot
Figure 35 BASF: SWOT Analysis
Figure 36 Helena Agri-Enterprises: SWOT Analysis
Figure 37 Winfield United : SWOT Analysis
Figure 38 Nutrien Ltd (Parent Company of Nutrien Ag Solutions): Company Snapshot
The study involved four major activities for estimating the market size of crop oil concentrates. Exhaustive secondary research was conducted to collect information on the market, peer market, and parent market. The next step was to validate these findings, assumptions, and sizing with industry experts across the value chain through primary research. Both the top-down and bottom-up approaches were employed to estimate the complete market size. Thereafter, market breakdown and data triangulation were used to estimate the market size of the segments and subsegments.
Secondary Research
In the secondary research process, various secondary sources such as Bloomberg BusinessWeek and Factiva were referred to, to identify and collect information for this study. These secondary sources included annual reports, press releases & investor presentations of companies, white papers, certified publications, articles by recognized authors, gold & silver standard websites, regulatory bodies, trade directories, and databases.
Primary Research
The market comprises several stakeholders, which include adjuvant manufacturers, suppliers, pesticide manufacturers, and formulators in the supply chain. Various primary sources from both the supply and demand sides of the crop oil concentrate market were interviewed to obtain qualitative and quantitative information. The primary interviewees from the demand side include research institutions, pesticide formulators and suppliers, government agencies, adjuvant associations, and cooperative farm societies. The primary sources from the supply side include adjuvant manufacturers, raw material suppliers, and key opinion leaders.
To know about the assumptions considered for the study, download the pdf brochure
Market Size Estimation
Both the top-down and bottom-up approaches were used to estimate and validate the total size of the crop oil concentrates market. These approaches were also used extensively to estimate the size of various subsegments in the market. The research methodology used to estimate the market size includes the following:
- The key players in the industry and markets were identified through extensive secondary research.
- All possible parameters that affect the markets covered in this research study were accounted for, viewed in extensive detail, verified through primary research, and analyzed to obtain the final quantitative and qualitative data.
- All percentage shares, splits, and breakdowns were determined using secondary sources and verified through primary sources.
- The research included the study of reports, reviews, and newsletters of top market players, along with extensive interviews for opinions from leaders such as CEOs, directors, and marketing executives.
Data Triangulation
After arriving at the overall market size-using the market size estimation processes as explained above-the market was split into several segments and subsegments. In order to arrive at the exact statistics for all the segments and subsegments, the data triangulation and market breakdown procedures were employed, wherever applicable. After the market was validated using both the top-down and bottom-up approaches, the data was triangulated by studying various factors and trends from both the demand and supply sides.
Report Objectives
- To determine and forecast the size of the global market, by application, crop type, surfactant concentration, and region
- To identify attractive opportunities in the crop oil concentrates market by determining the largest and fastest-growing segments across regions
- To strategically analyze the demand-side factors on the basis of the following:
- Impact of macro- and microeconomic factors on the market
- Shifts in demand patterns across different subsegments and regions
- To identify the key drivers and restraints that have an impact on the global market
- To strategically profile the key players and comprehensively analyze their market positions in terms of core competencies, along with detailing the competitive landscape for market leaders
- To analyze strategic approaches such as acquisitions, expansions, investments, product launches & approvals, agreements, collaborations, and partnerships in the crop oil concentrates market
- To provide insights on the key investments in product innovations and patent registrations
- To analyze the supply chain and regulatory frameworks across regions and their impact on prominent market players
Available Customizations
Based on the given market data, MarketsandMarkets offers customizations in the reports according to client-specific requirements. The available customization options are as follows:
Product Analysis
- Product matrix, which gives a detailed comparison of the product portfolio of each company
Regional Analysis
- Further breakdown of the Rest of Europe market into Greece, Poland, Ukraine, and the UK
- Further breakdown of the Rest of Asia Pacific market into Thailand, South Korea, and Vietnam
- Further breakdown of the Rest of South America market into Colombia, Peru, and Uruguay
- Further breakdown of other countries in RoW into Egypt, Kenya, Morocco, and Ethiopia.
Company Information
- Detailed analyses and profiling of additional market players (Up to five)


Growth opportunities and latent adjacency in Crop Oil Concentrates Market