The study involved four major activities in estimating the current size of the fungicides market. Exhaustive secondary research was done to collect information on the market, peer market, and parent market. The next step was to validate these findings, assumptions, and sizing with industry experts across the value chain through primary research. Both top-down and bottom-up approaches were employed to estimate the complete market size. After that, market breakdown and data triangulation were used to estimate the market size of segments and subsegments.
Secondary Research
This research study involved the extensive use of secondary sources—directories and databases such as Bloomberg Businessweek and Factiva—to identify and collect information useful for a technical, market-oriented, and commercial study of the fungicides market.
In the secondary research process, various sources such as annual reports, press releases & investor presentations of companies, white papers, certified publications, articles from recognized authors, gold & silver standard websites, directories, and databases were referred to identify and collect information. This research study involved the extensive use of secondary sources—directories and databases such as Bloomberg Businessweek and Factiva—to identify and collect information useful for a technical, market-oriented, and commercial study of the fungicides market.
Secondary research was mainly used to obtain key information about the industry’s supply chain, the total pool of key players, and market classification and segmentation as per the industry trends to the bottom-most level, regional markets, and key developments from both market- and technology-oriented perspectives.
Primary Research
Extensive primary research was conducted after obtaining information regarding the fungicides market scenario through secondary research. Several primary interviews were conducted with market experts from both the demand and supply sides across major countries of North America, Europe, Asia Pacific, the Middle East & Africa, and South America. Primary data was collected through questionnaires, emails, and telephonic interviews. The primary sources from the supply side included various industry experts, such as Chief X Officers (CXOs), Vice Presidents (VPs), Directors from business development, marketing, research, and development teams, and related key executives from distributors and key opinion leaders. Primary interviews were conducted to gather insights such as market statistics, data on revenue collected from the products and services, market breakdowns, market size estimations, market forecasting, and data triangulation. Primary research also helped in understanding the various trends related to type, crop type, mode of application, mode of action, formulation, and region.

To know about the assumptions considered for the study, download the pdf brochure
Market Size Estimation
Both the top-down and bottom-up approaches were used to estimate and validate the total size of the fungicides market. These approaches were also used extensively to estimate the size of various dependent submarkets. The research methodology used to estimate the market size includes the following:
-
Key players were identified through extensive secondary research.
-
The industry’s value chain and market size were determined through primary and secondary research.
-
All percentage share splits and breakdowns were determined using secondary sources and verified through primary sources.
-
All the possible parameters that affect the markets covered in this research study were accounted for, viewed in extensive detail, verified through primary research, and analyzed to obtain the final quantitative and qualitative data.
-
The following figure provides an illustrative representation of the complete market size estimation process implemented in this research study for an overall estimation of the fungicides market in a consolidated format.
The following sections (bottom-up & top-down) depict the overall market size estimation process employed for the purpose of this study.
Global Fungicides Market: Bottom-Up Approach

To know about the assumptions considered for the study, Request for Free Sample Report
Global Fungicides Market: Top-Down Approach

Data Triangulation
After arriving at the overall market size from the estimation process explained above, the total market was split into several segments and subsegments. Data triangulation and market breakdown procedures were employed, wherever applicable, to estimate the overall fungicides market and arrive at the exact statistics for all segments and subsegments. The data was triangulated by studying various factors and trends from the demand and supply sides. Along with this, the market size was validated using both the top-down and bottom-up approaches.
Market Definition
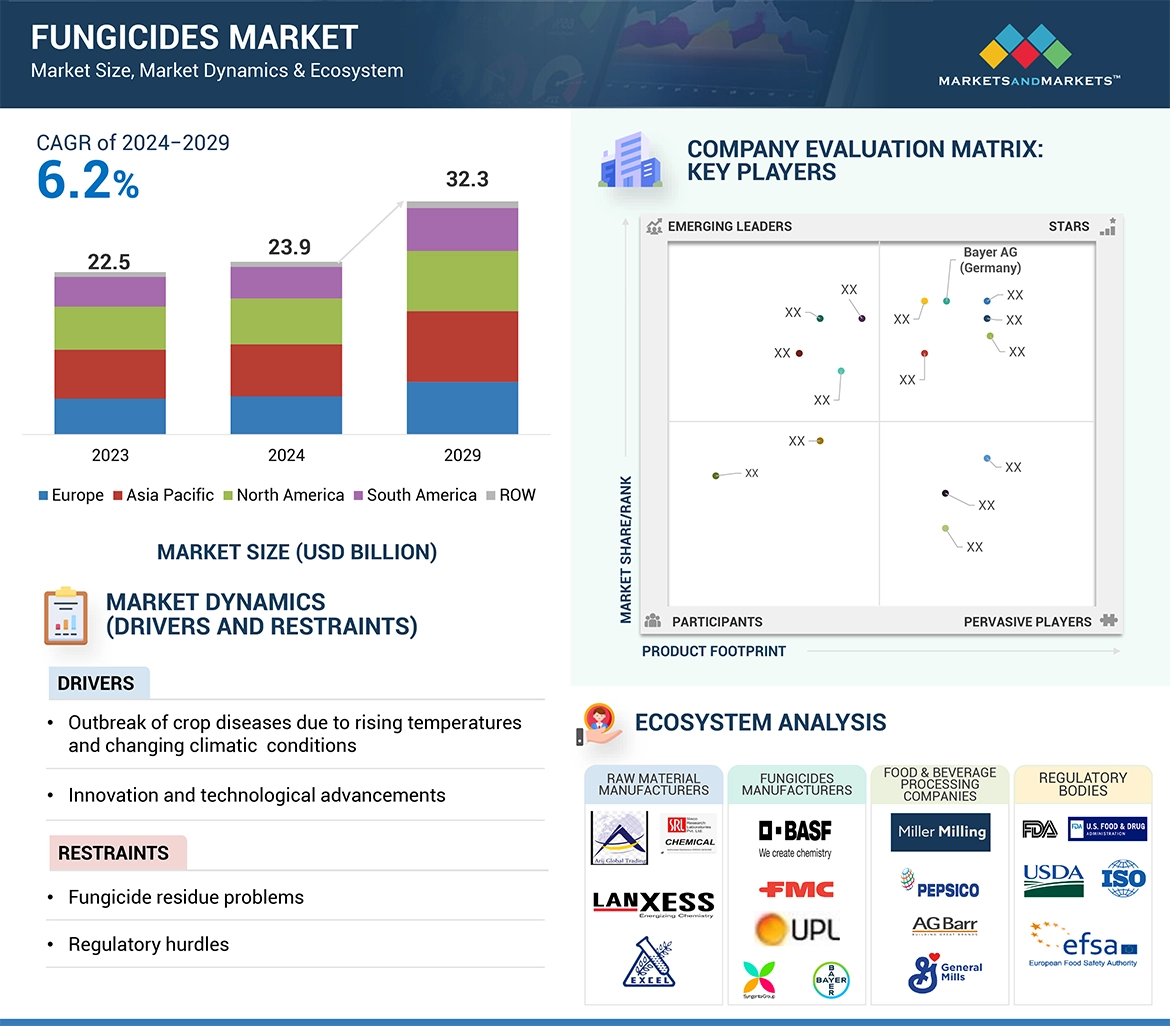
Fungicide is a type of pesticide that is used to destroy or prevent the growth of fungi and their spores. They are applied to crops to protect them from fungi, such as rust, mildew, mold, and blight. They function in different ways, though most damage fungal cell membranes or interfere with energy production within fungal cells.
Key Stakeholders
-
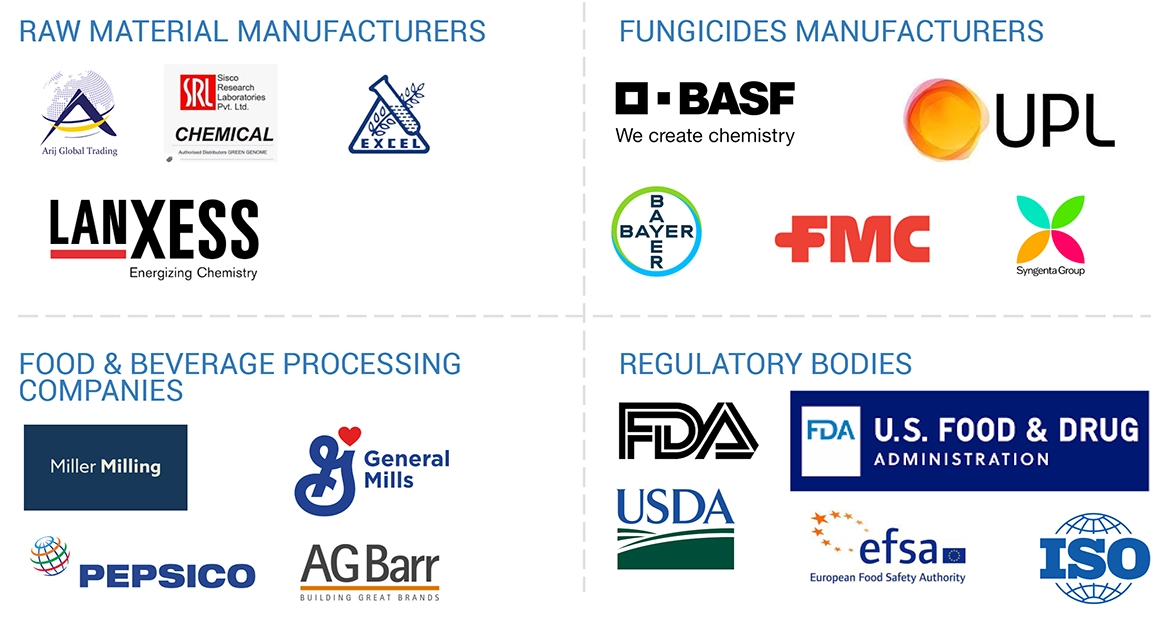
Fungicide manufacturers, formulators, and blenders
-
Pesticides traders, suppliers, distributors, importers, and exporters
-
Raw material suppliers and technology providers to manufacturers
-
Agricultural co-operative societies
-
Fungicide associations and industry bodies:
-
Food and Agriculture Organization (FAO)
-
European Crop Protection Agency (ECPA)
-
Pesticides Manufacturers and Formulators Association (PMFAI)
-
China Crop Protection Industry Association (CCPIA)
-
Government agricultural departments and regulatory bodies:
-
US Environmental Protection Agency (EPA)
-
Canadian Food Inspection Agency (CFIA)
-
US Department of Agriculture (USDA)
-
European Chemical Agency (ECHA)
-
European Food Safety Authority (EFSA)
Report Objectives
MARKET INTELLIGENCE
-
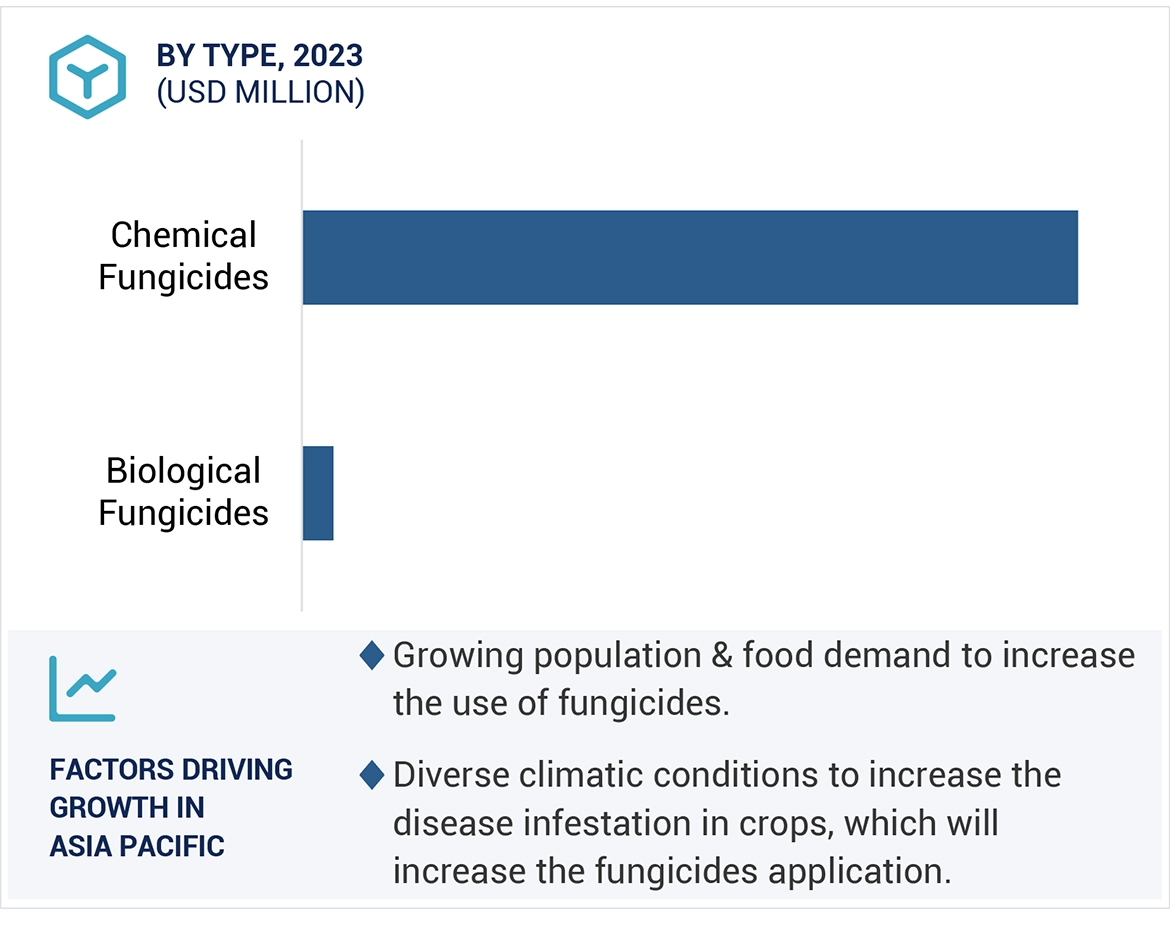
Determining and projecting the size of the fungicides market with respect to type, crop type, mode of application, mode of action, formulation, and region.
-
Identifying the attractive opportunities in the market by determining the largest and fastest-growing segments
-
Providing detailed information about the key factors influencing the market growth (drivers, restraints, opportunities, and industry-specific challenges)
-
Providing the regulatory framework and market entry process related to the fungicides market
-
Analyzing the micro markets with respect to individual growth trends, prospects, and their contribution to the total market
COMPETITIVE INTELLIGENCE
-
Identifying and profiling the key players in the fungicides market
-
Providing a comparative analysis of market leaders based on the following:
-
Product offerings
-
Business strategies
-
Strengths and weaknesses
-
Key financials
-
Understanding the competitive landscape and identifying the major growth strategies adopted by players across the country
-
Providing insights on key product innovations and investments in the fungicides market
Available Customizations:
With the given market data, MarketsandMarkets offers customizations according to company-specific scientific needs.
The following customization options are available for the report:
PRODUCT ANALYSIS
-
Product Matrix, which gives a detailed comparison of the product portfolio of each company.
GEOGRAPHIC ANALYSIS
With the given market data, MarketsandMarkets offers customizations according to company-specific scientific needs.
-
Further breakdown of the Rest of Europe into Belgium, Poland, and Portugal.
-
Further breakdown of the Rest of Asia Pacific into Malaysia, South Korea, and Vietnam.
-
Further breakdown of the Rest of South America into Peru, Colombia, and Paraguay.
COMPANY INFORMATION
-
Detailed analyses and profiling of additional market players (up to five)


Growth opportunities and latent adjacency in Fungicides Market