Current Transducer Market by Technology (Open Loop, Close Loop), Application (Motor Drive, Battery Management, UPS & SMPS, Converter & Inverter), End-User (Industrial, Renewables, Automotive, Residential & Commercial), and Region - Global Forecast to 2023


[127 Pages Report] The global current transducer market was valued at USD 563.2 Million in 2017 and is projected to reach USD 683.7 Million by 2023, at a CAGR of 3.31% during the forecast period. The years considered for the study are as follows:
- Base Year: 2017
- Estimated Year: 2018
- Projected Year: 2023
- Forecast Period: 2018�2023
The base year considered for company profiles is 2017. Whenever information was unavailable for the base year, the prior year has been considered.
Objectives of the Study
- To define and segment the current transducer market on the basis of technology, application, end-user, and region
- To provide detailed information on major factors influencing the growth of the market (drivers, restraints, opportunities, and industry-specific challenges)
- To strategically analyze the current transducer market with respect to individual growth trends, future expansions, and contributions to the market
- To analyze market opportunities for stakeholders and details of a competitive landscape for market leaders
- To forecast the growth of the current transducer system market with respect to the major regions (Asia Pacific, Europe, North America, South America, and the Middle East & Africa)
- To strategically profile key players and comprehensively analyze their market rankings and core competencies
- To analyze competitive developments, such as new product launches, mergers & acquisitions, expansions and investments, and contracts & agreements, in the current transducer market
Research Methodology
This research study involved the use of extensive secondary sources, directories, journals on current transducer generation technologies, and other related rental markets; newsletters and databases such as Hoover�s, Bloomberg, Businessweek, and Factiva, among others, to identify and collect information useful for a technical, market-oriented, and commercial study of the global current transducer market. The primary sources include several industry experts from the core and related industries, vendors, preferred suppliers, technology developers, alliances, and organizations related to all the segments of this industry�s value chain. The research methodology has been explained below.
- Study of annual revenues and market developments of the major players providing current transducer market
- Assessment of future trends and growth of end-users
- Assessment of the current transducer market with respect to the solutions used for different applications at various current transducer generation technologies
After arriving at the overall market size, the total market was split into several segments and sub-segments. The figure given below illustrates the breakdown of primary interviews conducted during the research study based on company type, designation, and region.
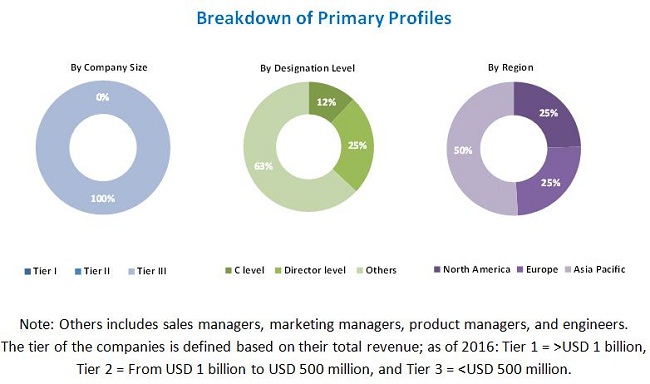
To know about the assumptions considered for the study, download the pdf brochure
Major players operating in the market include LEM (Switzerland), CR Magnetic (US), NK Technologies (US), Veris Industries (US), and Phoenix Contact (US).
Target Audience:
- Banks, venture capitalists, financial institutions, and other investors
- Companies related to current transducer manufacturing
- End-use industries
- Government and industry associations
- Government and research organizations
- Manufacturing industry
Scope of the Report:
- By Technology
- Open Loop
- Closed Loop
- By Application
- Motor Drive
- Battery Management
- UPS & SMPS
- Converter & Inverter
- Others
- By End User
- Industrial
- Automotive
- Renewable
- Residential & Commercial
- Others
- By Region
- Asia Pacific
- Europe
- North America
- South America
- Middle East & Africa
Available Customizations:
With the given market data, MarketsandMarkets offers customizations as per the client�s specific needs. The following customization options are available for this report:
Company Information
- Detailed analyses and profiling of additional market players (up to five)
The global current transducer market is projected to reach a market size of USD USD 683.7 Million in 2023, growing at a CAGR of 3.31%, from an estimated USD 581.1 Million in 2018. This growth is primarily attributed to the increasing emphasis on renewable resources, control & monitoring systems, industrial automation, electric vehicles, and increasing use of energy storage machines.
The report segments the current transducer market, by technology, into open loop and closed loop. The closed-loop segment is expected to have the largest market share by 2023. Closed-loop current transducers are costlier than open-loop current transducer, and they are technologically advanced, thereby attributing to the high market share during the forecast period.
The current transducer market, by application, is segmented into motor drive, battery management, SMPS & UPS, converter & inverter, and others. The converter & inverter segment is projected to be the fastest growing application segment during the forecast period. The adoption of renewable technology is driving the demand for the converter & inverter segment. The power generated through renewable sources are either stored or transferred to grid; in both the processes, converters & inverters are required for the conversion of power. The growth of renewable energy sources across the globe is driving the market for the converter & inverter segment.
The current transducer market, by end-user, is segmented into industrial, automotive, renewable, residential & commercial, and others. The renewable industry is estimated to be the fastest growing market for current transducers, from 2018 to 2023. This market is driven by the rise in alternative energy programs in Europe, Asia Pacific, and North America.
In this report, the current transducer market has been analyzed with respect to five regions, namely, North America, Europe, Asia Pacific, South America, and the Middle East & Africa.
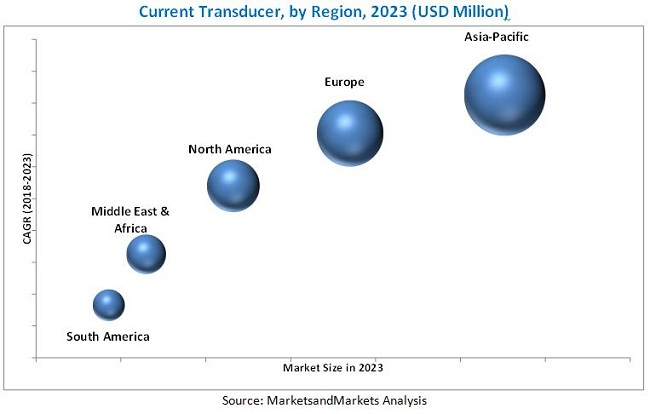
The market in Asia Pacific is estimated to be the largest in the current transducer market, from 2018 to 2023. Factors such as increasing adoption of renewable resources, electric vehicles, control & protecting systems, and industrial automation are driving the growth of current transducer market in the region.
The use of the integrated system could act as a restraint for the current transducer market. The leading players in the current transducer market include LEM (Switzerland), CR Magnetic (US), NK Technologies (US), Veris Industries (US), and Phoenix Contact (US). The new product launch was the most commonly adopted strategy by the top players.
To speak to our analyst for a discussion on the above findings, click Speak to Analyst
 Exclusive indicates content/data unique to MarketsandMarkets and not available with any competitors.
Table of Contents
1 Introduction (Page No. - 13)
1.1 Objectives of the Study
1.2 Definition
1.3 Market Scope
1.3.1 Market Segmentation
1.3.2 Regional Scope
1.3.3 Years Considered for the Study
1.4 Currency
1.5 Stakeholders
2 Research Methodology (Page No. - 17)
2.1 Research Data
2.1.1 Secondary Data
2.1.1.1 Key Secondary Sources
2.1.2 Primary Data
2.1.2.1 Key Data From Primary Sources
2.1.2.2 Key Industry Insight
2.1.2.3 Breakdown of Primaries
2.2 Market Size Estimation
2.2.1 Bottom-Up Approach
2.2.2 Top Down Approach
2.3 Market Breakdown & Data Triangulation
2.4 Research Assumption
3 Executive Summary (Page No. - 25)
4 Premium Insights (Page No. - 29)
4.1 Attractive Opportunities in the Current Transducer Market
4.2 Current Transducer Market, By Technology
4.3 Current Transducer Market, By Application
4.4 Current Transducer Market, By End-User
4.5 Asia Pacific Current Transducer Market: Technology & Country
4.6 Current Transducer Market, By Country
5 Market Overview (Page No. - 33)
5.1 Introduction
5.2 Market Dynamics
5.2.1 Drivers
5.2.1.1 Increasing Use of Battery-Powered Application and Renewable Energy
5.2.1.2 Technological Advancements in Current Transducer
5.2.1.3 High Cost Associated With Production Breakdown in the Industrial Segment
5.2.2 Restraints
5.2.2.1 Increasing Use of the Integrated Product
5.2.3 Opportunities
5.2.3.1 Increasing Demand for Eco-Friendly Electric and Hybrid Vehicles
5.2.3.2 Rising Demand for Control and Monitoring System Owing to Urbanization and Industrialization
6 Current Transducer Market, By Technology (Page No. - 37)
6.1 Introduction
6.2 Closed Loop
6.3 Open Loop
7 Current Transducer Market, By Application (Page No. - 41)
7.1 Introduction
7.2 Motor Drive
7.3 Converter & Inverter
7.4 Battery Management
7.5 UPS and SMPS
7.6 Others
8 Current Transducer Market, By End User (Page No. - 47)
8.1 Introduction
8.2 Industrial
8.2.1 Telecommunication
8.2.2 Machinery
8.2.3 Medical Equipment
8.2.4 Paper & Textile
8.2.5 Others
8.3 Commercial & Residential
8.4 Renewable Energy
8.5 Transportation & Automotive
8.6 Others
9 Current Transducer Market, By Region (Page No. - 58)
9.1 Introduction
9.2 Asia Pacific
9.2.1 China
9.2.2 India
9.2.3 South Korea
9.2.4 Japan
9.2.5 Australia
9.2.6 Rest of Asia Pacific
9.3 Europe
9.3.1 Germany
9.3.2 UK
9.3.3 Italy
9.3.4 Spain
9.3.5 France
9.3.6 Russia
9.3.7 Rest of Europe
9.4 North America
9.4.1 US
9.4.2 Canada
9.4.3 Mexico
9.5 South America
9.5.1 Brazil
9.5.2 Argentina
9.5.3 Rest of South America
9.6 Middle East & Africa
9.6.1 Saudi Arabia
9.6.2 UAE
9.6.3 Qatar
9.6.4 South Africa
9.6.5 Egypt
9.6.6 Rest of Middle East & Africa
10 Competitive Landscape (Page No. - 96)
10.1 Overview
10.2 Market Ranking of Players and Industry Concentration, 2017
10.3 Competitive Scenario
10.3.1 New Product Launches
10.3.2 Contracts & Agreements
11 Company Profiles (Page No. - 98)
(Business Overview, Products Offered, Recent Developments, MnM View)*
11.1 ABB
11.2 LEM
11.3 CR Magnetic
11.4 Veris Industries
11.5 Siemens
11.6 Hobut
11.7 IME
11.8 Texas Instrument
11.9 Phoenix Contact
11.10 Johnson Controls
11.11 NK Technologies
11.12 American Aerospace Control (CR)
11.13 Topstek
*Business Overview, Products Offered, Recent Developments, MnM View Might Not Be Captured in Case of Unlisted Companies.
12 Appendix (Page No. - 120)
12.1 Insights of Industry Experts
12.2 Discussion Guide
12.3 Knowledge Store: Marketsandmarkets� Subscription Portal
12.4 Introducing RT: Real-Time Market Intelligence
12.5 Available Customizations
12.6 Related Reports
12.7 Author Details
List of Tables (70 Tables)
Table 1 Current Transducer Market Snapshot
Table 2 Global Current Transducers Market Size, By Technology, 2016�2023 (USD Million)
Table 3 Closed Loop: Market Size, By Region, 2016-2023 (USD Million)
Table 4 Open Loop: Market Size, By Region, 2016�2023 (USD Million)
Table 5 Current Transducers Market Size, By Application, 2016�2023 (USD Million)
Table 6 Motor Drive: Market, By Region, 2016�2023 (USD Million)
Table 7 Converter & Inverter: Market, By Region, 2016�2023, (USD Million)
Table 8 Battery Management: Market, By Region, 2016�2023 (USD Million)
Table 9 UPS & SMPS: Market, By Region, 2016�2023 (USD Million)
Table 10 Others: Market, By Region, 2016�2023 (USD Million)
Table 11 Current Transducers Market Size, By End-User, 2016�2023 (USD Million)
Table 12 Industrial: Market Size, By Region, 2016�2023 (USD Million)
Table 13 Industrial: Market Size, By Application, 2016�2023 (USD Million)
Table 14 Telecommunication: Market Size, By Region, 2016�2023 (USD Thousand)
Table 15 Machinery: Market Size, By Region, 2016-2023 (USD Thousand)
Table 16 Medical Equipment: Market Size, By Region, 2016�2023 (USD Thousand)
Table 17 Paper & Textile: Market Size, By Region, 2016�2023 (USD Thousand)
Table 18 Others: Market Size, By Region, 2016-2023 (USD Thousand)
Table 19 Commercial & Residential: Market Size, By Region, 2016�2023 (USD Million)
Table 20 Renewable Energy: Market Size, By Region, 2016�2023 (USD Million)
Table 21 Transportation & Automotive: Market Size, By Region, 2016�2023 (USD Million)
Table 22 Others: Market Size, By Region, 2016�2023 (USD Million)
Table 23 Global Market Size, By Region, 2016�2023 (USD Million)
Table 24 Asia Pacific: Market Size, By Technology, 2016�2023 (USD Million)
Table 25 Asia Pacific: Market Size, By Application, 2016�2023 (USD Million)
Table 26 Asia Pacific: Market Size, By End-User, 2016�2023 (USD Million)
Table 27 Asia-Pacific: Market Size, By Country, 2016�2023 (USD Million)
Table 28 China: Market Size, By Application, 2016�2023 (USD Thousand)
Table 29 India: Market Size, By Application, 2016�2023 (USD Thousand)
Table 30 South Korea: Market Size, By Application, 2016�2023 (USD Thousand)
Table 31 Japan: Market Size, By Application, 2016�2023 (USD Thousand)
Table 32 Australia: Market Size, By Application, 2016�2023 (USD Thousand)
Table 33 Rest of Asia Pacific: Market Size, By Application, 2016�2023 (USD Thousand)
Table 34 Europe: Market Size, By Technology, 2016�2023 (USD Million)
Table 35 Europe: Market Size, By Application, 2016�2023 (USD Million)
Table 36 Europe: Market Size, By End-User, 2016�2023 (USD Million)
Table 37 Europe: Market Size, By Country, 2016�2023 (USD Million)
Table 38 Germany: Market Size, By Application, 2016�2023 (USD Thousand)
Table 39 UK: Market Size, By Application, 2016�2023 (USD Thousand)
Table 40 Italy: Market Size, By Application, 2016�2023 (USD Thousand)
Table 41 Spain: Market Size, By Application, 2016�2023 (USD Thousand)
Table 42 France: Market Size, By Application, 2016�2023 (USD Thousand)
Table 43 Russia: Market Size, By Application, 2016�2023 (USD Thousand)
Table 44 Rest of Europe: Market Size, By Application, 2016�2023 (USD Thousand)
Table 45 North America: Market Size, By Technology, 2016�2023 (USD Million)
Table 46 North America: Market Size, By Application, 2016�2023 (USD Million)
Table 47 North America: Market Size, By End-User, 2016�2023 (USD Million)
Table 48 North America: Market Size, By Country, 2016�2023 (USD Million)
Table 49 US: Market Size, By Application, 2016�2023 (USD Thousand)
Table 50 Canada: Market Size, By Application, 2016�2023 (USD Thousand)
Table 51 Mexico: Market Size, By Application, 2016�2023 (USD Thousand)
Table 52 South America: Market Size, By Technology, 2016�2023 (USD Million)
Table 53 South America: Current Transducer, By Application, 2016�2023 (USD Million)
Table 54 South America: Market Size, By End-User, 2016�2023 (USD Million)
Table 55 South America: Market Size, By Country, 2016�2023 (USD Million)
Table 56 Brazil: Market Size, By Application, 2016�2023 (USD Thousand)
Table 57 Argentina: Market Size, By Application, 2016�2023 (USD Thousand)
Table 58 Rest of South America: Market Size, By Application, 2016�2023 (USD Thousand)
Table 59 Middle East & Africa: Market Size, By Technology, 2016�2023 (USD Million)
Table 60 Middle East & Africa: Current Transducer, By Application, 2016�2023 (USD Million)
Table 61 Middle East & Africa: Market Size, By End-User, 2016�2023 (USD Million)
Table 62 Middle East & Africa: Market Size, By Country, 2016�2023 (USD Million)
Table 63 Saudi Arabia: Market Size, By Application, 2016�2023 (USD Thousand)
Table 64 UAE: Market Size, By Application, 2016�2023 (USD Thousand)
Table 65 Qatar: Market Size, By Application, 2016�2023 (USD Thousand)
Table 66 South Africa: Market Size, By Application, 2016�2023 (USD Thousand)
Table 67 Egypt: Market Size, By Application, 2016�2023 (USD Thousand)
Table 68 Rest of Middle East & Africa: Market Size, By Application, 2016�2023 (USD Thousand)
Table 69 New Product Launches, 2015�2017
Table 70 Contracts & Agreements, 2016�2017
List of Figures (32 Figures)
Figure 1 Current Transducer Market: Research Design
Figure 2 Breakdown of Primaries: By Company Type, Designation, and Region
Figure 3 Bottom-Up Approach
Figure 4 Top-Down Approach
Figure 5 Data Triangulation Methodology
Figure 6 Assumptions of the Research Study
Figure 7 Closed Loop Segment Led Current Transducers Market in 2017
Figure 8 Industrial Segment Dominates the Current Transducer During the Forecast Period
Figure 9 Battery Management Market is Estimated to Grow at the Highest CAGR During the Forecast Period
Figure 10 Asia Pacific Held the Largest Share of the Current Transducers Market in 2017
Figure 11 Growth in Renewable Energy, Electric Vehicle, and Battery-Supplied Applications is Driving the Current Transducers Market During the Forecast Period
Figure 12 Closed Loop Segment Dominate the Market in 2023
Figure 13 Motor Drive Segment is Expected to Dominate the Current Transducers Market, 2023
Figure 14 Industrial Segment is Expected to Dominate the Current Transducers Market, 2023
Figure 15 China Led the Asia Pacific Current Transducers Market in 2017
Figure 16 China & Germany are Expected to Be the Fastest Growing Current Transducers Markets During the Forecast Period
Figure 17 Market Dynamics for the Current Transducers Market
Figure 18 Top 6 Countries With Renewable Power Capacities in the World, 2016
Figure 19 New Electric Vehicle Registration in 2016
Figure 20 Closed Loop Segment is Estimated to Dominate the Current Transducers Market in 2017
Figure 21 Motor Drive Segment is Estimated to Dominate the Current Transducers Market During the Forecast Period
Figure 22 Industrial Segment is Estimated to Dominate the Current Transducers Market During the Forecast Period
Figure 23 Regional Snapshot: Current Transducers Market, 2018�2023
Figure 24 Asia Pacific: Current Transducers Market Snapshot
Figure 25 Europe: Current Transducers Market Snapshot
Figure 26 LEM Lead the Market for Current Transducers in 2017
Figure 27 Competitive Benchmarking
Figure 28 ABB: Company Snapshot
Figure 29 LEM: Company Snapshot
Figure 30 Siemens: Company Snapshot
Figure 31 Texas Instrument: Company Snapshot
Figure 32 Johnson Control: Company Snapshot


Growth opportunities and latent adjacency in Current Transducer Market