DC Torque Tool Market

DC Torque Tool Market by Handheld Tool (Nutrunners, Screwdrivers, Torque Wrenches, Impact Wrenches), Fixtured Tool, Power Source (Corded, Cordless), Control System (Transducer, Current), Industry and Region - Global Forecast to 2029

Report Code: SE 5571 Jun, 2024, by marketsandmarkets.com

[227 Pages Report] The global DC torque tool market size is estimated to be valued at USD 3.6 billion in 2024 and is anticipated to reach USD 4.4 billion by 2029, at a CAGR of 3.7% during the forecast period. The market growth is ascribed to technological advancements such as digital controls, torque sensors, and real-time monitoring capabilities enhance tool functionality and integration with smart manufacturing systems.

DC Torque Tool Market

DC Torque Tool Market

DC Torque Tool Market Forecast to 2029

To know about the assumptions considered for the study, Request for Free Sample Report

DC Torque Tool Market Trends

Driver: Surging demand for electric fastening tools for motor vehicles

The automobile industry holds approximately 50% of the DC torque tool market. The motor vehicle types includes passenger automobiles, light commercial vehicles, big trucks, buses, and coaches. Motor vehicle sales are increasing, which is driving the DC torque tool market. DC torque tools are utilised in a variety of automotive applications, including engine assembly, chassis assembly, body assembly, brake and seat installation, interior assembly, powertrain assembly and the final car assembly line. These tools also help in detecting defects early, such as faulty parts during the assembly operation in the automotive industry.

According to the International Organization of Motor Vehicle Manufacturers (OICA), sales in 2022 declined due to the COVID-19 pandemic, lockdowns, and supply chain disruptions. although, sales of all motor vehicles increased in 2023 by approximately 13% and which is expected to continue growing in the upcoming years due to increased demand, economic growth, advance car technology, and increased adoption of motor vehicles. Consequently, the automotive industry is anticipated to maintain its position as a key player in the DC torque tool market.

Restraint: High costs and safety risks associated with DC torque tools

DC torque tools should be kept from hazardous environments to prevent fires. These tools generate heat and can catch fire in hazardous environments. Hard conditions, such as high temperatures, high humidity, and exposure to corrosive substances, can affect the performance and lifespan of traditional torque tools. There is a risk of electrical shocks to the user in such harsh conditions, which effect the tool functionality and increases maintenance complexity and safety risks.

Maintenance becomes more frequent and challenging in remote or hazardous locations, requiring specialized equipment and expertise. Therefore, these tools are not suitable for wet workplaces. Heavy power tools can cause wrist injuries due to torque reactions. Prolonged usage of fastening tools may lead to overheating, and transducer fastening tools require regular calibration.

Additionally, brushed tools need periodic replacement. DC torque tools are more expensive than other fastening tools and sensitive to specific applications. All these factors have an adverse impact on the growth of the electric fastening systems market.

Opportunity: Increasing demand for smart and connected DC torque tools

The demand for smart and connected DC torque tools to enhance functionality, efficiency, and data-driven insights has increased across various industries. With the rise of Industry 4.0 and the Internet of Things (IoT), there is a greater emphasis on integrating digital technology into industrial processes to improve performance and productivity.

Smart and connected DC torque tools use sensors, wireless connectivity, and data analytics capabilities to provide advanced features including real-time monitoring, remote control, and predictive maintenance. These instruments enable producers to collect useful information on torque application processes, such as torque levels, angle measurements, and fastening sequences. This information can be used to optimise assembly processes, identify possible difficulties before they become major problems, and ensure quality standards are met.

Furthermore, remotely monitoring and controlling torque tools improves operational flexibility and efficiency, particularly in large-scale production facilities or remote work environments. Smart and connected DC torque tools also allow for easy integration with larger industrial systems, such as manufacturing execution systems (MES) or enterprise resource planning (ERP) software, resulting in smooth data interchange and process automation. This connectivity streamlines production operations, improves traceability, and allows for real-time decision-making.

Challenge: Overheating and duty cycle constraints in high-torque operations

DC torque tools face challenges with overheating and duty cycle constraints, especially during continuous or high-torque operations. Continuous use can cause the electric motor and other components to overheat, resulting in damage or diminished performance. Extreme heating can damage motors, reduce tool performance, and pose safety risks to operators, especially in safety-critical industries like automotive assembly and aerospace production.

Manufacturers address these issues by incorporating thermal management features, duty cycle constraints, and advanced monitoring systems to regulate heat and prevent overheating. By adhering to usage recommendations and employing effective heat management measures, manufacturers can uphold the reliability, longevity, and safety of their DC torque tools in demanding industrial environments.

DC Torque Tool Market Ecosystem

DC Torque Tool Market by Ecosystem

The handheld tool segment accounted for the largest share of the DC torque tool market in 2023.

Tool type is segmented into handheld tools and fixtured tools. handheld tools further segmented in to electric nutrunners, electric screwdrivers, electric torque wrenches, electric impact wrenches. These tools are designed for applying precise torque to bolts and nuts. These tools are known for their ergonomic designs and lightweight construction, which help to reduce operator fatigue during assembly and maintenance operations. Handheld tools provide changeable torque settings via digital or analogue controls, ensuring precise fastening without over- or under-torquing. Handheld DC torque tools are versatile and ideal for various industries, including automotive, aerospace, consumer electronics & appliances, energy, shipbuilding, construction and more. They enable consistent torque application, which is critical for preserving product quality and safety. They frequently use rechargeable batteries for mobility and may contain digital screens for real-time monitoring and data logging, which improves workflow efficiency and traceability in industrial environments.

The Corded power source segment is to dominate the market sharein 2023.

The power source segmented into corded and cordless. Corded DC torque tools hold largest market share in 2023. Corded tools are generally cheaper to purchase compared to cordless options. Corded DC torque tools are widely utilised in industrial applications due to their dependability, consistent performance, and constant power supply. These tools are preferred for heavy-duty applications demanding high torque levels, since they provide durability and lifespan in harsh settings. Corded tools continue to dominate the torque tool industry due to their steady power and sturdy performance.

The transducer control tools segment is to hold the largest market share during the forecast period.

The DC torque tool market is segmented into transducer and current control tools. DC torque tools with control systems offer precise tightening compared with traditional manual fastening system. Transducer control tools use a sensor to directly measure the applied torque and shut off the motor when the desired level is reached. These tools are incorporate a built-in torque transducer in DC torque tool, that measures the applied torque in real time, offering immediate feedback to the control system. This allows for accurate, closed-loop control, consistently achieving the desired torque and preventing over-torquing and under-torquing. This makes them ideal for industries, such as automotive and aerospace manufacturing, where precise torque control is critical for the quality and safety of assembled products.

Automotive industry will grow at the highest CAGR during the forecast period.

The DC torque tools are widely used in the automotive industry for tasks, such as engine assembly, chassis construction, and installing electronic components in electric vehicles. The shift towards electric vehicles (EVs) is a major driver, needing accurate torque tools for assembling battery packs, motors, and electronic components critical to performance and safety. Automotive manufacturers are adopting modern manufacturing techniques that rely largely on automation and digitalization, with DC torque tools ensuring constant torque application, reducing assembly times, and increasing overall production efficiency. The industry's growing vehicle production, combined with advancements in lightweight materials such as composites and alloys, highlights the importance of DC torque tools in properly handling these materials during assembly.

Asia Pacific region to grow at the highest CAGR during the forecast period.

The Asia Pacific region is segmented into China, Japan, India, and the Rest of Asia Pacific. The Asia Pacific region is a significant raw material manufacturing hub for consumer electronics, automotive, pharmaceuticals, and healthcare applications, representing a fast-growing market for DC torque tools. The economies of India and China are the fastest-growing economies in the world. The rapid industrialization and urbanization happening in China, India, and South-East Asian countries raise the demand for automation solutions across end-user industries such as manufacturing and assembly. In India, rapid growth of industrialization coupled with expansion in the manufacturing sector increased the demand for precision tools. In addition, initiatives taken by the Government of India, that includes Make in India, Skill India, and 100 Smart Cities Mission, are projected to further accelerate this growth.

DC Torque Tool Market by Region

DC Torque Tool Market by Region

To know about the assumptions considered for the study, download the pdf brochure

Key Market Players

The major companies in the DC torque tool companies are are Atlas Copco AB (Sweden) Apex Tool Group, LLC (US), Ingersoll Rand (US), Stanley Black & Decker, Inc. (US), Robert Bosch GmbH (Germany), and others. These companies have used both organic and inorganic growth strategies, such as product launches, acquisitions, and partnerships to strengthen their position in the DC torque tool market.

Get online access to the report on the World's First Market Intelligence Cloud

  • Easy to Download Historical Data & Forecast Numbers
  • Company Analysis Dashboard for high growth potential opportunities
  • Research Analyst Access for customization & queries
  • Competitor Analysis with Interactive dashboard
  • Latest News, Updates & Trend analysis
Request Sample

Scope of the Report

Report Metric

Details

Years Considered

2020–2029

Base year considered

2023

Forecast period

2024–2029

Forecast units

Value (USD million/billion)

Segments Covered

Tool Type, Power Source, Control System, Industry and Region

Regions covered

North America, Asia Pacific, Europe, and Rest of the World

Companies covered

Atlas Copco AB (Sweden); Apex Tool Group, LLC (US); Ingersoll Rand (US); Stanley Black & Decker, Inc. (US); Robert Bosch GmbH (Germany); Techtronic Industries Co. Ltd. (Hong Kong); Hilti Corporation (Liechtenstein); and Makita Corporation (Japan). Total 25 companies profiled.

DC Torque Tool Market Highlights

In this report, the overall DC torque tool market has been segmented based on Tool Type, Power Source, Control System, Industry and Region.

Segment

Subsegment

By Tool Type

  • Handheld Tools
    • Electric Nutrunners
    • Electric Screwdrivers
    • Electric Torque Wrenches
    • Electric Impact Wrenches
    • Other Handheld Tools
      • Controllers and Software
  • Fixtured Tools

By Power Source

  • Corded
  • Cordless

By Control System

  • Transducer Control Tools
  • Current Control Tools

By Industry

  • Automotive
  • Aerospace
  • Consumer Electronics & Appliances
  • Energy
  • Shipbuilding
  • Other Industries

By Region

  • North America
    • US
    • Canada
    • Mexico
  • Europe
    • Germany
    • France
    • UK
    • Spain
    • Rest of Europe
  • Asia Pacific
    • China
    • Japan
    • India
    • Rest of Asia Pacific
  • Rest of the World
    • South America
    • Middle East
    • Africa

Recent Developments

  • In March 2024 Chicago Pneumatic (a brand of Atlas Copco AB) launched the CP8609 series of eBlueTork battery-operated torque wrenches, ideal for fast and accurate tire changes on large commercial vehicles, including trucks and buses. These tools enhance operator safety, traceability, and productivity in nutrunning operations, building on the success of the CP86 series.
  • In July 2023, DEWALT, a subsidiary of Stanley Black & Decker, Inc., announced the new FLEXTORQ Screwdriving Bit. These FLEXTORQ PH2 bits drive 100% more screws per bit, while the bits for use with T20 to T40 size fasteners deliver from 2X up to 5X superior fit.

Frequently Asked Questions (FAQs):

To speak to our analyst for a discussion on the above findings, click Speak to Analyst

TABLE OF CONTENTS
 
1 INTRODUCTION (Page No. - 31)
    1.1 STUDY OBJECTIVES 
    1.2 MARKET DEFINITION 
    1.3 STUDY SCOPE 
           1.3.1 MARKETS COVERED
                    FIGURE 1 DC TORQUE TOOL MARKET SEGMENTATION
           1.3.2 INCLUSIONS AND EXCLUSIONS
           1.3.3 REGIONAL SCOPE
           1.3.4 YEARS CONSIDERED
    1.4 CURRENCY CONSIDERED 
    1.5 UNITS CONSIDERED 
    1.6 STAKEHOLDERS 
    1.7 SUMMARY OF CHANGES 
    1.8 IMPACT OF RECESSION 
 
2 RESEARCH METHODOLOGY (Page No. - 36)
    2.1 RESEARCH DATA 
           FIGURE 2 DC TORQUE TOOL MARKET: RESEARCH DESIGN
           2.1.1 SECONDARY DATA
                    2.1.1.1 List of key secondary sources
                    2.1.1.2 Key data from secondary sources
           2.1.2 PRIMARY DATA
                    2.1.2.1 Breakdown of primaries
                    2.1.2.2 List of primary interview participants
                    2.1.2.3 Key data from primary sources
                    2.1.2.4 Key industry insights
           2.1.3 SECONDARY AND PRIMARY RESEARCH
    2.2 MARKET SIZE ESTIMATION METHODOLOGY 
           2.2.1 BOTTOM-UP APPROACH
                    2.2.1.1 Approach to arrive at market size using bottom-up analysis (demand side)
                               FIGURE 3 DC TORQUE TOOL MARKET: BOTTOM-UP APPROACH
           2.2.2 TOP-DOWN APPROACH
                    2.2.2.1 Approach to arrive at market size using top-down analysis (supply side)
                               FIGURE 4 DC TORQUE TOOL MARKET: TOP-DOWN APPROACH
                               FIGURE 5 DC TORQUE TOOL MARKET SIZE ESTIMATION METHODOLOGY
    2.3 MARKET BREAKDOWN AND DATA TRIANGULATION 
           FIGURE 6 DC TORQUE TOOL MARKET: DATA TRIANGULATION
    2.4 RESEARCH ASSUMPTIONS 
           FIGURE 7 DC TORQUE TOOL MARKET: RESEARCH ASSUMPTIONS
    2.5 RISK ASSESSMENT 
           FIGURE 8 DC TORQUE TOOL MARKET: RISK ASSESSMENT
    2.6 PARAMETERS CONSIDERED TO ANALYZE RECESSION IMPACT ON DC TORQUE TOOL MARKET 
           TABLE 1 PARAMETERS CONSIDERED TO ANALYZE RECESSION IMPACT ON DC TORQUE TOOL MARKET
    2.7 RESEARCH LIMITATIONS 
 
3 EXECUTIVE SUMMARY (Page No. - 47)
    FIGURE 9 DC TORQUE TOOL MARKET SIZE, 2020−2029 (USD MILLION)
    FIGURE 10 HANDHELD TOOLS TO ACCOUNT FOR LARGER MARKET SHARE IN 2029
    FIGURE 11 CORDED SEGMENT HELD LARGER MARKET SHARE IN 2023
    FIGURE 12 TRANSDUCER CONTROL TOOLS TO DOMINATE MARKET DURING FORECAST PERIOD
    FIGURE 13 AUTOMOTIVE SEGMENT TO RECORD HIGHEST CAGR BETWEEN 2024 AND 2029
    FIGURE 14 ASIA PACIFIC TO EXHIBIT HIGHEST CAGR IN GLOBAL DC TORQUE TOOL MARKET FROM 2024 TO 2029
 
4 PREMIUM INSIGHTS (Page No. - 51)
    4.1 ATTRACTIVE OPPORTUNITIES FOR PLAYERS IN DC TORQUE TOOL MARKET 
           FIGURE 15 RAPID INDUSTRIALIZATION AND ECONOMIC GROWTH TO CREATE LUCRATIVE OPPORTUNITIES FOR PLAYERS IN DC TORQUE TOOL MARKET
    4.2 DC TORQUE TOOL MARKET, BY HANDHELD TOOL 
           FIGURE 16 ELECTRIC TORQUE WRENCHES SEGMENT TO HOLD LARGEST MARKET SHARE IN 2024
    4.3 DC TORQUE TOOL MARKET, BY CONTROL SYSTEM 
           FIGURE 17 TRANSDUCER CONTROL TOOLS HELD LARGER SHARE OF DC TORQUE TOOL MARKET IN 2023
    4.4 DC TORQUE TOOL MARKET, BY INDUSTRY 
           FIGURE 18 AUTOMOTIVE SEGMENT TO DOMINATE DC TORQUE TOOL MARKET DURING FORECAST PERIOD
    4.5 DC TORQUE TOOL MARKET, BY COUNTRY 
           FIGURE 19 INDIA TO WITNESS HIGHEST CAGR IN GLOBAL DC TORQUE TOOL MARKET FROM 2024 TO 2029
 
5 MARKET OVERVIEW (Page No. - 54)
    5.1 INTRODUCTION 
    5.2 MARKET DYNAMICS 
           FIGURE 20 DC TORQUE TOOL MARKET: DRIVERS, RESTRAINTS, OPPORTUNITIES, AND CHALLENGES
           5.2.1 DRIVERS
                    5.2.1.1 Rising automation and data exchange in manufacturing sector
                    5.2.1.2 Growing emphasis on precise torque measurements to meet stringent aviation standards
                    5.2.1.3 Surging demand for electric fastening tools for motor vehicles
                               FIGURE 21 MOTOR VEHICLE SALES, 2019–2023 (MILLION UNITS)
                    5.2.1.4 Rapid infrastructure development and industrialization in emerging economies
                               FIGURE 22 IMPACT ANALYSIS: DRIVERS
           5.2.2 RESTRAINTS
                    5.2.2.1 High costs and safety risks associated with DC torque tools
                               FIGURE 23 IMPACT ANALYSIS: RESTRAINTS
           5.2.3 OPPORTUNITIES
                    5.2.3.1 Increasing demand for smart and connected DC torque tools
                    5.2.3.2 Growing preference for renewable energy
                               FIGURE 24 GLOBAL WIND POWER INSTALLATION CAPACITY, 2016–2022 (GW)
                               FIGURE 25 IMPACT ANALYSIS: OPPORTUNITIES
           5.2.4 CHALLENGES
                    5.2.4.1 Overheating and duty cycle constraints in high-torque operations
                    5.2.4.2 Staying complaint with existing trade policies and safety regulations
                               FIGURE 26 IMPACT ANALYSIS: CHALLENGES
    5.3 TRENDS/DISRUPTIONS IMPACTING CUSTOMERS’ BUSINESSES 
           FIGURE 27 TRENDS/DISRUPTIONS IMPACTING CUSTOMERS’ BUSINESSES
    5.4 PRICING ANALYSIS 
           5.4.1 AVERAGE SELLING PRICE TREND, BY HANDHELD TOOL
                    FIGURE 28 AVERAGE SELLING PRICE TREND, BY HANDHELD TOOL, 2020−2023 (USD)
           5.4.2 AVERAGE SELLING PRICE TREND OF KEY PLAYERS, BY HANDHELD TOOL
                    FIGURE 29 AVERAGE SELLING PRICE TREND OF DC TORQUE HANDHELD TOOLS OFFERED BY KEY PLAYERS (USD)
                    TABLE 2 AVERAGE SELLING PRICE TREND OF DC TORQUE HANDHELD TOOLS OFFERED BY KEY PLAYERS (USD)
           5.4.3 INDICATIVE PRICING TREND, BY REGION
                    FIGURE 30 INDICATIVE PRICING TREND OF HANDHELD TOOLS, BY REGION, 2021–2023 (USD)
                    TABLE 3 INDICATIVE PRICING TREND OF HANDHELD TOOLS, BY REGION, 2021–2023 (USD)
    5.5 VALUE CHAIN ANALYSIS 
           FIGURE 31 VALUE CHAIN ANALYSIS
    5.6 ECOSYSTEM ANALYSIS 
           FIGURE 32 ECOSYSTEM ANALYSIS
           TABLE 4 ROLE OF COMPANIES IN DC TORQUE TOOL ECOSYSTEM
    5.7 TECHNOLOGY ANALYSIS 
           5.7.1 KEY TECHNOLOGIES
                    5.7.1.1 Electric motors
                    5.7.1.2 Torque-sensing and control systems
           5.7.2 COMPLEMENTARY TECHNOLOGIES
                    5.7.2.1 Industry 4.0 and Internet of Things (IoT)
                    5.7.2.2 Ergonomics and human–machine interface (HMI)
                    5.7.2.3 Data analytics and cloud computing
           5.7.3 ADJACENT TECHNOLOGIES
                    5.7.3.1 Precision engineering and manufacturing
                    5.7.3.2 Material science
    5.8 PATENT ANALYSIS 
           FIGURE 33 PATENTS APPLIED AND GRANTED, 2014–2023
           TABLE 5 LIST OF PATENTS, 2021–2024
    5.9 TRADE ANALYSIS 
           5.9.1 IMPORT SCENARIO (HS CODE 846729)
                    FIGURE 34 IMPORT DATA FOR HS CODE 846729-COMPLIANT PRODUCTS, BY COUNTRY, 2019−2023 (USD MILLION)
           5.9.2 EXPORT SCENARIO (HS CODE 846729)
                    FIGURE 35 EXPORT DATA FOR HS CODE 846729-COMPLIANT PRODUCTS, BY COUNTRY, 2019−2023 (USD MILLION)
    5.10 KEY CONFERENCES AND EVENTS, 2024–2025 
           TABLE 6 LIST OF KEY CONFERENCES AND EVENTS, 2024–2025
    5.11 CASE STUDY ANALYSIS 
           5.11.1 BERGSTROM INC. INTEGRATES MOUNTZ ERROR-PROOFING TOOLS TO ENSURE PRECISION AND RELIABILITY IN AUTOMOTIVE MANUFACTURING
           5.11.2 ATLAS COPCO GROUP RECOMMENDS CUSTOMERS TO IMPLEMENT ELECTRIC DC TORQUE TOOLS TO ADDRESS FASTENING ISSUES
           5.11.3 TOYOTA MOTOR CORPORATION IMPLEMENTS ENCORE SYSTEMS’ DC TORQUE TOOLS TO IMPROVE AUTOMOTIVE ASSEMBLY
    5.12 TARIFF AND REGULATORY LANDSCAPE 
           5.12.1 TARIFF ANALYSIS
                    TABLE 7 MFN TARIFF FOR HS CODE 846729-COMPLIANT PRODUCTS EXPORTED BY US, 2023
           5.12.2 REGULATORY BODIES, GOVERNMENT AGENCIES, AND OTHER ORGANIZATIONS
                    TABLE 8 NORTH AMERICA: LIST OF REGULATORY BODIES, GOVERNMENT AGENCIES, AND OTHER ORGANIZATIONS
                    TABLE 9 EUROPE: LIST OF REGULATORY BODIES, GOVERNMENT AGENCIES, AND OTHER ORGANIZATIONS
                    TABLE 10 ASIA PACIFIC: LIST OF REGULATORY BODIES, GOVERNMENT AGENCIES, AND OTHER ORGANIZATIONS
                    TABLE 11 ROW: LIST OF REGULATORY BODIES, GOVERNMENT AGENCIES, AND OTHER ORGANIZATIONS
           5.12.3 STANDARDS
                    TABLE 12 STANDARDS RELATED TO DC TORQUE TOOLS
    5.13 PORTER’S FIVE FORCES ANALYSIS 
           FIGURE 36 PORTER’S FIVE FORCES ANALYSIS
           TABLE 13 PORTER’S FIVE FORCES ANALYSIS
           5.13.1 INTENSITY OF COMPETITIVE RIVALRY
           5.13.2 BARGAINING POWER OF SUPPLIERS
           5.13.3 BARGAINING POWER OF BUYERS
           5.13.4 THREAT OF SUBSTITUTES
           5.13.5 THREAT OF NEW ENTRANTS
    5.14 KEY STAKEHOLDERS AND BUYING CRITERIA 
           5.14.1 KEY STAKEHOLDERS IN BUYING PROCESS
                    FIGURE 37 INFLUENCE OF STAKEHOLDERS ON BUYING PROCESS FOR TOP THREE INDUSTRIES
                    TABLE 14 INFLUENCE OF STAKEHOLDERS ON BUYING PROCESS FOR TOP THREE INDUSTRIES (%)
           5.14.2 BUYING CRITERIA
                    FIGURE 38 KEY BUYING CRITERIA FOR TOP THREE INDUSTRIES
                    TABLE 15 KEY BUYING CRITERIA FOR TOP THREE INDUSTRIES
 
6 DC TORQUE TOOL MARKET, BY TOOL TYPE (Page No. - 85)
    6.1 INTRODUCTION 
           FIGURE 39 DC TORQUE TOOL MARKET, BY TOOL TYPE
           FIGURE 40 HANDHELD TOOLS SEGMENT TO WITNESS HIGHER CAGR FROM 2024 TO 2029
           TABLE 16 DC TORQUE TOOL MARKET, BY TOOL TYPE, 2020–2023 (USD MILLION)
           TABLE 17 DC TORQUE TOOL MARKET, BY TOOL TYPE, 2024–2029 (USD MILLION)
    6.2 HANDHELD TOOLS 
           TABLE 18 HANDHELD TOOLS: DC TORQUE TOOL MARKET, BY TYPE, 2020–2023 (USD MILLION)
           TABLE 19 HANDHELD TOOLS: DC TORQUE TOOL MARKET, BY TYPE, 2024–2029 (USD MILLION)
           TABLE 20 HANDHELD TOOLS: DC TORQUE TOOL MARKET, BY TYPE, 2020–2023 (THOUSAND UNITS)
           TABLE 21 HANDHELD TOOLS: DC TORQUE TOOL MARKET, BY TYPE, 2024–2029 (THOUSAND UNITS)
           TABLE 22 HANDHELD TOOLS: DC TORQUE TOOL MARKET, BY INDUSTRY, 2020–2023 (USD MILLION)
           TABLE 23 HANDHELD TOOLS: DC TORQUE TOOL MARKET, BY INDUSTRY, 2024–2029 (USD MILLION)
           TABLE 24 HANDHELD TOOLS: DC TORQUE TOOL MARKET, BY REGION, 2020–2023 (USD MILLION)
           TABLE 25 HANDHELD TOOLS: DC TORQUE TOOL MARKET, BY REGION, 2024–2029 (USD MILLION)
           6.2.1 ELECTRIC NUTRUNNERS
                    6.2.1.1 Accuracy and low energy consumption attributes to foster segmental growth
                               TABLE 26 ELECTRIC NUTRUNNERS: DC TORQUE TOOL MARKET, BY INDUSTRY, 2020–2023 (USD MILLION)
                               TABLE 27 ELECTRIC NUTRUNNERS: DC TORQUE TOOL MARKET, BY INDUSTRY, 2024–2029 (USD MILLION)
           6.2.2 ELECTRIC SCREWDRIVERS
                    6.2.2.1 Need for quality assurance services to meet regulatory requirements to augment segmental growth
                               TABLE 28 ELECTRIC SCREWDRIVERS: DC TORQUE TOOL MARKET, BY INDUSTRY, 2020–2023 (USD MILLION)
                               TABLE 29 ELECTRIC SCREWDRIVERS: DC TORQUE TOOL MARKET, BY INDUSTRY, 2024–2029 (USD MILLION)
           6.2.3 ELECTRIC TORQUE WRENCHES
                    6.2.3.1 Integration into automated assembly systems for manufacturing process optimization to drive market
                               TABLE 30 ELECTRIC TORQUE WRENCHES: DC TORQUE TOOL MARKET, BY INDUSTRY, 2020–2023 (USD MILLION)
                               TABLE 31 ELECTRIC TORQUE WRENCHES: DC TORQUE TOOL MARKET, BY INDUSTRY, 2024–2029 (USD MILLION)
           6.2.4 ELECTRIC IMPACT WRENCHES
                    6.2.4.1 Ease of use and operation to contribute to segmental growth
                               TABLE 32 ELECTRIC IMPACT WRENCHES: DC TORQUE TOOL MARKET, BY INDUSTRY, 2020–2023 (USD MILLION)
                               TABLE 33 ELECTRIC IMPACT WRENCHES: DC TORQUE TOOL MARKET, BY INDUSTRY, 2024–2029 (USD MILLION)
           6.2.5 OTHER HANDHELD TOOLS
                    TABLE 34 OTHER HANDHELD TOOLS: DC TORQUE TOOL MARKET, BY INDUSTRY, 2020–2023 (USD MILLION)
                    TABLE 35 OTHER HANDHELD TOOLS: DC TORQUE TOOL MARKET, BY INDUSTRY, 2024–2029 (USD MILLION)
    6.3 FIXTURED TOOLS 
           6.3.1 REQUIREMENT FOR ACCURATE TORQUE TOOLS IN AUTOMOTIVE ASSEMBLY LINES TO ACCELERATE SEGMENTAL GROWTH
                    TABLE 36 FIXTURED TOOLS: DC TORQUE TOOL MARKET, BY INDUSTRY, 2020–2023 (USD MILLION)
                    TABLE 37 FIXTURED TOOLS: DC TORQUE TOOL MARKET, BY INDUSTRY, 2024–2029 (USD MILLION)
                    TABLE 38 FIXTURED TOOLS: DC TORQUE TOOL MARKET, BY REGION, 2020–2023 (USD MILLION)
                    TABLE 39 FIXTURED TOOLS: DC TORQUE TOOL MARKET, BY REGION, 2024–2029 (USD MILLION)
 
7 DC TORQUE TOOL MARKET, BY POWER SOURCE (Page No. - 98)
    7.1 INTRODUCTION 
           FIGURE 41 DC TORQUE TOOL MARKET, BY POWER SOURCE
           FIGURE 42 CORDLESS SEGMENT TO EXHIBIT HIGHER CAGR BETWEEN 2024 AND 2029
           TABLE 40 DC TORQUE TOOL MARKET, BY POWER SOURCE, 2020–2023 (USD MILLION)
           TABLE 41 DC TORQUE TOOL MARKET, BY POWER SOURCE, 2024–2029 (USD MILLION)
    7.2 CORDED TOOLS 
           7.2.1 USE IN HEAVY-DUTY APPLICATIONS REQUIRING HIGH TORQUE TO BOOST SEGMENTAL GROWTH
    7.3 CORDLESS TOOLS 
           7.3.1 ADVANCES IN BATTERY TECHNOLOGY TO FACILITATE SEGMENTAL GROWTH
 
8 DC TORQUE TOOL MARKET, BY CONTROL SYSTEM (Page No. - 102)
    8.1 INTRODUCTION 
           FIGURE 43 DC TORQUE TOOL MARKET, BY CONTROL SYSTEM
           FIGURE 44 TRANSDUCER CONTROL TOOLS SEGMENT TO REGISTER HIGHER CAGR FROM 2024 TO 2029
           TABLE 42 DC TORQUE TOOL MARKET, BY CONTROL SYSTEM, 2020–2023 (USD MILLION)
           TABLE 43 DC TORQUE TOOL MARKET, BY CONTROL SYSTEM, 2024–2029 (USD MILLION)
    8.2 TRANSDUCER CONTROL TOOLS 
           8.2.1 REQUIREMENT FOR PRECISE TORQUE CONTROL IN AUTOMOTIVE AND AEROSPACE MANUFACTURING TO FUEL SEGMENTAL GROWTH
                    TABLE 44 TRANSDUCER CONTROL TOOLS: DC TORQUE TOOL MARKET, BY REGION, 2020–2023 (USD MILLION)
                    TABLE 45 TRANSDUCER CONTROL TOOLS: DC TORQUE TOOL MARKET, BY REGION, 2024–2029 (USD MILLION)
    8.3 CURRENT CONTROL TOOLS 
           8.3.1 EASE OF USE AND LOW MAINTENANCE REQUIREMENTS TO AUGMENT SEGMENTAL GROWTH
                    TABLE 46 CURRENT CONTROL TOOLS: DC TORQUE TOOL MARKET, BY REGION, 2020–2023 (USD MILLION)
                    TABLE 47 CURRENT CONTROL TOOLS: DC TORQUE TOOL MARKET, BY REGION, 2024–2029 (USD MILLION)
 
9 DC TORQUE TOOL MARKET, BY INDUSTRY (Page No. - 107)
    9.1 INTRODUCTION 
           FIGURE 45 DC TORQUE TOOL MARKET, BY INDUSTRY
           FIGURE 46 AUTOMOTIVE INDUSTRY TO WITNESS HIGHEST CAGR DURING FORECAST PERIOD
           TABLE 48 DC TORQUE TOOL MARKET, BY INDUSTRY, 2020–2023 (USD MILLION)
           TABLE 49 DC TORQUE TOOL MARKET, BY INDUSTRY, 2024–2029 (USD MILLION)
    9.2 AUTOMOTIVE 
           9.2.1 GROWING EMPHASIS ON SMART MANUFACTURING AND AUTOMATION TO BOOST SEGMENTAL GROWTH
                    FIGURE 47 GLOBAL PASSENGER VEHICLE SALES, 2019–2023 (MILLION UNITS)
                    FIGURE 48 GLOBAL COMMERCIAL VEHICLE SALES, 2019–2023 (MILLION UNITS)
                    TABLE 50 AUTOMOTIVE: DC TORQUE TOOL MARKET, BY TOOL TYPE, 2020–2023 (USD MILLION)
                    TABLE 51 AUTOMOTIVE: DC TORQUE TOOL MARKET, BY TOOL TYPE, 2024–2029 (USD MILLION)
                    TABLE 52 AUTOMOTIVE: DC TORQUE TOOL MARKET FOR HANDHELD TOOLS, BY TYPE, 2020–2023 (USD MILLION)
                    TABLE 53 AUTOMOTIVE: DC TORQUE TOOL MARKET FOR HANDHELD TOOLS, BY TYPE, 2024–2029 (USD MILLION)
                    TABLE 54 AUTOMOTIVE: DC TORQUE TOOL MARKET, BY REGION, 2020–2023 (USD MILLION)
                    TABLE 55 AUTOMOTIVE: DC TORQUE TOOL MARKET, BY REGION, 2024–2029 (USD MILLION)
    9.3 AEROSPACE 
           9.3.1 INCREASING NEED TO COMPLY WITH STRINGENT SAFETY STANDARDS TO CONTRIBUTE TO SEGMENTAL GROWTH
                    TABLE 56 AEROSPACE: DC TORQUE TOOL MARKET, BY TOOL TYPE, 2020–2023 (USD MILLION)
                    TABLE 57 AEROSPACE: DC TORQUE TOOL MARKET, BY TOOL TYPE, 2024–2029 (USD MILLION)
                    TABLE 58 AEROSPACE: DC TORQUE TOOL MARKET FOR HANDHELD TOOLS, BY TYPE, 2020–2023 (USD MILLION)
                    TABLE 59 AEROSPACE: DC TORQUE TOOL MARKET FOR HANDHELD TOOLS, BY TYPE, 2024–2029 (USD MILLION)
                    TABLE 60 AEROSPACE: DC TORQUE TOOL MARKET, BY REGION, 2020–2023 (USD MILLION)
                    TABLE 61 AEROSPACE: DC TORQUE TOOL MARKET, BY REGION, 2024–2029 (USD MILLION)
    9.4 CONSUMER ELECTRONICS & APPLIANCES 
           9.4.1 RISING FOCUS ON PREVENTING MALFUNCTIONS AND FIRE HAZARDS TO FOSTER SEGMENTAL GROWTH
                    TABLE 62 CONSUMER ELECTRONICS & APPLIANCES: DC TORQUE TOOL MARKET, BY TOOL TYPE, 2020–2023 (USD MILLION)
                    TABLE 63 CONSUMER ELECTRONICS & APPLIANCES: DC TORQUE TOOL MARKET, BY TOOL TYPE, 2024–2029 (USD MILLION)
                    TABLE 64 CONSUMER ELECTRONICS & APPLIANCES: DC TORQUE TOOL MARKET FOR HANDHELD TOOLS, BY TYPE, 2020–2023 (USD MILLION)
                    TABLE 65 CONSUMER ELECTRONICS & APPLIANCES: DC TORQUE TOOL MARKET FOR HANDHELD TOOLS, BY TYPE, 2024–2029 (USD MILLION)
                    TABLE 66 CONSUMER ELECTRONICS & APPLIANCES: DC TORQUE TOOL MARKET, BY REGION, 2020–2023 (USD MILLION)
                    TABLE 67 CONSUMER ELECTRONICS & APPLIANCES: DC TORQUE TOOL MARKET, BY REGION, 2024–2029 (USD MILLION)
    9.5 ENERGY 
           9.5.1 GROWING COMPLEXITY OF POWER GENERATION TO FUEL SEGMENTAL GROWTH
                    TABLE 68 ENERGY: DC TORQUE TOOL MARKET, BY TOOL TYPE, 2020–2023 (USD MILLION)
                    TABLE 69 ENERGY: DC TORQUE TOOL MARKET, BY TOOL TYPE, 2024–2029 (USD MILLION)
                    TABLE 70 ENERGY: DC TORQUE TOOL MARKET FOR HANDHELD TOOLS, BY TYPE, 2020–2023 (USD MILLION)
                    TABLE 71 ENERGY: DC TORQUE TOOL MARKET FOR HANDHELD TOOLS, BY TYPE, 2024–2029 (USD MILLION)
                    TABLE 72 ENERGY: DC TORQUE TOOL MARKET, BY REGION, 2020–2023 (USD MILLION)
                    TABLE 73 ENERGY: DC TORQUE TOOL MARKET, BY REGION, 2024–2029 (USD MILLION)
    9.6 SHIPBUILDING 
           9.6.1 RAPID TECHNOLOGICAL INNOVATION AND DESIGN OPTIMIZATION TO ACCELERATE SEGMENTAL GROWTH
                    TABLE 74 SHIPBUILDING: DC TORQUE TOOL MARKET, BY TOOL TYPE, 2020–2023 (USD MILLION)
                    TABLE 75 SHIPBUILDING: DC TORQUE TOOL MARKET, BY TOOL TYPE, 2024–2029 (USD MILLION)
                    TABLE 76 SHIPBUILDING: DC TORQUE TOOL MARKET FOR HANDHELD TOOLS, BY TYPE, 2020–2023 (USD MILLION)
                    TABLE 77 SHIPBUILDING: DC TORQUE TOOL MARKET FOR HANDHELD TOOLS, BY TYPE, 2024–2029 (USD MILLION)
                    TABLE 78 SHIPBUILDING: DC TORQUE TOOL MARKET, BY REGION, 2020–2023 (USD MILLION)
                    TABLE 79 SHIPBUILDING: DC TORQUE TOOL MARKET, BY REGION, 2024–2029 (USD MILLION)
    9.7 OTHER INDUSTRIES 
           TABLE 80 OTHER INDUSTRIES: DC TORQUE TOOL MARKET, BY TOOL TYPE, 2020–2023 (USD MILLION)
           TABLE 81 OTHER INDUSTRIES: DC TORQUE TOOL MARKET, BY TOOL TYPE, 2024–2029 (USD MILLION)
           TABLE 82 OTHER INDUSTRIES: DC TORQUE TOOL MARKET FOR HANDHELD TOOLS, BY TYPE, 2020–2023 (USD MILLION)
           TABLE 83 OTHER INDUSTRIES: DC TORQUE TOOL MARKET FOR HANDHELD TOOLS, BY TYPE, 2024–2029 (USD MILLION)
           TABLE 84 OTHER INDUSTRIES: DC TORQUE TOOL MARKET, BY REGION, 2020–2023 (USD MILLION)
           TABLE 85 OTHER INDUSTRIES: DC TORQUE TOOL MARKET, BY REGION, 2024–2029 (USD MILLION)
 
10 DC TORQUE TOOL MARKET, BY REGION (Page No. - 125)
     10.1 INTRODUCTION 
             FIGURE 49 INDIA TO REGISTER HIGHEST CAGR IN GLOBAL DC TORQUE MARKET DURING FORECAST PERIOD
             FIGURE 50 ASIA PACIFIC TO DOMINATE GLOBAL DC TORQUE TOOL MARKET FROM 2024 TO 2029
             TABLE 86 DC TORQUE TOOL MARKET, BY REGION, 2020–2023 (USD MILLION)
             TABLE 87 DC TORQUE TOOL MARKET, BY REGION, 2024–2029 (USD MILLION)
     10.2 NORTH AMERICA 
             10.2.1 RECESSION IMPACT ON DC TORQUE TOOL MARKET IN NORTH AMERICA
                        FIGURE 51 NORTH AMERICA: DC TORQUE TOOL MARKET SNAPSHOT
                        TABLE 88 NORTH AMERICA: DC TORQUE TOOL MARKET, BY COUNTRY, 2020–2023 (USD MILLION)
                        TABLE 89 NORTH AMERICA: DC TORQUE TOOL MARKET, BY COUNTRY, 2024–2029 (USD MILLION)
                        TABLE 90 NORTH AMERICA: DC TORQUE TOOL MARKET, BY TOOL TYPE, 2020–2023 (USD MILLION)
                        TABLE 91 NORTH AMERICA: DC TORQUE TOOL MARKET, BY TOOL TYPE, 2024–2029 (USD MILLION)
                        TABLE 92 NORTH AMERICA: DC TORQUE TOOL MARKET, BY CONTROL SYSTEM, 2020–2023 (USD MILLION)
                        TABLE 93 NORTH AMERICA: DC TORQUE TOOL MARKET, BY CONTROL SYSTEM, 2024–2029 (USD MILLION)
                        TABLE 94 NORTH AMERICA: DC TORQUE TOOL MARKET, BY INDUSTRY, 2020–2023 (USD MILLION)
                        TABLE 95 NORTH AMERICA: DC TORQUE TOOL MARKET, BY INDUSTRY, 2024–2029 (USD MILLION)
             10.2.2 US
                        10.2.2.1 Growing use of fastening tools in automobile assembly and production lines to drive market
             10.2.3 CANADA
                        10.2.3.1 Increasing investment in construction projects to augment market growth
             10.2.4 MEXICO
                        10.2.4.1 Rising automobile and aircraft manufacturing to contribute to market growth
     10.3 EUROPE 
             10.3.1 RECESSION IMPACT ON DC TORQUE TOOL MARKET IN EUROPE
                        FIGURE 52 EUROPE: DC TORQUE TOOL MARKET SNAPSHOT
                        TABLE 96 EUROPE: DC TORQUE TOOL MARKET, BY COUNTRY, 2020–2023 (USD MILLION)
                        TABLE 97 EUROPE: DC TORQUE TOOL MARKET, BY COUNTRY, 2024–2029 (USD MILLION)
                        TABLE 98 EUROPE: DC TORQUE TOOL MARKET, BY TOOL TYPE, 2020–2023 (USD MILLION)
                        TABLE 99 EUROPE: DC TORQUE TOOL MARKET, BY TOOL TYPE, 2024–2029 (USD MILLION)
                        TABLE 100 EUROPE: DC TORQUE TOOL MARKET, BY CONTROL SYSTEM, 2020–2023 (USD MILLION)
                        TABLE 101 EUROPE: DC TORQUE TOOL MARKET, BY CONTROL SYSTEM, 2024–2029 (USD MILLION)
                        TABLE 102 EUROPE: DC TORQUE TOOL MARKET, BY INDUSTRY, 2020–2023 (USD MILLION)
                        TABLE 103 EUROPE: DC TORQUE TOOL MARKET, BY INDUSTRY, 2024–2029 (USD MILLION)
             10.3.2 GERMANY
                        10.3.2.1 Increasing car registration and manufacturing to foster market growth
             10.3.3 FRANCE
                        10.3.3.1 Rising house renovation and remodeling activities to accelerate market growth
             10.3.4 UK
                        10.3.4.1 Increasing investment in infrastructure development projects to boost market growth
             10.3.5 SPAIN
                        10.3.5.1 Mounting wind power installations to contribute to market growth
             10.3.6 REST OF EUROPE
     10.4 ASIA PACIFIC 
             10.4.1 RECESSION IMPACT ON DC TORQUE TOOL MARKET IN ASIA PACIFIC
                        FIGURE 53 ASIA PACIFIC: DC TORQUE TOOL MARKET SNAPSHOT
                        TABLE 104 ASIA PACIFIC: DC TORQUE TOOL MARKET, BY COUNTRY, 2020–2023 (USD MILLION)
                        TABLE 105 ASIA PACIFIC: DC TORQUE TOOL MARKET, BY COUNTRY, 2024–2029 (USD MILLION)
                        TABLE 106 ASIA PACIFIC: DC TORQUE TOOL MARKET, BY TOOL TYPE, 2020–2023 (USD MILLION)
                        TABLE 107 ASIA PACIFIC: DC TORQUE TOOL MARKET, BY TOOL TYPE, 2024–2029 (USD MILLION)
                        TABLE 108 ASIA PACIFIC: DC TORQUE TOOL MARKET, BY CONTROL SYSTEM, 2020–2023 (USD MILLION)
                        TABLE 109 ASIA PACIFIC: DC TORQUE TOOL MARKET, BY CONTROL SYSTEM, 2024–2029 (USD MILLION)
                        TABLE 110 ASIA PACIFIC: DC TORQUE TOOL MARKET, BY INDUSTRY, 2020–2023 (USD MILLION)
                        TABLE 111 ASIA PACIFIC: DC TORQUE TOOL MARKET, BY INDUSTRY, 2024–2029 (USD MILLION)
             10.4.2 CHINA
                        10.4.2.1 Increasing sales of motor vehicles to contribute to market growth
             10.4.3 JAPAN
                        10.4.3.1 Growing export of large construction vehicles to boost market growth
             10.4.4 INDIA
                        10.4.4.1 Rapid industrialization and manufacturing sector growth to drive market
             10.4.5 REST OF ASIA PACIFIC
     10.5 ROW 
             10.5.1 RECESSION IMPACT ON DC TORQUE TOOL MARKET IN ROW
                        TABLE 112 ROW: DC TORQUE TOOL MARKET, BY REGION, 2020–2023 (USD MILLION)
                        TABLE 113 ROW: DC TORQUE TOOL MARKET, BY REGION, 2024–2029 (USD MILLION)
                        TABLE 114 ROW: DC TORQUE TOOL MARKET, BY TOOL TYPE, 2020–2023 (USD MILLION)
                        TABLE 115 ROW: DC TORQUE TOOL MARKET, BY TOOL TYPE, 2024–2029 (USD MILLION)
                        TABLE 116 ROW: DC TORQUE TOOL MARKET, BY CONTROL SYSTEM, 2020–2023 (USD MILLION)
                        TABLE 117 ROW: DC TORQUE TOOL MARKET, BY CONTROL SYSTEM, 2024–2029 (USD MILLION)
                        TABLE 118 ROW: DC TORQUE TOOL MARKET, BY INDUSTRY, 2020–2023 (USD MILLION)
                        TABLE 119 ROW: DC TORQUE TOOL MARKET, BY INDUSTRY, 2024–2029 (USD MILLION)
             10.5.2 SOUTH AMERICA
                        10.5.2.1 Rising enforcement of stringent regulations to ensure manufacturing safety to fuel market growth
             10.5.3 MIDDLE EAST
                        10.5.3.1 Burgeoning investment in vehicle assembly and component manufacturing to drive market
                        10.5.3.2 GCC countries
                        10.5.3.3 Rest of Middle East
             10.5.4 AFRICA
                        10.5.4.1 Government-led initiatives to promote industrialization to accelerate market growth
 
11 COMPETITIVE LANDSCAPE (Page No. - 149)
     11.1 OVERVIEW 
     11.2 KEY PLAYER STRATEGIES/RIGHT TO WIN, 2021−2024 
             TABLE 120 DC TORQUE TOOL MARKET: OVERVIEW OF STRATEGIES ADOPTED BY KEY PLAYERS, 2021–2024
     11.3 REVENUE ANALYSIS, 2019–2023 
             FIGURE 54 DC TORQUE TOOL MARKET: REVENUE ANALYSIS OF FOUR KEY PLAYERS, 2019–2023
     11.4 MARKET SHARE ANALYSIS, 2023 
             TABLE 121 DC TORQUE TOOL MARKET: MARKET SHARE ANALYSIS, 2023
             FIGURE 55 DC TORQUE TOOL MARKET: MARKET SHARE ANALYSIS, 2023
     11.5 COMPANY VALUATION AND FINANCIAL METRICS 
             FIGURE 56 COMPANY VALUATION (USD BILLION)
             FIGURE 57 FINANCIAL METRICS (EV/EBITDA)
     11.6 BRAND/PRODUCT COMPARISON 
             FIGURE 58 BRAND/PRODUCT COMPARISON
     11.7 COMPANY EVALUATION MATRIX: KEY PLAYERS, 2023 
             11.7.1 STARS
             11.7.2 EMERGING LEADERS
             11.7.3 PERVASIVE PLAYERS
             11.7.4 PARTICIPANTS
                        FIGURE 59 DC TORQUE TOOL MARKET: COMPANY EVALUATION MATRIX (KEY PLAYERS), 2023
             11.7.5 COMPANY FOOTPRINT: KEY PLAYERS, 2023
                        11.7.5.1 Company footprint
                                     FIGURE 60 DC TORQUE TOOL MARKET: COMPANY FOOTPRINT
                        11.7.5.2 Tool type footprint
                                     TABLE 122 DC TORQUE TOOL MARKET: TOOL TYPE FOOTPRINT
                        11.7.5.3 Power source footprint
                                     TABLE 123 DC TORQUE TOOL MARKET: POWER SOURCE FOOTPRINT
                        11.7.5.4 Industry footprint
                                     TABLE 124 DC TORQUE TOOL MARKET: INDUSTRY FOOTPRINT
                        11.7.5.5 Region footprint
                                     TABLE 125 DC TORQUE TOOL MARKET: REGION FOOTPRINT
     11.8 COMPANY EVALUATION MATRIX: STARTUPS/SMES, 2023 
             11.8.1 PROGRESSIVE COMPANIES
             11.8.2 RESPONSIVE COMPANIES
             11.8.3 DYNAMIC COMPANIES
             11.8.4 STARTING BLOCKS
                        FIGURE 61 DC TORQUE TOOL MARKET: COMPANY EVALUATION MATRIX (STARTUPS/SMES), 2023
             11.8.5 COMPETITIVE BENCHMARKING: STARTUPS/SMES, 2023
                        11.8.5.1 Detailed list of key startups/SMEs
                                     TABLE 126 DC TORQUE TOOL MARKET: DETAILED LIST OF KEY STARTUPS/SMES
                        11.8.5.2 Competitive benchmarking of key startups/SMEs
                                     TABLE 127 DC TORQUE TOOL MARKET: COMPETITIVE BENCHMARKING OF KEY STARTUPS/SMES
     11.9 COMPETITIVE SCENARIO AND TRENDS 
             11.9.1 PRODUCT LAUNCHES
                        TABLE 128 DC TORQUE TOOL MARKET: PRODUCT LAUNCHES, JANUARY 2021–MARCH 2024
             11.9.2 OTHERS
                        TABLE 129 DC TORQUE TOOL MARKET: DEALS, JANUARY 2021–MARCH 2024
 
12 COMPANY PROFILES (Page No. - 166)
(Business Overview, Products/Solutions/Services Offered, Recent Developments, and MnM View (Key strengths/Right to Win, Strategic Choices Made, and Weaknesses and Competitive Threats))*  
     12.1 KEY PLAYERS 
             12.1.1 ATLAS COPCO AB
                        TABLE 130 ATLAS COPCO AB: COMPANY OVERVIEW
                        FIGURE 62 ATLAS COPCO AB: COMPANY SNAPSHOT
                        TABLE 131 ATLAS COPCO AB: PRODUCTS/SOLUTIONS/SERVICES OFFERED
                        TABLE 132 ATLAS COPCO AB: PRODUCT LAUNCHES
             12.1.2 APEX TOOL GROUP, LLC
                        TABLE 133 APEX TOOL GROUP, LLC: COMPANY OVERVIEW
                        TABLE 134 APEX TOOL GROUP, LLC: PRODUCTS/SOLUTIONS/SERVICES OFFERED
             12.1.3 STANLEY BLACK & DECKER, INC.
                        TABLE 135 STANLEY BLACK & DECKER, INC.: COMPANY OVERVIEW
                        FIGURE 63 STANLEY BLACK & DECKER, INC.: COMPANY SNAPSHOT
                        TABLE 136 STANLEY BLACK & DECKER, INC.: PRODUCTS/SOLUTIONS/SERVICES OFFERED
                        TABLE 137 STANLEY BLACK & DECKER, INC.: PRODUCT LAUNCHES
                        TABLE 138 STANLEY BLACK & DECKER, INC.: OTHERS
             12.1.4 ROBERT BOSCH GMBH
                        TABLE 139 ROBERT BOSCH GMBH: COMPANY OVERVIEW
                        FIGURE 64 ROBERT BOSCH GMBH: COMPANY SNAPSHOT
                        TABLE 140 ROBERT BOSCH GMBH: PRODUCTS/SOLUTIONS/SERVICES OFFERED
             12.1.5 INGERSOLL RAND
                        TABLE 141 INGERSOLL RAND: COMPANY OVERVIEW
                        FIGURE 65 INGERSOLL RAND: COMPANY SNAPSHOT
                        TABLE 142 INGERSOLL RAND: PRODUCTS/SOLUTIONS/SERVICES OFFERED
             12.1.6 GEDORE WERKZEUGFABRIK GMBH & CO. KG
                        TABLE 143 GEDORE WERKZEUGFABRIK GMBH & CO. KG.: COMPANY OVERVIEW
                        TABLE 144 GEDORE WERKZEUGFABRIK GMBH & CO. KG.: PRODUCTS/SOLUTIONS/SERVICES OFFERED
             12.1.7 HILTI CORPORATION
                        TABLE 145 HILTI CORPORATION: COMPANY OVERVIEW
                        FIGURE 66 HILTI CORPORATION: COMPANY SNAPSHOT
                        TABLE 146 HILTI CORPORATION: PRODUCTS/SOLUTIONS/SERVICES OFFERED
             12.1.8 MAKITA CORPORATION
                        TABLE 147 MAKITA CORPORATION: COMPANY OVERVIEW
                        FIGURE 67 MAKITA CORPORATION: COMPANY SNAPSHOT
                        TABLE 148 MAKITA CORPORATION: PRODUCTS/SOLUTIONS/SERVICES OFFERED
             12.1.9 TECHTRONIC INDUSTRIES CO. LTD.
                        TABLE 149 TECHTONIC INDUSTRIES CO. LTD.: COMPANY OVERVIEW
                        FIGURE 68 TECHTONIC INDUSTRIES CO. LTD.: COMPANY SNAPSHOT
                        TABLE 150 TECHTONIC INDUSTRIES CO. LTD.: PRODUCTS/SOLUTIONS/SERVICES OFFERED
             12.1.10 URYU SEISAKU, LTD.
                        TABLE 151 URYU SEISAKU, LTD.: COMPANY OVERVIEW
                        TABLE 152 URYU SEISAKU, LTD.: PRODUCTS/SOLUTIONS/SERVICES OFFERED
                        TABLE 153 URYU SEISAKU, LTD.: PRODUCT LAUNCHES
     12.2 OTHER PLAYERS 
             12.2.1 AIMCO
                        TABLE 154 AIMCO: COMPANY OVERVIEW
             12.2.2 ESTIC CORPORATION
                        TABLE 155 ESTIC CORPORATION: COMPANY OVERVIEW
             12.2.3 DELTA REGIS
                        TABLE 156 DELTA REGIS: COMPANY OVERVIEW
             12.2.4 DESOUTTER INDUSTRIAL TOOLS
                        TABLE 157 DESOUTTER INDUSTRIAL TOOLS: COMPANY OVERVIEW
             12.2.5 FEIN POWER TOOLS, INC.
                        TABLE 158 FEIN POWER TOOLS, INC.: COMPANY OVERVIEW
             12.2.6 KOKI HOLDINGS CO., LTD.
                        TABLE 159 KOKI HOLDINGS CO., LTD.: COMPANY OVERVIEW
             12.2.7 KOLVER SRL.
                        TABLE 160 KOLVER SRL: COMPANY OVERVIEW
             12.2.8 MINT GMBH
                        TABLE 161 MINT GMBH: COMPANY OVERVIEW
             12.2.9 NORBAR TORQUE TOOLS
                        TABLE 162 NORBAR TORQUE TOOLS: COMPANY OVERVIEW
             12.2.10 PANASONIC CORPORATION
                        TABLE 163 PANASONIC CORPORATION: COMPANY OVERVIEW
             12.2.11 RHINO TOOL HOUSE
                        TABLE 164 RHINO TOOL HOUSE: COMPANY OVERVIEW
             12.2.12 SNAP-ON
                        TABLE 165 SNAP-ON: COMPANY OVERVIEW
             12.2.13 SUMAKE INDUSTRIAL CO., LTD.
                        TABLE 166 SUMAKE INDUSTRIAL CO., LTD.: COMPANY OVERVIEW
             12.2.14 TOHNICHI MFG. CO., LTD.
                        TABLE 167 TOHNICHI MFG. CO., LTD.: COMPANY OVERVIEW
             12.2.15 WEBER SCREWDRIVING SYSTEMS, INC.
                        TABLE 168 WEBER SCREWDRIVING SYSTEMS, INC.: COMPANY OVERVIEW
*Details on Business Overview, Products/Solutions/Services Offered, Recent Developments, and MnM View (Key strengths/Right to Win, Strategic Choices Made, and Weaknesses and Competitive Threats) might not be captured in case of unlisted companies.  
 
13 ADJACENT MARKET (Page No. - 205)
     13.1 INTRODUCTION 
             FIGURE 69 POWER TOOLS MARKET, BY APPLICATION
             FIGURE 70 RESIDENTIAL/DIY SEGMENT TO RECORD HIGHER CAGR DURING FORECAST PERIOD
             TABLE 169 POWER TOOLS MARKET, BY APPLICATION, 2020–2023 (USD MILLION)
             TABLE 170 POWER TOOLS MARKET, BY APPLICATION, 2024–2029 (USD MILLION)
     13.2 INDUSTRIAL/PROFESSIONAL 
             FIGURE 71 CONSTRUCTION SEGMENT TO DOMINATE MARKET FOR INDUSTRIAL/PROFESSIONAL APPLICATIONS FROM 2024 TO 2029
             TABLE 171 INDUSTRIAL/PROFESSIONAL: POWER TOOLS MARKET, BY TYPE, 2020–2023 (USD MILLION)
             TABLE 172 INDUSTRIAL/PROFESSIONAL: POWER TOOLS MARKET, BY TYPE, 2024–2029 (USD MILLION)
             TABLE 173 INDUSTRIAL/PROFESSIONAL: POWER TOOLS MARKET, BY REGION, 2020–2023 (USD MILLION)
             TABLE 174 INDUSTRIAL/PROFESSIONAL: POWER TOOLS MARKET, BY REGION, 2024–2029 (USD MILLION)
             13.2.1 CONSTRUCTION
                        13.2.1.1 Growing demand for impact drills and rotary hammers in construction projects to boost segmental growth
                                     TABLE 175 CONSTRUCTION: POWER TOOLS MARKET, BY MODE OF OPERATION, 2020–2023 (USD MILLION)
                                     TABLE 176 CONSTRUCTION: POWER TOOLS MARKET, BY MODE OF OPERATION, 2024–2029 (USD MILLION)
                                     TABLE 177 CONSTRUCTION: POWER TOOLS MARKET, BY REGION, 2020–2023 (USD MILLION)
                                     TABLE 178 CONSTRUCTION: POWER TOOLS MARKET, BY REGION, 2024–2029 (USD MILLION)
             13.2.2 AUTOMOTIVE
                        13.2.2.1 Ease of maintenance by speeding up repetitive processes to drive market
                                     TABLE 179 AUTOMOTIVE: POWER TOOLS MARKET, BY MODE OF OPERATION, 2020–2023 (USD MILLION)
                                     TABLE 180 AUTOMOTIVE: POWER TOOLS MARKET, BY MODE OF OPERATION, 2024–2029 (USD MILLION)
                                     TABLE 181 AUTOMOTIVE: POWER TOOLS MARKET, BY REGION, 2020–2023 (USD MILLION)
                                     TABLE 182 AUTOMOTIVE: POWER TOOLS MARKET, BY REGION, 2024–2029 (USD MILLION)
             13.2.3 AEROSPACE
                        13.2.3.1 Rising demand for fuel-efficient and quiet aircraft components to accelerate segmental growth
                                     TABLE 183 AEROSPACE: POWER TOOLS MARKET, BY MODE OF OPERATION, 2020–2023 (USD MILLION)
                                     TABLE 184 AEROSPACE: POWER TOOLS MARKET, BY MODE OF OPERATION, 2024–2029 (USD MILLION)
                                     TABLE 185 AEROSPACE: POWER TOOLS MARKET, BY REGION, 2020–2023 (USD MILLION)
                                     TABLE 186 AEROSPACE: POWER TOOLS MARKET, BY REGION, 2024–2029 (USD MILLION)
             13.2.4 ENERGY
                        13.2.4.1 Increasing number of wind projects in developing countries to fuel segmental growth
                                     TABLE 187 ENERGY: POWER TOOLS MARKET, BY MODE OF OPERATION, 2020–2023 (USD MILLION)
                                     TABLE 188 ENERGY: POWER TOOLS MARKET, BY MODE OF OPERATION, 2024–2029 (USD MILLION)
                                     TABLE 189 ENERGY: POWER TOOLS MARKET, BY REGION, 2020–2023 (USD MILLION)
                                     TABLE 190 ENERGY: POWER TOOLS MARKET, BY REGION, 2024–2029 (USD MILLION)
             13.2.5 SHIPBUILDING
                        13.2.5.1 Growing demand for screwdrivers, electric nutrunners, and impact wrenches to augment market growth
                                     TABLE 191 SHIPBUILDING: POWER TOOLS MARKET, BY MODE OF OPERATION, 2020–2023 (USD MILLION)
                                     TABLE 192 SHIPBUILDING: POWER TOOLS MARKET, BY MODE OF OPERATION, 2024–2029 (USD MILLION)
                                     TABLE 193 SHIPBUILDING: POWER TOOLS MARKET, BY REGION, 2020–2023 (USD MILLION)
                                     TABLE 194 SHIPBUILDING: POWER TOOLS MARKET, BY REGION, 2024–2029 (USD MILLION)
             13.2.6 OTHER INDUSTRIES
                        TABLE 195 OTHER INDUSTRIES: POWER TOOLS MARKET, BY MODE OF OPERATION, 2020–2023 (USD MILLION)
                        TABLE 196 OTHER INDUSTRIES: POWER TOOLS MARKET, BY MODE OF OPERATION, 2024–2029 (USD MILLION)
                        TABLE 197 OTHER INDUSTRIES: POWER TOOLS MARKET, BY REGION, 2020–2023 (USD MILLION)
                        TABLE 198 OTHER INDUSTRIES: POWER TOOLS MARKET, BY REGION, 2024–2029 (USD MILLION)
     13.3 RESIDENTIAL/DIY 
             13.3.1 RISING FOCUS ON REMODELING AND REFURBISHING EXISTING HOMES TO BOOST SEGMENTAL GROWTH
                        TABLE 199 RESIDENTIAL/DIY: POWER TOOLS MARKET, BY REGION, 2020–2023 (USD MILLION)
                        TABLE 200 RESIDENTIAL/DIY: POWER TOOLS MARKET, BY REGION, 2024–2029 (USD MILLION)
 
14 APPENDIX (Page No. - 220)
     14.1 INSIGHTS FROM INDUSTRY EXPERTS 
     14.2 DISCUSSION GUIDE 
     14.3 KNOWLEDGESTORE: MARKETSANDMARKETS’ SUBSCRIPTION PORTAL 
     14.4 CUSTOMIZATION OPTIONS 
     14.5 RELATED REPORTS 
     14.6 AUTHOR DETAILS 
 

The study involves four major activities that estimate the size of the DC torque tool market. Exhaustive secondary research was conducted to collect information related to the market. Following this was validating these findings, assumptions, and sizing with the industry experts across the value chain through primary research. Both top-down and bottom-up approaches were employed to estimate the overall size of the DC torque tool market. Subsequently, market breakdown and data triangulation procedures were used to determine the extent of different segments and subsegments of the market.

Secondary Research

Secondary sources in this research study include corporate filings (such as annual reports, investor presentations, and financial statements); trade, business, and professional associations; white papers, certified publications, articles from recognized authors; directories; and databases. The secondary data were collected and analyzed to estimate the overall market size, further validated by primary research. The relevant data is collected from various secondary sources, it is analyzed to extract insights and information relevant to the market research objectives. This analysis has involved summarizing the data, identifying trends, and drawing conclusions based on the available information.

Primary Research

In the primary research process, numerous sources from both the supply and demand sides were interviewed to obtain qualitative and quantitative information about this report. The primary sources from the supply side included various industry experts such as Chief X Officers (CXOs), Vice Presidents (VPs), and Directors from business development, marketing, product development/innovation teams, and related key executives from DC torque tool providers, (such as Atlas Copco AB, Apex Tool Group, LLC, ESTIC CORPORATION) research organizations, distributors, professional and managed service providers, industry associations, and key opinion leaders. Approximately 25% of the primary interviews were conducted with the demand side and 75% with the supply side. These data were collected mainly through questionnaires, emails, and telephonic interviews, accounting for 80% of the primary interviews.

DC Torque Tool Market
 Size, and Share

To know about the assumptions considered for the study, download the pdf brochure

Market Size Estimation

In the market engineering process, both top-down and bottom-up approaches were implemented, along with several data triangulation methods, to estimate and validate the size of the DC torque tool market and other dependent submarkets listed in this report.

  • The key players in the industry and markets were identified through extensive secondary research.
  • Both the supply chain of the industry and the market size, in terms of value, were determined through primary and secondary research.
  • All percentage shares, splits, and breakdowns were determined using secondary sources and verified through primary sources.

Market Size Estimation Methodology Bottom-up Approach

DC Torque Tool Market
 Size, and Bottom-up Approach

Market Size Estimation Methodology Top-Down Approach

DC Torque Tool Market
 Size, and Top-Down Approach

Data Triangulation

After estimating the overall market size, the total market was split into several segments. The market breakdown and data triangulation procedures were employed wherever applicable to complete the overall market engineering process and gauge exact statistics for all segments. The data were triangulated by studying various factors and trends from both the demand and supply sides. The market was also validated using both top-down and bottom-up approaches.

Market Definition

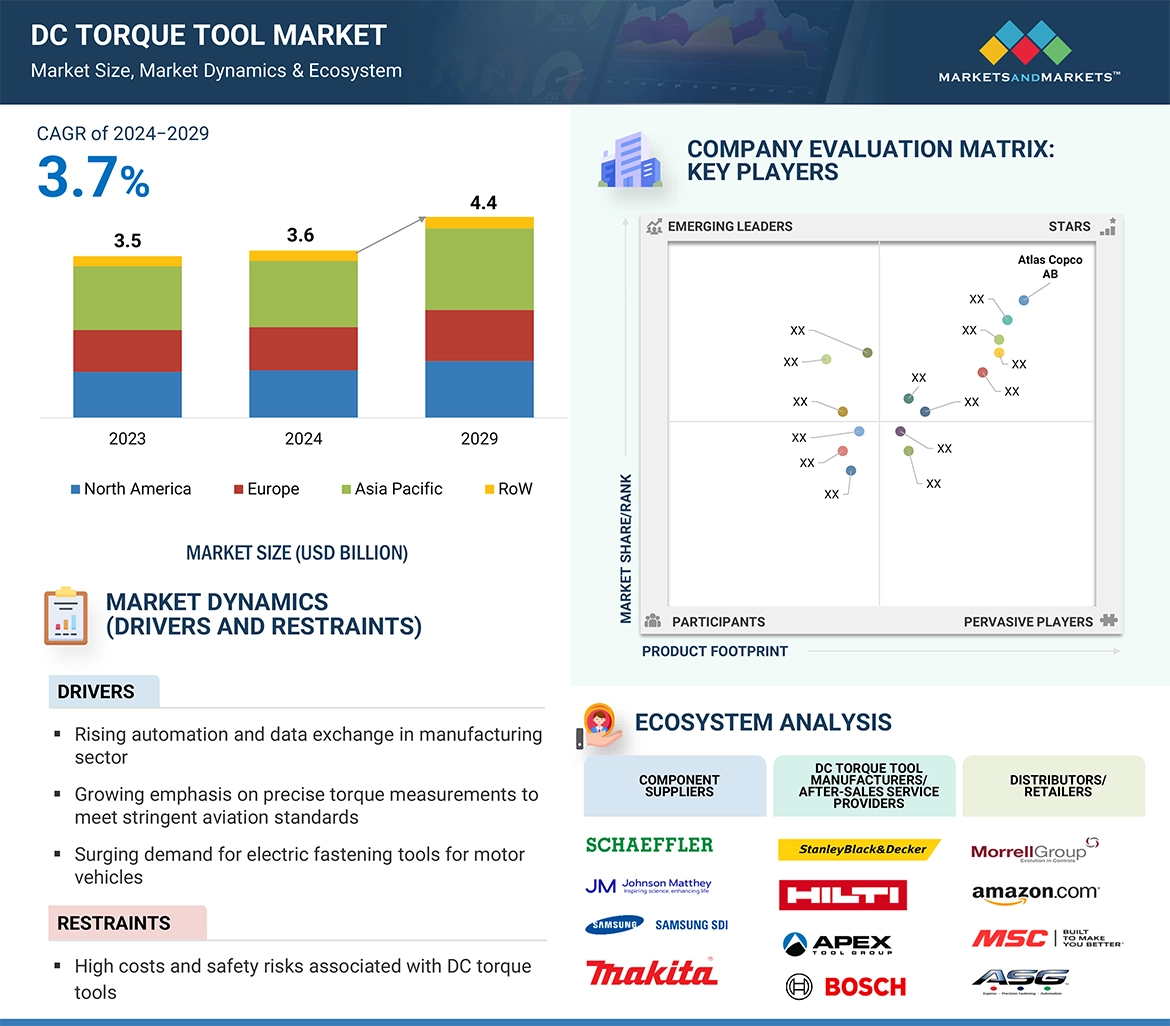
DC torque tool, also known as an electric fastening system, is used to apply precise and specific torque to fasteners, such as nuts, bolts, and screws, that mechanically join two or more objects together. These tools operate either on continuous power supply or battery-operated supply. They are used where the tightening of fasteners is challenging. These systems create a non-permanent joint, which can be removed without any damage. These tools are widely used in industries where precision and reliability are critical. They are commonly utilized in automotive, aerospace, electronics, and manufacturing industries, where consistent torque application is vital to ensure the functionality and safety of the devices.

Key Stakeholders

  • Power tool manufacturers
  • Brushed DC motor and brushless DC (BLDC) motor suppliers
  • Li-ion battery suppliers
  • Torque sensors/torque transducer suppliers
  • Wireless charging market players
  • Analysts and strategic business planners
  • End-user industries
  • Governments, financial institutions, and investment communities
  • Electronic component original equipment manufacturers (OEMs)
  • Raw material suppliers
  • Research organizations
  • Technology investors and venture capitalists
  • Technology-standard organizations, forums, alliances, and associations

The main objectives of this study are as follows:

  • To define, describe, segment, and forecast the global DC torque tool market, by tool type, power source, control system, and industry, in terms of value
  • To define and forecast the DC torque tool market, by handheld tool, in terms of volume
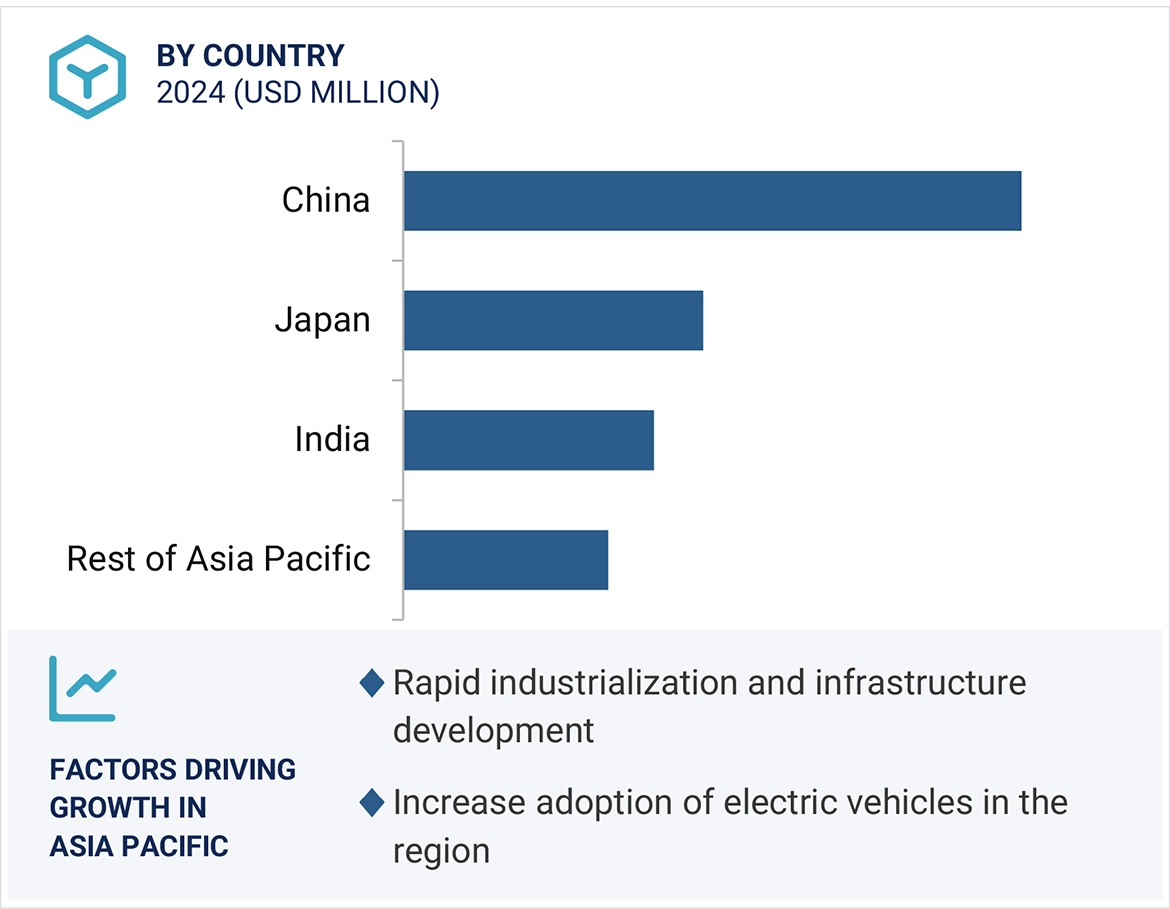
  • To forecast the market size for various segments with regard to four main regions, namely, North America, Europe, Asia Pacific, and the Rest of the World (RoW), along with their respective countries, in terms of value
  • To provide detailed information regarding major factors influencing the growth of the DC torque tool market (drivers, restraints, opportunities, and challenges)
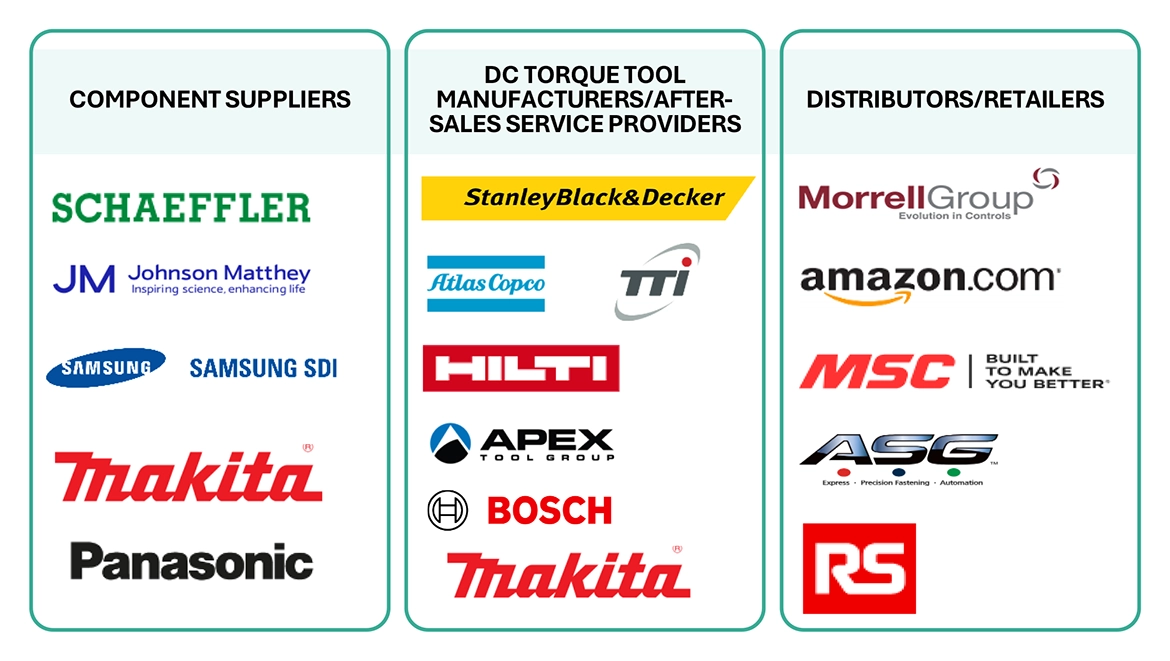
  • To analyze the value chain of the electric fastening systems ecosystem
  • To provide supply chain analysis, trends/disruptions impacting customer business, ecosystem analysis, pricing analysis, Porter’s five forces analysis, case study analysis, and regulatory standards pertaining to the DC torque tool market
  • To strategically analyze the micromarkets1 with respect to the individual growth trends, prospects, and contribution to the overall DC torque tool market
  • To analyze opportunities in the market for stakeholders by identifying high-growth segments of the global DC Torque tools market
  • To strategically profile key players and comprehensively analyze their ranking and core competencies2, along with detailing the competitive landscape for market leaders
  • To analyze competitive developments, such as expansions, mergers & acquisitions, product launches and developments, and research & development activities, in the global DC torque tool market

Available Customizations:

With the given market data, MarketsandMarkets offers customizations according to the specific requirements of companies. The following customization options are available for the report:

Country-wise Information:

  • Analysis for additional countries (up to five)

Company Information:

  • Detailed analysis and profiling of different market players (up to five)
Custom Market Research Services

We will customize the research for you, in case the report listed above does not meet with your exact requirements. Our custom research will comprehensively cover the business information you require to help you arrive at strategic and profitable business decisions.

Request Customization
Report Code
SE 5571
Published ON
Jun, 2024
Choose License Type
BUY NOW
  • SHARE
X
Request Customization
Speak to Analyst
Speak to Analyst
OR FACE-TO-FACE MEETING
PERSONALIZE THIS RESEARCH
  • Triangulate with your Own Data
  • Get Data as per your Format and Definition
  • Gain a Deeper Dive on a Specific Application, Geography, Customer or Competitor
  • Any level of Personalization
REQUEST A FREE CUSTOMIZATION
LET US HELP YOU!
  • What are the Known and Unknown Adjacencies Impacting the DC Torque Tool Market
  • What will your New Revenue Sources be?
  • Who will be your Top Customer; what will make them switch?
  • Defend your Market Share or Win Competitors
  • Get a Scorecard for Target Partners
CUSTOMIZED WORKSHOP REQUEST
  • Call Us
  • +1-888-600-6441 (Corporate office hours)
  • +1-888-600-6441 (US/Can toll free)
  • +44-800-368-9399 (UK office hours)
CONNECT WITH US
ABOUT TRUST ONLINE
©2024 MarketsandMarkets Research Private Ltd. All rights reserved
DMCA.com Protection Status Website Feedback