Dairy Alternatives Market

Dairy Alternatives Market by Source (Soy, Almond, Coconut, Oats, Hemp), Application (Milk, Yogurt, Ice Creams, Cheese, Creamers), Distribution Channel (Retail, Online Stores, Foodservice), Formulation and Region - Global Forecast to 2028

Report Code: FB 1142 Oct, 2023, by marketsandmarkets.com

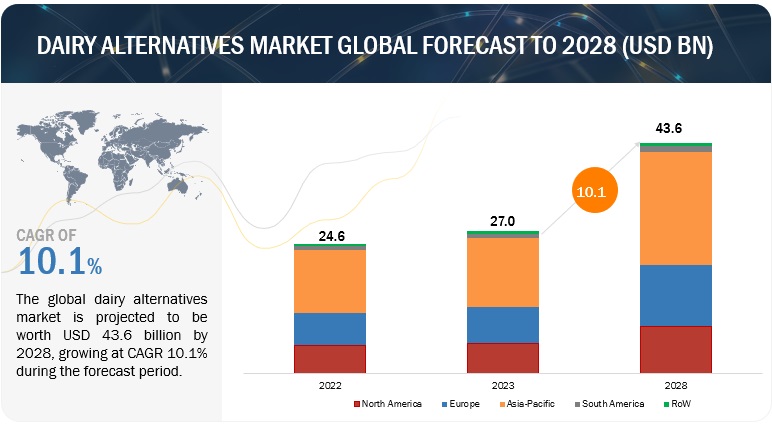
At a 10.1% CAGR, the global dairy alternatives market size is projected to reach US$ 43.6 billion by 2028 from a projected US$ 27.0 billion in 2023. The global market size was valued at US$ 24.6 billion in 2022.

In recent years, the global food industry has witnessed a significant shift in consumer preferences, with a growing demand for dairy alternatives. This trend reflects changing consumer attitudes toward health, sustainability, and ethical considerations. As more people seek to reduce or eliminate dairy products from their diets, the market for dairy alternatives has experienced exponential growth. One of the primary drivers behind the surge in demand for dairy alternatives is the increasing focus on health and wellness. Many consumers are becoming more health-conscious and are looking for options that align with their dietary preferences and restrictions. Dairy alternatives, such as almond milk, soy milk, and oat milk, are often perceived as healthier choices due to their lower saturated fat content and absence of cholesterol. Additionally, some dairy-free options are fortified with vitamins and minerals, making them attractive alternatives for those seeking to maintain a balanced diet. Lactose intolerance is another factor contributing to the popularity of dairy alternatives. A significant portion of the global population is lactose intolerant, meaning they have difficulty digesting lactose, the sugar found in dairy products. For these individuals, dairy alternatives provide a solution, allowing them to enjoy milk-like products without discomfort or digestive issues. Moreover, dairy allergies are becoming more prevalent, further driving the demand for plant-based milk and dairy substitutes.

The rising demand for dairy alternatives is a multifaceted phenomenon driven by health-consciousness, environmental concerns, ethical considerations, and accessibility to a variety of innovative products. As this trend continues to gain momentum, the dairy alternatives market is likely to evolve even further, with increased investment in research and development, more plant-based product offerings, and a broader consumer base. Whether for health, ethical, or environmental reasons, dairy alternatives are transforming the way we think about and consume dairy products, reflecting a dynamic shift in the global food industry.
Dairy Alternatives Market

To know about the assumptions considered for the study, Request for Free Sample Report
Dairy Alternatives Market

To know about the assumptions considered for the study, download the pdf brochure

Drivers:  Consumers are increasingly showing a preference for vegan food options

The growth of the dairy alternatives market is primarily driven by the global shift towards vegetarian and flexitarian diets. These dietary preferences have gained significant popularity, influenced by various factors such as concerns about animal welfare, environmental issues, and personal health. Veganism has emerged as a lifestyle choice that abstains from consuming animal-derived products, including dairy. The increasing worldwide condemnation of animal cruelty has further boosted the demand for dairy substitutes. Many consumers view a vegan diet as a healthy choice and opt for dairy alternatives like soy milk, almond milk, rice milk, and other plant-based options instead of traditional dairy milk.

Significant growth in the vegan population has been observed in major economies like the United States and the United Kingdom. Consumers in developed nations embrace plant-based milk as it offers energy, health benefits, aids in weight management, and enhances the taste of food. According to The Vegan Society, avoiding meat and dairy consumption plays a crucial role in reducing the environmental impact, particularly concerning carbon emissions. Currently, the livestock industry contributes an estimated 18% to total greenhouse gas emissions across the five major sectors for greenhouse gas reporting. Within the agricultural sector, farmed animals are responsible for nearly 80% of all emissions. This environmental concern has prompted environmentally conscious consumers to shift towards dairy alternatives.

In 2021, The Vegan Society recorded 16,439 products bearing The Vegan Trademark, with over 82% of these registrations occurring in the past five years. The Vegan Trademark is now recognized in 87 countries globally, and more than half of the registered products come from companies located outside the UK. Given the rapid growth of the vegan population, numerous dairy manufacturers are transitioning towards producing plant-based milk products, which is expected to have a positive impact on the plant-based beverages market.

Restraints: The issue of allergies among soy food consumers

In the realm of dietary choices, where people often make decisions based on health considerations and ethical values, the issue of allergen cross-contamination has emerged as a significant challenge within the dairy alternatives market. As more consumers opt for plant-based milk substitutes due to health, environmental, or lifestyle reasons, addressing the prevalence of food allergens and sensitivities has become crucial. Allergen cross-contamination, especially involving common allergens like nuts or soy, presents substantial risks for individuals with allergies or sensitivities. This situation calls for increased awareness and proactive measures throughout the industry.

Food allergies are immune responses triggered by specific proteins in food, affecting a substantial portion of the population. Nuts and soy are among the most prevalent allergens, capable of causing severe reactions in susceptible individuals, ranging from mild hives to life-threatening anaphylaxis. Many dairy substitutes, including soy milk, soy-based cheese, and soy-based yogurt, contain soy proteins that can induce allergic reactions. While soybean oil and soy lecithin were initially considered safe for those with soy allergies, it's now recognized that these products may still contain trace amounts of soy protein, potentially leading to allergic responses. Given that numerous dairy alternatives are manufactured in facilities that also handle allergens like nuts or soy, the risk of cross-contamination exists at various stages of production, including sourcing, processing, and packaging.

In recent years, the prevalence of food allergies has risen, becoming a significant concern for both consumers and food manufacturers. According to the Food Allergy Research & Education Organization in the United States, soy ranks among the top eight major food allergens responsible for most serious food allergy reactions in the country. Soybeans are packed with essential nutrients such as vitamins, minerals, isoflavones, and proteins. However, soy also contains anti-nutritional components that can lead to health problems, including soy allergies that manifest as itching and hives. Additional symptoms include gas, bloating, and damage to the intestinal tissue. These factors are anticipated to pose challenges to the dairy alternatives market in the foreseeable future, as soy protein serves as a primary source for producing dairy alternatives.

Opportunities: Changes in lifestyles of consumers

With the global population on the rise, placing additional strain on already limited resources. Escalating energy prices and increasing raw material expenses have a direct impact on food prices, which in turn affects individuals with lower incomes. This stress on the food supply is further compounded by a scarcity of water, particularly prevalent in regions such as Africa and Northern Asia. Additionally, the Asia Pacific region offers cost advantages in terms of production and processing. The combination of high demand and cost-effective production is a significant advantage for dairy alternative suppliers and manufacturers as they target this market.

In response to rapidly evolving lifestyles, people are increasingly gravitating towards nutritious and healthier food options. The distinction between fast food and unhealthy junk food is expected to become more pronounced as consumers actively seek convenient yet health-conscious choices. Identifying naturally high-nutritional-value products represents a significant opportunity for suppliers and manufacturers in this evolving landscape. The factors fueling the demand for dairy alternatives in these economies are as follows:

  • Rapid urbanization
  • Rise in disposable income

Food & beverage manufacturers have shifted their focus toward these markets due to the following reasons:

  • Growth in demand for vegan food products
  • Changes in lifestyles of consumers, preferring convenience foods
  • Abundance of raw materials
  • Availability of cheap labor
  • Low tariff duty.

Challenges: Limited availability of raw materials

The increasing rates of deforestation in developing nations have led to a shortage of essential raw materials for dairy alternatives like soy, almond, and rice. Additionally, the extremely cold climatic conditions experienced in countries such as the UK, France, and Spain pose challenges to the cultivation of agricultural crops. Soy milk is derived from whole soybeans or full-fat soy flour, almond milk is created from ground almonds and is devoid of lactose and cholesterol, and oat milk, a lactose-free alternative, is naturally derived from oats, grains, and beans. The scarcity of these agricultural raw materials imposes constraints on European manufacturers, limiting their ability to produce alternative dairy beverages.

The setting up of many industries in developing countries such as China and Australia have diminished the availability of agricultural land. This creates a scarcity of raw materials and prevents the production of dairy alternative products.

Market Ecosystem
Dairy Alternatives Market

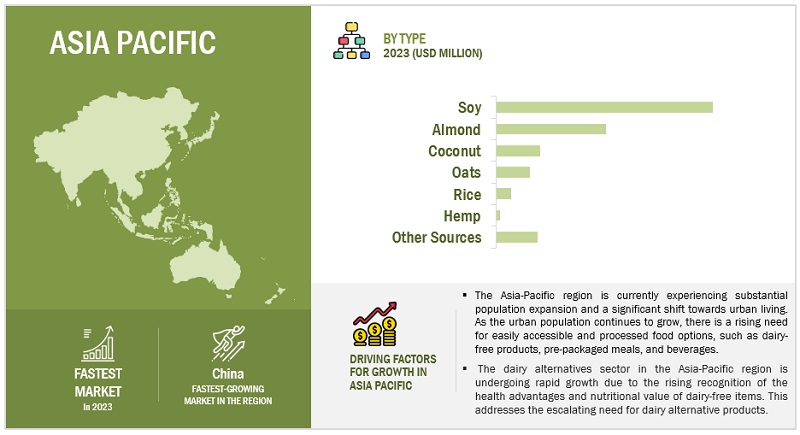
Based on the source, the soy sub-segment is estimated to account for the largest market share of the dairy alternatives market.

Soy-based dairy alternatives are considered efficient substitutes for dairy products and occupy a significant share of the dairy alternatives market. The widespread popularity and increasing consumption of soy-based products can be attributed to their exceptional nutritional value. These products serve as abundant sources of proteins and calcium, making them highly regarded as excellent dairy substitutes, especially for those who are lactose intolerant. Furthermore, soy-based products do not contain casein, a common allergen found in many dairy items.

Soy milk, which is available in a variety of flavors and types, offers consumers a wide range of options to choose from. It is typically derived from soybeans or soy protein isolate, with thickeners and vegetable oils often added to enhance taste and consistency. Soy milk finds its best application in savory dishes, coffee, and cereal, where it serves as a suitable replacement for cow's milk.

For reference, a one-cup (240 ml) serving of unsweetened soy milk contains approximately 80-90 calories, 4-4.5 grams of fat, 7-9 grams of protein, and 4 grams of carbohydrates. In terms of nutrients, soy milk closely mirrors cow's milk with a similar protein content but only half the calories, fats, and carbohydrates.

However, it's worth noting that soy milk derived from soybeans is not recommended for individuals with FODMAP intolerance or those in the elimination phase of the low-FODMAP diet. FODMAPs are short-chain carbohydrates naturally present in some foods that can lead to digestive discomfort such as gas and bloating.

Soy milk also boasts isoflavones, natural antioxidants that set it apart from other milk alternatives. Isoflavones have been associated with a reduced risk of heart disease, and studies suggest that consuming at least 10 milligrams of isoflavones per day can lead to a 25% reduction in breast cancer recurrence. A typical serving of soy milk contains roughly 25 milligrams of isoflavones, with genistein being the most abundant and biologically active isoflavone found in soybeans. Additionally, soy proteins offer protective and therapeutic benefits against various diseases. Soy-based foods are also rich sources of phytochemicals like phytosterols, recognized for their cholesterol-lowering properties. Dry soybeans contain about 40% protein, 20% oil, 35% carbohydrate, and 5% ash.

In addition to lactose and cholesterol-free properties, soymilk is also a good source of essential amino acids and high-quality protein, potassium, and vitamin B, which are required for the growth of consumers. Lactose-free, cholesterol-free, high nutritious content, high digestibility, and low cost are reported or claimed benefits of soy milk. Owing to these health benefits, soy milk has been used as a functional ingredient in preparing processed foods. Soy-based cheese and frozen desserts are also much in demand. Soy-based products are also rich in fiber, which helps deal with gastrointestinal problems.

Based on applications, the milk sub segment of the dairy alternatives market is anticipated to dominate the market.

Factors supporting the popularity of dairy-free milk are health concerns related to lactose intolerance and the hectic lifestyles of the working middle-class population, which encourage them to use convenience products for on-the-go consumption to save time. Since health and convenience are prioritized by consumers while making a beverage choice, companies have diversified their beverage offerings with products containing almond milk, coconut milk, and soymilk, along with other non-dairy ingredients and alternatives derived from hemp, oats, or flax.

Plant-based milk has become increasingly popular with consumers because it is perceived as a healthier substitute for traditional cow's milk. Many people are opting for plant-based milk due to health considerations, particularly if they have lactose intolerance or dairy allergies. Plant-based milk options are often viewed as a better choice for health-conscious individuals because they typically contain lower levels of saturated fats and may be enriched with essential vitamins and minerals.

Plant milk offers a diverse range of flavors and varieties, catering to different consumer preferences. Almond milk, soy milk, oat milk, and coconut milk each have their unique taste profiles and textures. This variety appeals to consumers seeking novel flavors and textures in their dairy alternatives, enhancing the overall culinary experience.

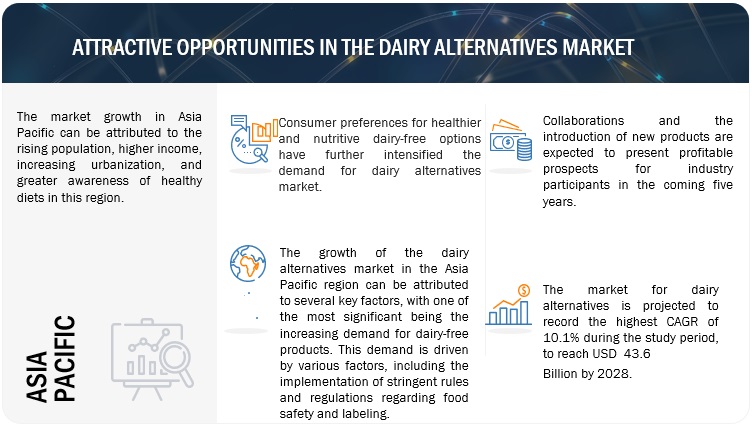
The Asia Pacific market is projected to dominate the dairy alternatives market.

The Asia-Pacific region is witnessing an increasing demand for fortified nutritional food and beverage products due to busy lifestyles and rising disposable incomes. Within this trend, the adoption of dairy alternatives is expected to grow at a faster rate due to consumer preferences. The region's higher economic power is likely to boost the consumption of affordable and abundant soymilk. Food manufacturers are introducing various forms of soymilk to cater to the growing consumer interest in healthy beverages and pasteurized soymilk as dairy substitutes, offering unique flavour options.

This focuses on the study of major countries in the region, including Japan, Australia, China, and India. Key market players in this area include Sanitarium Health & Wellbeing Company, Freedom Foods Group Ltd., Vitasoy International Holdings Limited, and Purebates. The dairy alternatives industry in the Asia-Pacific region is expanding, driven by changing consumer lifestyles. The dairy alternatives market in this region is currently undergoing significant changes due to urbanization, dietary diversification, and increased foreign direct investment in the food sector. Additionally, higher income levels, the rapid growth of the middle-class population, heightened consumer awareness of health and fitness, and the demand for nutritional and health-conscious products present promising growth opportunities in the region's food sector.
Asia-Pacific Dairy Alternatives Market Size, and Share

Key Market Players

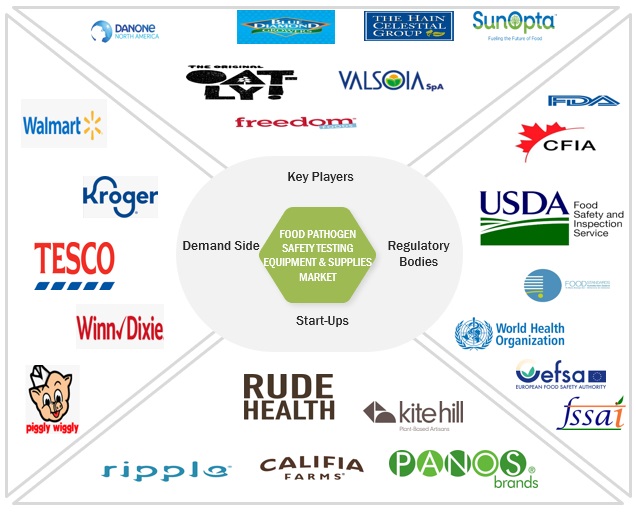
Danone North America Public Benefit Corporation (US), The Hain Celestial Group, Inc. (US), Blue Diamond Growers (US), SunOpta (Canada), Sanitarium (New Zealand) are among the key players in the global dairy alternatives market. Companies are adopting various strategies to boost their revenues and market presence. These strategies include the introduction of new services, forging partnerships, and expanding their laboratory facilities. In the dairy alternatives market, companies are employing key tactics such as: geographical expansion: expanding into emerging economies to capitalize on their growth potential, strategic Acquisitions: acquiring companies strategically along the supply chain to establish a stronger market position, new service launches: introducing new services, driven by extensive research and development (R&D) efforts. These initiatives are geared towards enhancing company performance and market influence.

Get online access to the report on the World's First Market Intelligence Cloud

  • Easy to Download Historical Data & Forecast Numbers
  • Company Analysis Dashboard for high growth potential opportunities
  • Research Analyst Access for customization & queries
  • Competitor Analysis with Interactive dashboard
  • Latest News, Updates & Trend analysis
Request Sample

Scope of the Report

Report Metric

Details

Market size estimation

2023–2028

Base year considered

2022

Forecast period considered

2023–2028

Units considered

Value (USD)

Segments Covered

By Source, By Formulation, By Application, By Distribution Channel, By Nutrient and By Region

Regions covered

North America, Europe, Asia Pacific, South America, and RoW

Companies studied

  • Danone North America Public Benefit Corporation (US)
  • The Hain Celestial Group, Inc. (US)
  • Blue Diamond Growers (US)
  • Freedom Foods Group Limited (Australia)
  • Valsoia S.p.A (Italy)
  • SunOpta (Canada)
  • Qatly Group AB (Sweden)
  • Sanitarium (New Zealand)
  • Eden Foods, Inc. (US)
  • Triballat Noyal (France)
  • Earth’s Own Food Company Inc. (Canada)
  • Elmhurst Milked Direct LLC (New York)
  • Nutriops, S.L. (Spain)
  • Green Spot Co., Ltd. (Thailand)
  • Hiland Dairy (US)
  • Ripple Foods (US)
  • Kite Hill (US)
  • Califia Farms, LLC (US)
  • Rude Health (US)
  • Daiya Foods Inc. (Canada)
  • PureHarvest (Australia)
  • One Good (India)
  • Vly (Germany)
  • Miyoko’s Creamery (US)
  • PANOS Brand (US)

Dairy Alternatives Market:

By Source
  • Soy
  • Almond
  • Coconut
  • Rice
  • Oats
  • Hemp
  • Other Sources
By Formulation
  • Flavored
  • Plain
By Application
  • Milk
  • Ice Cream
  • Yogurt
  • Cheese
  • Creamers
  • Butter
  • Other Applications
By Distribution Channel
  • Retail
    • Supermarkets/Hypermarkets
    • Health Food Stores
    • Pharmacies
    • Convenience Stores
    • Other Retail Channels
  • Foodservice
  • Online Stores
By Nutrient ( Qualitative)
  • Protein
  • Starch
  • Vitamins
  • Other Nutrients
By Region
  • North America
  • Europe
  • Asia Pacific
  • South America
  • Rest of the World (RoW)
  • Other sources include cashews and hazelnuts.
  • Other retail channels include direct sales by manufacturers, gourmet stores, bakeries, warehouse clubs, and mass merchandisers.
  • Other applications include sauces, dressings, tofu, and smoothies.
  • Other nutrients include fats, fibers, and minerals
  • RoW includes the Middle East & Africa.

Recent Developments

  • In June 2023, Oatly Group AB (Sweden) launches introduced a vegan cream cheese that is now available nationwide in the US. This oat-based cream cheese innovation comes in two flavors: Plain and Chive & Onion.
  • In April 2021, SunOpta announced the acquisition of the Dream and WestSoy plant-based beverage brands from The Hain Celestial Group, Inc. The acquired brands helped the company expand its product portfolio, further accelerating growth in this business.
  • In November 2021, Blue Diamond introduced Almond Breeze Extra Creamy Almond milk. This product was made from almond oil made from quality California- grown Blue Diamond almonds to give the product an extra creamy texture. This launch I would help the company to attract more customers.

Frequently Asked Questions (FAQ):

To speak to our analyst for a discussion on the above findings, click Speak to Analyst

TABLE OF CONTENTS
 
1 INTRODUCTION (Page No. - 27)
    1.1 STUDY OBJECTIVES 
    1.2 MARKET DEFINITION 
    1.3 MARKET SCOPE 
           FIGURE 1 DAIRY ALTERNATIVES MARKET SEGMENTATION
           1.3.1 STUDY SCOPE
           1.3.2 YEARS CONSIDERED
    1.4 CURRENCY CONSIDERED 
           TABLE 1 USD EXCHANGE RATES, 2018–2021
    1.5 UNIT CONSIDERED 
    1.6 STAKEHOLDERS 
    1.7 SUMMARY OF CHANGES 
           1.7.1 RECESSION IMPACT ANALYSIS
 
2 RESEARCH METHODOLOGY (Page No. - 32)
    2.1 RESEARCH DATA 
           FIGURE 2 RESEARCH DESIGN
           2.1.1 SECONDARY DATA
                    2.1.1.1 Key data from secondary sources
           2.1.2 PRIMARY DATA
                    2.1.2.1 Key data from primary sources
                    2.1.2.2 Breakdown of primary interviews
                               FIGURE 3 BREAKDOWN OF PRIMARY INTERVIEWS, BY COMPANY TYPE, DESIGNATION, AND REGION
                    2.1.2.3 Key primary insights
    2.2 MARKET SIZE ESTIMATION 
           2.2.1 BOTTOM-UP APPROACH
                    FIGURE 4 MARKET SIZE ESTIMATION METHODOLOGY: BOTTOM-UP APPROACH
           2.2.2 TOP-DOWN APPROACH
                    FIGURE 5 MARKET SIZE ESTIMATION METHODOLOGY: TOP-DOWN APPROACH
    2.3 DATA TRIANGULATION 
           FIGURE 6 DATA TRIANGULATION METHODOLOGY
    2.4 STUDY ASSUMPTIONS 
    2.5 LIMITATIONS AND RISK ASSESSMENT 
    2.6 RECESSION IMPACT 
 
3 EXECUTIVE SUMMARY (Page No. - 41)
    FIGURE 7 DAIRY ALTERNATIVES MARKET SNAPSHOT, BY SOURCE, 2023 VS. 2028 
    FIGURE 8 DAIRY ALTERNATIVES MARKET, BY APPLICATION, 2023 VS. 2028 (USD MILLION) 
    FIGURE 9 DAIRY ALTERNATIVES MARKET, BY DISTRIBUTION CHANNEL, 2023 VS. 2028 (USD MILLION) 
    FIGURE 10 DAIRY ALTERNATIVES MARKET, BY REGION 
 
4 PREMIUM INSIGHTS (Page No. - 45)
    4.1 ATTRACTIVE OPPORTUNITIES FOR KEY PLAYERS IN DAIRY ALTERNATIVES MARKET 
           FIGURE 11 RISING DEMAND FOR DAIRY ALTERNATIVES DUE TO INCREASING CASES OF LACTOSE INTOLERANCE
    4.2 ASIA PACIFIC: DAIRY ALTERNATIVES MARKET, BY FORMULATION & COUNTRY 
           FIGURE 12 FLAVORED FORMULATION AND CHINA TO ACCOUNT FOR LARGEST SEGMENTAL SHARES IN 2023
    4.3 DAIRY ALTERNATIVES MARKET, BY DISTRIBUTION CHANNEL & REGION 
           FIGURE 13 RETAIL TO DOMINATE ACROSS MOST REGIONS DURING FORECAST PERIOD
    4.4 DAIRY ALTERNATIVES MARKET, BY KEY COUNTRY 
           FIGURE 14 CHINA DOMINATED DAIRY ALTERNATIVES MARKET IN 2022
 
5 MARKET OVERVIEW (Page No. - 49)
    5.1 INTRODUCTION 
    5.2 MACROECONOMIC INDICATORS 
           5.2.1 RISE IN FOOD DEMAND FROM GROWING POPULATION
                    FIGURE 15 POPULATION PROJECTED TO REACH MORE THAN 9.5 BILLION BY 2050
           5.2.2 INCREASE IN SOYBEAN PRODUCTION
                    FIGURE 16 SOYBEAN PRODUCTION, BY KEY COUNTRY, 2016–2020 (MILLION TON)
    5.3 MARKET DYNAMICS 
           FIGURE 17 MARKET DYNAMICS: DAIRY ALTERNATIVES MARKET
           5.3.1 DRIVERS
                    5.3.1.1 Growth in consumer preference for plant-based diet
                               FIGURE 18 UK: FASTEST-GROWING TAKEAWAY CUISINES, 2016–2019
                               5.3.1.1.1 Nutritional benefits of plant-derived dairy substitutes
                               TABLE 2 NUTRITIONAL CONTENT OF PLANT-BASED MILK PRODUCTS
                               5.3.1.1.2 Rise in consumers shift toward plant-based nutrition
                               5.3.1.1.3 Evolution in dietary lifestyles toward newer trends
                               5.3.1.1.4 Increase in lactose intolerance and milk allergy cases
                               TABLE 3 LACTOSE CONTENT IN DAIRY FOOD PRODUCTS
           5.3.2 RESTRAINTS
                    5.3.2.1 Volatile prices of raw materials
                    5.3.2.2 Allergy concerns among consumers of soy products
           5.3.3 OPPORTUNITIES
                    5.3.3.1 Emerging markets for premium vegan confections
                    5.3.3.2 Effective marketing strategies and correct positioning of dairy alternatives
                    5.3.3.3 Changes in lifestyles and prospects for manufacturers in emerging economies
           5.3.4 CHALLENGES
                    5.3.4.1 Limited availability of raw materials
                    5.3.4.2 Low awareness among consumers
 
6 INDUSTRY TRENDS (Page No. - 59)
    6.1 OVERVIEW 
    6.2 SUPPLY CHAIN ANALYSIS 
           FIGURE 19 SUPPLY CHAIN INTEGRITY IN DAIRY ALTERNATIVES MARKET
    6.3 VALUE CHAIN ANALYSIS 
           FIGURE 20 VALUE CHAIN ANALYSIS
           6.3.1 SOURCING
           6.3.2 PROCESSING
           6.3.3 MANUFACTURING
           6.3.4 PACKAGING & STORAGE
           6.3.5 DISTRIBUTION
           6.3.6 SALES CHANNEL
    6.4 TRADE ANALYSIS 
           6.4.1 ALMONDS
                    TABLE 4 TOP TEN IMPORTERS AND EXPORTERS OF ALMONDS, 2022 (KT)
           6.4.2 SOYBEANS
                    TABLE 5 TOP TEN IMPORTERS AND EXPORTERS OF SOYBEANS, 2022 (KT)
           6.4.3 OATS
                    TABLE 6 TOP TEN IMPORTERS AND EXPORTERS OF OATS, 2022 (KT)
           6.4.4 RICE
                    TABLE 7 TOP TEN IMPORTERS AND EXPORTERS OF RICE, 2022 (KT)
           6.4.5 COCONUT
                    TABLE 8 TOP TEN IMPORTERS AND EXPORTERS OF COCONUT, 2022 (KT)
           6.4.6 HEMP
                    TABLE 9 TOP TEN IMPORTERS AND EXPORTERS OF HEMP, 2022 (KT)
    6.5 TECHNOLOGY ANALYSIS 
           6.5.1 WET PROCESSING METHOD FOR PRODUCING DAIRY ALTERNATIVE MILK
           6.5.2 DRY PROCESSING METHOD FOR PRODUCING DAIRY ALTERNATIVE MILK
    6.6 PRICING ANALYSIS 
           6.6.1 AVERAGE SELLING PRICE TREND OF KEY PLAYERS, BY APPLICATION
                    FIGURE 21 AVERAGE SELLING PRICE TREND OF KEY PLAYERS, BY APPLICATION (USD/LITER)
           6.6.2 AVERAGE SELLING PRICE TREND, BY REGION
                    TABLE 10 DAIRY ALTERNATIVES MARKET: AVERAGE SELLING PRICE TREND, BY REGION, (USD/LITER)
           6.6.3 AVERAGE SELLING PRICE TREND, BY APPLICATION
                    TABLE 11 DAIRY ALTERNATIVES MARKET: AVERAGE SELLING PRICE. BY APPLICATION, (USD/LITER)
    6.7 MARKET ECOSYSTEM ANALYSIS 
           FIGURE 22 DAIRY ALTERNATIVES MARKET: ECOSYSTEM VIEW
           TABLE 12 DAIRY ALTERNATIVES MARKET: ECOSYSTEM MAPPING
           FIGURE 23 MARKET MAP
    6.8 TRENDS/DISRUPTIONS IMPACTING BUYERS IN DAIRY ALTERNATIVES MARKET 
           FIGURE 24 REVENUE SHIFT IN DAIRY ALTERNATIVES MARKET
    6.9 PATENT ANALYSIS 
           TABLE 13 LIST OF MAJOR PATENTS PERTAINING TO DAIRY ALTERNATIVES MARKET, 2013–2022
           FIGURE 25 NUMBER OF PATENTS GRANTED, 2013–2022
           FIGURE 26 REGIONAL ANALYSIS OF PATENTS GRANTED
    6.10 KEY CONFERENCES & EVENTS 
           TABLE 14 DETAILED LIST OF KEY CONFERENCES & EVENTS, 2022–2023
    6.11 TARIFF AND REGULATORY LANDSCAPE 
           6.11.1 CODEX ALIMENTARIUS COMMISSION
           6.11.2 FOOD AND DRUG ADMINISTRATION (FDA)
           6.11.3 THE SOYFOODS ASSOCIATION OF AMERICA
                    6.11.3.1 Classification of Soymilk
                               TABLE 15 SOYMILK COMPOSITION
           6.11.4 FOOD STANDARDS AUSTRALIA NEW ZEALAND (FSANZ)
                    TABLE 16 SOME MANDATORY ADVISORY STATEMENTS GIVEN BY FSANZ
           6.11.5 EUROPEAN COURT OF JUSTICE
                    TABLE 17 LIST OF KEY REGULATORY BODIES FOR DAIRY ALTERNATIVES
    6.12 PORTER’S FIVE FORCES ANALYSIS 
                    TABLE 18 IMPACT OF PORTER’S FIVE FORCES
           6.12.1 INTENSITY OF COMPETITIVE RIVALRY
           6.12.2 BARGAINING POWER OF SUPPLIERS
           6.12.3 BARGAINING POWER OF BUYERS
           6.12.4 THREAT OF SUBSTITUTES
           6.12.5 THREAT OF NEW ENTRANTS
    6.13 CASE STUDY ANALYSIS 
           6.13.1 DANONE NORTH AMERICA LAUNCHED DAIRY-LIKE SEGMENT BY INTRODUCING SILK NEXTMILK AND SO DELICIOUS WONDERMILK
           6.13.2 BLUE DIAMOND GROWERS PARTNERED WITH GROUP LALA TO ESTABLISH NETWORK IN MEXICO
    6.14 KEY STAKEHOLDERS & BUYING CRITERIA 
           6.14.1 KEY STAKEHOLDERS IN BUYING PROCESS
                    FIGURE 27 INFLUENCE OF STAKEHOLDERS ON BUYING PROCESS, BY KEY APPLICATION
                    TABLE 19 INFLUENCE OF STAKEHOLDERS ON BUYING PROCESS, BY KEY APPLICATION
           6.14.2 BUYING CRITERIA
                    TABLE 20 KEY CRITERIA FOR SELECTING SUPPLIERS/VENDORS, BY KEY APPLICATION
                    FIGURE 28 KEY CRITERIA FOR SELECTING SUPPLIERS/VENDORS, BY KEY APPLICATION
 
7 DAIRY ALTERNATIVES MARKET, BY SOURCE (Page No. - 83)
    7.1 INTRODUCTION 
           FIGURE 29 DAIRY ALTERNATIVES MARKET, BY SOURCE, 2023 VS. 2028 (USD MILLION)
           TABLE 21 DAIRY ALTERNATIVES MARKET, BY SOURCE, 2018–2022 (USD MILLION)
           TABLE 22 DAIRY ALTERNATIVES MARKET, BY SOURCE, 2023–2028 (USD MILLION)
    7.2 SOY 
           7.2.1 WIDESPREAD ACCESSIBILITY AND POPULARITY OF SOY-DERIVED ITEMS TO BOOST GROWTH
           7.2.2 MILK
                    FIGURE 30 HISTORICAL & PROJECTED SOYMILK SALES, 2016–2022 (USD MILLION)
           7.2.3 YOGURT
           7.2.4 OTHER SOY APPLICATIONS
                    FIGURE 31 SOY-BASED PRODUCT CONSUMPTION, BY APPLICATION, 2019
                    TABLE 23 SOY-BASED DAIRY ALTERNATIVES MARKET, BY REGION, 2018–2022 (USD MILLION)
                    TABLE 24 SOY-BASED DAIRY ALTERNATIVES MARKET, BY REGION, 2023–2028 (USD MILLION)
    7.3 ALMOND 
           7.3.1 RISE IN DEMAND FOR MIXED ALMOND-DERIVED ITEMS SUPPLY TO DRIVE MARKET
           7.3.2 MILK
           7.3.3 YOGURT
           7.3.4 OTHER ALMOND APPLICATIONS
                    FIGURE 32 ALMOND PRODUCT CONSUMPTION, BY APPLICATION, 2019
                    TABLE 25 ALMOND-BASED DAIRY ALTERNATIVES MARKET, BY REGION, 2018–2022 (USD MILLION)
                    TABLE 26 ALMOND-BASED DAIRY ALTERNATIVES MARKET, BY REGION, 2023–2028 (USD MILLION)
    7.4 COCONUT 
           7.4.1 COCONUT'S APPEALING TASTE AND NUTRITIONAL BENEFITS TO BOLSTER GROWTH
           7.4.2 MILK
           7.4.3 YOGURT
           7.4.4 OTHER COCONUT APPLICATIONS
                    FIGURE 33 COCONUT PRODUCT CONSUMPTION, BY APPLICATION, 2019
                    TABLE 27 COCONUT-BASED DAIRY ALTERNATIVES MARKET, BY REGION, 2018–2022 (USD MILLION)
                    TABLE 28 COCONUT-BASED DAIRY ALTERNATIVES MARKET, BY REGION, 2023–2028 (USD MILLION)
    7.5 RICE 
           7.5.1 DECREASED POTENTIAL FOR ALLERGIES AND LESS DISTINCTIVE TASTE TO DRIVE RICE SEGMENT
           7.5.2 MILK
           7.5.3 YOGURT
           7.5.4 OTHER RICE APPLICATIONS
                    FIGURE 34 RICE PRODUCT CONSUMPTION, BY APPLICATION, 2019
                    TABLE 29 RICE-BASED DAIRY ALTERNATIVES MARKET, BY REGION, 2018–2022 (USD MILLION)
                    TABLE 30 RICE-BASED DAIRY ALTERNATIVES MARKET, BY REGION, 2023–2028 (USD MILLION)
    7.6 OATS 
           7.6.1 RICH NUTRITIONAL CONTENT OF OAT-DERIVED DAIRY ALTERNATIVES TO DRIVE MARKET
           7.6.2 MILK
           7.6.3 YOGURT
           7.6.4 OTHER OAT APPLICATIONS
                    FIGURE 35 OAT PRODUCT CONSUMPTION, BY APPLICATION, 2019
                    TABLE 31 OAT-BASED DAIRY ALTERNATIVES MARKET, BY REGION, 2018–2022 (USD MILLION)
                    TABLE 32 OAT-BASED DAIRY ALTERNATIVES MARKET, BY REGION, 2023–2028 (USD MILLION)
    7.7 HEMP 
           7.7.1 RISE IN HEALTH AWARENESS REGARDING HEMP-BASED DAIRY ALTERNATIVES TO PROPEL MARKET
           7.7.2 MILK
           7.7.3 YOGURT
           7.7.4 OTHER HEMP APPLICATIONS
                    FIGURE 36 HEMP PRODUCT CONSUMPTION, BY APPLICATION, 2019
                    TABLE 33 HEMP-BASED DAIRY ALTERNATIVES MARKET, BY REGION, 2018–2022 (USD MILLION)
                    TABLE 34 HEMP-BASED DAIRY ALTERNATIVES MARKET, BY REGION, 2023–2028 (USD MILLION)
    7.8 OTHER SOURCES 
           TABLE 35 NUTRITIONAL COMPARISON OF KEY COMMERCIALLY AVAILABLE PLANT-BASED MILK ALTERNATIVES
           TABLE 36 FUNCTIONAL COMPONENTS OF PLANT-BASED MILK ALTERNATIVES AND THEIR HEALTH BENEFITS
           TABLE 37 OTHER SOURCE-BASED DAIRY ALTERNATIVES MARKET, BY REGION, 2018–2022 (USD MILLION)
           TABLE 38 OTHER SOURCE-BASED DAIRY ALTERNATIVES MARKET, BY REGION, 2023–2028 (USD MILLION)
 
8 DAIRY ALTERNATIVES MARKET, BY FORMULATION (Page No. - 104)
    8.1 INTRODUCTION 
           FIGURE 37 DAIRY ALTERNATIVES MARKET, BY FORMULATION, 2023 VS. 2028 (USD MILLION)
           TABLE 39 DAIRY ALTERNATIVES MARKET, BY FORMULATION, 2018–2022 (USD MILLION)
           TABLE 40 DAIRY ALTERNATIVES MARKET, BY FORMULATION, 2023–2028 (USD MILLION)
    8.2 FLAVORED 
           8.2.1 INCREASE IN DEMAND FOR PALATABLE BUT HEALTHIER DAIRY ALTERNATIVES TO DRIVE GROWTH
                    TABLE 41 FLAVORED DAIRY ALTERNATIVES MARKET, BY REGION, 2018–2022 (USD MILLION)
                    TABLE 42 FLAVORED DAIRY ALTERNATIVES MARKET, BY REGION, 2023–2028 (USD MILLION)
    8.3 PLAIN 
           8.3.1 VERSATILITY OF APPLICATION OF PLAIN ALTERNATIVES TO BOLSTER GROWTH
                    TABLE 43 PLAIN DAIRY ALTERNATIVES MARKET, BY REGION, 2018–2022 (USD MILLION)
                    TABLE 44 PLAIN DAIRY ALTERNATIVES MARKET, BY REGION, 2023–2028 (USD MILLION)
 
9 DAIRY ALTERNATIVES MARKET, BY APPLICATION (Page No. - 110)
    9.1 INTRODUCTION 
           FIGURE 38 DAIRY ALTERNATIVES MARKET, BY APPLICATION, 2023 VS. 2028 (USD MILLION)
           TABLE 45 DAIRY ALTERNATIVES MARKET, BY APPLICATION, 2018–2022 (USD MILLION)
           TABLE 46 DAIRY ALTERNATIVES MARKET, BY APPLICATION, 2023–2028 (USD MILLION)
           TABLE 47 DAIRY ALTERNATIVES MARKET, BY APPLICATION, 2018–2022 (MILLION LITERS)
           TABLE 48 DAIRY ALTERNATIVES MARKET, BY APPLICATION, 2023–2028 (MILLION LITERS)
    9.2 MILK 
           9.2.1 HIGHER AWARENESS ABOUT HEALTH BENEFITS OF MILK ALTERNATIVES TO BOOST GROWTH
                    FIGURE 39 PLANT-BASED MILK SALES, 2016–2022 (USD MILLION)
                    TABLE 49 NUTRITIONAL COMPOSITION OF PLANT-BASED MILK ALTERNATIVES (PER 100 ML)
                    TABLE 50 DAIRY ALTERNATIVES MARKET IN MILK APPLICATIONS, BY REGION, 2018–2022 (USD MILLION)
                    TABLE 51 DAIRY ALTERNATIVES MARKET IN MILK APPLICATIONS, BY REGION, 2023–2028 (USD MILLION)
    9.3 ICE CREAM 
           9.3.1 BENEFITS OF CHOLESTEROL-AND FAT-FREE DESSERTS TO DRIVE GROWTH
                    TABLE 52 DAIRY ALTERNATIVES MARKET IN ICE CREAM APPLICATIONS, BY REGION, 2018–2022 (USD MILLION)
                    TABLE 53 DAIRY ALTERNATIVES MARKET IN ICE CREAM APPLICATIONS, BY REGION, 2023–2028 (USD MILLION)
    9.4 YOGURT 
           9.4.1 INCREASE IN POPULARITY OF FORTIFIED YOGURT TO PROPEL MARKET GROWTH
                    TABLE 54 DAIRY ALTERNATIVES MARKET IN YOGURT APPLICATIONS, BY REGION, 2018–2022 (USD MILLION)
                    TABLE 55 DAIRY ALTERNATIVES MARKET IN YOGURT APPLICATIONS, BY REGION, 2023–2028 (USD MILLION)
    9.5 CHEESE 
           9.5.1 HIGH REPEAT BUYING RATES OF PLANT-BASED CHEESE TO DRIVE GROWTH
                    TABLE 56 DAIRY ALTERNATIVES MARKET IN CHEESE APPLICATIONS, BY REGION, 2018–2022 (USD MILLION)
                    TABLE 57 DAIRY ALTERNATIVES MARKET IN CHEESE APPLICATIONS, BY REGION, 2023–2028 (USD MILLION)
    9.6 CREAMERS 
           9.6.1 HEAVY INVESTMENTS IN R&D TO MEET GROWING DEMAND FOR DAIRY-FREE CREAMERS TO DRIVE GROWTH
                    TABLE 58 DAIRY ALTERNATIVES MARKET IN CREAMER APPLICATIONS, BY REGION, 2018–2022 (USD MILLION)
                    TABLE 59 DAIRY ALTERNATIVES MARKET IN CREAMER APPLICATIONS, BY REGION, 2023–2028 (USD MILLION)
    9.7 BUTTER 
           9.7.1 LOWER SATURATED FATS, WITH SIMILAR FUNCTIONALITIES TO DAIRY BUTTER, TO DRIVE ADOPTION OF PLANT-BASED BUTTER
                    TABLE 60 NUTRITIONAL COMPOSITION OF PLANT-BASED BUTTER (PER 100 ML)
                    TABLE 61 DAIRY ALTERNATIVES MARKET IN BUTTER APPLICATIONS, BY REGION, 2018–2022 (USD MILLION)
                    TABLE 62 DAIRY ALTERNATIVES MARKET IN BUTTER APPLICATIONS, BY REGION, 2023–2028 (USD MILLION)
    9.8 OTHER APPLICATIONS 
           TABLE 63 DAIRY ALTERNATIVES MARKET IN OTHER APPLICATIONS, BY REGION, 2018–2022 (USD MILLION)
           TABLE 64 DAIRY ALTERNATIVES MARKET IN OTHER APPLICATIONS, BY REGION, 2023–2028 (USD MILLION)
 
10 DAIRY ALTERNATIVES MARKET, BY DISTRIBUTION CHANNEL (Page No. - 123)
     10.1 INTRODUCTION 
               FIGURE 40 DAIRY ALTERNATIVES MARKET, BY DISTRIBUTION CHANNEL, 2023 VS. 2028 (USD MILLION)
               TABLE 65 DAIRY ALTERNATIVES MARKET, BY DISTRIBUTION CHANNEL, 2018–2022 (USD MILLION)
               TABLE 66 DAIRY ALTERNATIVES MARKET, BY DISTRIBUTION CHANNEL, 2023–2028 (USD MILLION)
     10.2 RETAIL 
               TABLE 67 RETAIL DISTRIBUTION MARKET, BY SUBTYPE, 2018–2022 (USD MILLION)
               TABLE 68 RETAIL DISTRIBUTION MARKET, BY SUBTYPE, 2023–2028 (USD MILLION)
               TABLE 69 RETAIL DISTRIBUTION CHANNELS MARKET, BY REGION, 2018–2022 (USD MILLION)
               TABLE 70 RETAIL DISTRIBUTION CHANNELS MARKET, BY REGION, 2023–2028 (USD MILLION)
             10.2.1 SUPERMARKETS/HYPERMARKETS
                       10.2.1.1 Greater convenience and availability of multiple food options for consumers to drive segment
                                   TABLE 71 SUPERMARKET/HYPERMARKET DISTRIBUTION CHANNELS MARKET, BY REGION, 2018–2022 (USD MILLION)
                                   TABLE 72 SUPERMARKET/HYPERMARKET DISTRIBUTION CHANNELS MARKET, BY REGION, 2023–2028 (USD MILLION)
             10.2.2 HEALTH FOOD STORES
                       10.2.2.1 Prioritizing clean and nutritious food choices for health benefits to encourage segment expansion
                                   TABLE 73 HEALTH FOOD STORE DISTRIBUTION CHANNELS MARKET, BY REGION, 2018–2022 (USD MILLION)
                                   TABLE 74 HEALTH FOOD STORE DISTRIBUTION CHANNELS MARKET, BY REGION, 2023–2028 (USD MILLION)
             10.2.3 PHARMACIES
                       10.2.3.1 Increase in health issues and prescriptions for allergies to spur growth
                                   TABLE 75 PHARMACY DISTRIBUTION CHANNELS MARKET, BY REGION, 2018–2022 (USD MILLION)
                                   TABLE 76 PHARMACY DISTRIBUTION CHANNELS MARKET, BY REGION, 2023–2028 (USD MILLION)
             10.2.4 CONVENIENCE STORES
                       10.2.4.1 Higher demand for easy access and convenience to customers to boost growth
                                   TABLE 77 CONVENIENCE STORE DISTRIBUTION CHANNELS MARKET, BY REGION, 2018–2022 (USD MILLION)
                                   TABLE 78 CONVENIENCE STORE DISTRIBUTION CHANNELS MARKET, BY REGION, 2023–2028 (USD MILLION)
             10.2.5 OTHER RETAIL CHANNELS
                       TABLE 79 OTHER RETAIL CHANNELS MARKET, BY REGION, 2018–2022 (USD MILLION)
                       TABLE 80 OTHER RETAIL CHANNELS MARKET, BY REGION, 2023–2028 (USD MILLION)
     10.3 FOOD SERVICES 
             10.3.1 RISE IN NEED TO ACCOMMODATE CHANGING CONSUMER PREFERENCES TO DRIVE GROWTH
                       TABLE 81 FOOD SERVICE CHANNELS MARKET, BY REGION, 2018–2022 (USD MILLION)
                       TABLE 82 FOOD SERVICE CHANNELS MARKET, BY REGION, 2023–2028 (USD MILLION)
     10.4 ONLINE STORES 
             10.4.1 DEMAND FOR QUICK ACCESSIBILITY AND COST-EFFECTIVE PURCHASES TO PROPEL MARKET
                       TABLE 83 ONLINE STORES MARKET, BY REGION, 2018–2022 (USD MILLION)
                       TABLE 84 ONLINE STORES MARKET, BY REGION, 2023–2028 (USD MILLION)
 
11 DAIRY ALTERNATIVES MARKET, BY NUTRIENT (Page No. - 134)
     11.1 INTRODUCTION 
               TABLE 85 NUTRIENT CONTENT IN DAIRY ALTERNATIVES(PER 100 ML)
     11.2 PROTEIN 
     11.3 STARCH 
     11.4 VITAMINS 
     11.5 OTHER NUTRIENTS 
 
12 DAIRY ALTERNATIVES MARKET, BY REGION (Page No. - 136)
     12.1 INTRODUCTION 
               FIGURE 41 SPAIN TO RECORD HIGHEST GROWTH RATE DURING FORECAST PERIOD
               TABLE 86 DAIRY ALTERNATIVES MARKET, BY REGION, 2018–2022 (USD MILLION)
               TABLE 87 DAIRY ALTERNATIVES MARKET, BY REGION, 2023–2028 (USD MILLION)
               TABLE 88 DAIRY ALTERNATIVES MARKET, BY REGION, 2018–2022 (MILLION LITERS)
               TABLE 89 DAIRY ALTERNATIVES MARKET, BY REGION, 2023–2028 (MILLION LITERS)
     12.2 MACROECONOMIC INDICATORS OF RECESSION 
               FIGURE 42 INDICATORS OF RECESSION
               FIGURE 43 GLOBAL INFLATION RATES, 2011–2022
               FIGURE 44 GLOBAL GDP, 2011–2022 (USD TRILLION)
               FIGURE 45 RECESSION INDICATORS AND THEIR IMPACT ON DAIRY ALTERNATIVES MARKET
               FIGURE 46 DAIRY ALTERNATIVES MARKET: PREVIOUS FORECAST VS. RECESSION IMPACT FORECAST, 2023
     12.3 NORTH AMERICA 
             12.3.1 NORTH AMERICA: RECESSION IMPACT ANALYSIS
                       FIGURE 47 NORTH AMERICA: INFLATION RATES, BY COUNTRY, 2017–2022
                       FIGURE 48 NORTH AMERICA: DAIRY ALTERNATIVES MARKET, RECESSION IMPACT ANALYSIS, 2023
                       TABLE 90 NORTH AMERICA: DAIRY ALTERNATIVES MARKET, BY COUNTRY, 2018–2022 (USD MILLION)
                       TABLE 91 NORTH AMERICA: DAIRY ALTERNATIVES MARKET, BY COUNTRY, 2023–2028 (USD MILLION)
                       TABLE 92 NORTH AMERICA: DAIRY ALTERNATIVES MARKET, BY SOURCE, 2018–2022 (USD MILLION)
                       TABLE 93 NORTH AMERICA: DAIRY ALTERNATIVES MARKET, BY SOURCE, 2023–2028 (USD MILLION)
                       TABLE 94 NORTH AMERICA: DAIRY ALTERNATIVES MARKET, BY FORMULATION, 2018–2022 (USD MILLION)
                       TABLE 95 NORTH AMERICA: DAIRY ALTERNATIVES MARKET, BY FORMULATION, 2023–2028 (USD MILLION)
                       TABLE 96 NORTH AMERICA: DAIRY ALTERNATIVES MARKET, BY APPLICATION, 2018–2022 (USD MILLION)
                       TABLE 97 NORTH AMERICA: DAIRY ALTERNATIVES MARKET, BY APPLICATION, 2023–2028 (USD MILLION)
                       TABLE 98 NORTH AMERICA: DAIRY ALTERNATIVES MARKET, BY APPLICATION, 2018–2022 (MILLION LITERS)
                       TABLE 99 NORTH AMERICA: DAIRY ALTERNATIVES MARKET, BY APPLICATION, 2023–2028 (MILLION LITERS)
                       TABLE 100 NORTH AMERICA: DAIRY ALTERNATIVES MARKET, BY DISTRIBUTION CHANNEL, 2018–2022 (USD MILLION)
                       TABLE 101 NORTH AMERICA: DAIRY ALTERNATIVES MARKET, BY DISTRIBUTION CHANNEL, 2023–2028 (USD MILLION)
                       TABLE 102 NORTH AMERICA: RETAIL DISTRIBUTION CHANNEL MARKET, BY SUBTYPE, 2018–2022 (USD MILLION)
                       TABLE 103 NORTH AMERICA: RETAIL DISTRIBUTION CHANNEL MARKET, BY SUBTYPE, 2023–2028 (USD MILLION)
             12.3.2 US
                       12.3.2.1 High income of families to drive demand for dairy alternatives
                                   FIGURE 49 US: PLANT-BASED MILK RETAIL MARKET, 2019–2022 (USD BILLION)
                                   TABLE 104 US: DAIRY ALTERNATIVES MARKET, BY SOURCE, 2018–2022 (USD MILLION)
                                   TABLE 105 US: DAIRY ALTERNATIVES MARKET, BY SOURCE, 2023–2028 (USD MILLION)
             12.3.3 CANADA
                       12.3.3.1 Change in consumer preference toward protein-rich dairy substitutes to boost growth
                                   TABLE 106 CANADA: DAIRY ALTERNATIVES MARKET, BY SOURCE, 2018–2022 (USD MILLION)
                                   TABLE 107 CANADA: DAIRY ALTERNATIVES MARKET, BY SOURCE, 2023–2028 (USD MILLION)
             12.3.4 MEXICO
                       12.3.4.1 Urbanization and environment-consciousness to propel market
                                   FIGURE 50 MEXICO: SOY FOOD SALES, BY TYPE, 2017–2020 (USD MILLION)
                                   TABLE 108 MEXICO: DAIRY ALTERNATIVES MARKET, BY SOURCE, 2018–2022 (USD MILLION)
                                   TABLE 109 MEXICO: DAIRY ALTERNATIVES MARKET, BY SOURCE, 2023–2028 (USD MILLION)
     12.4 EUROPE 
               FIGURE 51 EUROPE: DAIRY ALTERNATIVES MARKET SNAPSHOT
             12.4.1 EUROPE: RECESSION IMPACT ANALYSIS
                       FIGURE 52 EUROPE: INFLATION RATES, BY COUNTRY 2017–2022
                       FIGURE 53 EUROPE: DAIRY ALTERNATIVES MARKET, RECESSION IMPACT ANALYSIS, 2023
                       TABLE 110 EUROPE: DAIRY ALTERNATIVES MARKET, BY COUNTRY, 2018–2022 (USD MILLION)
                       TABLE 111 EUROPE: DAIRY ALTERNATIVES MARKET, BY COUNTRY, 2023–2028 (USD MILLION)
                       TABLE 112 EUROPE: DAIRY ALTERNATIVES MARKET, BY SOURCE, 2018–2022 (USD MILLION)
                       TABLE 113 EUROPE: DAIRY ALTERNATIVES MARKET, BY SOURCE, 2023–2028 (USD MILLION)
                       TABLE 114 EUROPE: DAIRY ALTERNATIVES MARKET, BY FORMULATION, 2018–2022 (USD MILLION)
                       TABLE 115 EUROPE: DAIRY ALTERNATIVES MARKET, BY FORMULATION, 2023–2028 (USD MILLION)
                       TABLE 116 EUROPE: DAIRY ALTERNATIVES MARKET, BY APPLICATION, 2018–2022 (USD MILLION)
                       TABLE 117 EUROPE: DAIRY ALTERNATIVES MARKET, BY APPLICATION, 2023–2028 (USD MILLION)
                       TABLE 118 EUROPE: DAIRY ALTERNATIVES MARKET, BY APPLICATION, 2018–2022 (MILLION LITERS)
                       TABLE 119 EUROPE: DAIRY ALTERNATIVES MARKET, BY APPLICATION, 2023–2028 (MILLION LITERS)
                       TABLE 120 EUROPE: DAIRY ALTERNATIVES MARKET, BY DISTRIBUTION CHANNEL, 2018–2022 (USD MILLION)
                       TABLE 121 EUROPE: DAIRY ALTERNATIVES MARKET, BY DISTRIBUTION CHANNEL, 2023–2028 (USD MILLION)
                       TABLE 122 EUROPE: RETAIL DISTRIBUTION CHANNEL MARKET, BY SUBTYPE, 2018–2022 (USD MILLION)
                       TABLE 123 EUROPE: RETAIL DISTRIBUTION CHANNEL MARKET, BY SUBTYPE, 2023–2028 (USD MILLION)
             12.4.2 UK
                       12.4.2.1 Inclination among younger consumers toward healthy, vegan products to propel market
                                   TABLE 124 UK: DAIRY ALTERNATIVES MARKET, BY SOURCE, 2018–2022 (USD MILLION)
                                   TABLE 125 UK: DAIRY ALTERNATIVES MARKET, BY SOURCE, 2023–2028 (USD MILLION)
             12.4.3 GERMANY
                       12.4.3.1 Growth in vegetarianism to drive market
                                   FIGURE 54 GERMANY: PLANT-BASED FOOD SALES, BY APPLICATION, 2022 (USD MILLION)
                                   TABLE 126 GERMANY: DAIRY ALTERNATIVES MARKET, BY SOURCE, 2018–2022 (USD MILLION)
                                   TABLE 127 GERMANY: DAIRY ALTERNATIVES MARKET, BY SOURCE, 2023–2028 (USD MILLION)
             12.4.4 ITALY
                       12.4.4.1 High consumption of cheese in Italian cuisine to spur growth
                                   FIGURE 55 ITALY: PLANT-BASED CHEESE SALES, 2020–2022 (USD MILLION)
                                   TABLE 128 ITALY: DAIRY ALTERNATIVES MARKET, BY SOURCE, 2018–2022 (USD MILLION)
                                   TABLE 129 ITALY: DAIRY ALTERNATIVES MARKET, BY SOURCE, 2023–2028 (USD MILLION)
             12.4.5 FRANCE
                       12.4.5.1 Dairy giants expanding to provide alternatives to boost growth
                                   FIGURE 56 FRANCE: PLANT-BASED MILK SALES, 2021–2022 (USD MILLION)
                                   TABLE 130 FRANCE: DAIRY ALTERNATIVES MARKET, BY SOURCE, 2018–2022 (USD MILLION)
                                   TABLE 131 FRANCE: DAIRY ALTERNATIVES MARKET, BY SOURCE, 2023–2028 (USD MILLION)
             12.4.6 SPAIN
                       12.4.6.1 Demand for dairy replacements and expansion of supermarket vegetarian and vegan lines to bolster growth
                                   TABLE 132 SPAIN: DAIRY ALTERNATIVES MARKET, BY SOURCE, 2018–2022 (USD MILLION)
                                   TABLE 133 SPAIN: DAIRY ALTERNATIVES MARKET, BY SOURCE, 2023–2028 (USD MILLION)
             12.4.7 REST OF EUROPE
                       TABLE 134 REST OF EUROPE: DAIRY ALTERNATIVES MARKET, BY SOURCE, 2018–2022 (USD MILLION)
                       TABLE 135 REST OF EUROPE: DAIRY ALTERNATIVES MARKET, BY SOURCE, 2023–2028 (USD MILLION)
     12.5 ASIA PACIFIC 
               FIGURE 57 ASIA PACIFIC: DAIRY ALTERNATIVES MARKET SNAPSHOT
             12.5.1 ASIA PACIFIC: RECESSION IMPACT ANALYSIS
                       FIGURE 58 ASIA PACIFIC: INFLATION RATES, BY KEY COUNTRY, 2017–2022
                       FIGURE 59 ASIA PACIFIC: DAIRY ALTERNATIVES MARKET, RECESSION IMPACT ANALYSIS, 2023
                       TABLE 136 ASIA PACIFIC: DAIRY ALTERNATIVES MARKET, BY COUNTRY, 2018–2022 (USD MILLION)
                       TABLE 137 ASIA PACIFIC: DAIRY ALTERNATIVES MARKET, BY COUNTRY, 2023–2028 (USD MILLION)
                       TABLE 138 ASIA PACIFIC: DAIRY ALTERNATIVES MARKET, BY SOURCE, 2018–2022 (USD MILLION)
                       TABLE 139 ASIA PACIFIC: DAIRY ALTERNATIVES MARKET, BY SOURCE, 2023–2028 (USD MILLION)
                       TABLE 140 ASIA PACIFIC: DAIRY ALTERNATIVES MARKET, BY FORMULATION, 2018–2022 (USD MILLION)
                       TABLE 141 ASIA PACIFIC: DAIRY ALTERNATIVES MARKET, BY FORMULATION, 2023–2028 (USD MILLION)
                       TABLE 142 ASIA PACIFIC: DAIRY ALTERNATIVES MARKET, BY APPLICATION, 2018–2022 (USD MILLION)
                       TABLE 143 ASIA PACIFIC: DAIRY ALTERNATIVES MARKET, BY APPLICATION, 2023–2028 (USD MILLION)
                       TABLE 144 ASIA PACIFIC: DAIRY ALTERNATIVES MARKET, BY APPLICATION, 2018–2022 (MILLION LITERS)
                       TABLE 145 ASIA PACIFIC: DAIRY ALTERNATIVES MARKET, BY APPLICATION, 2023–2028 (MILLION LITERS)
                       TABLE 146 ASIA PACIFIC: DAIRY ALTERNATIVES MARKET, BY DISTRIBUTION CHANNEL, 2018–2022 (USD MILLION)
                       TABLE 147 ASIA PACIFIC: DAIRY ALTERNATIVES MARKET, BY DISTRIBUTION CHANNEL, 2023–2028 (USD MILLION)
                       TABLE 148 ASIA PACIFIC: RETAIL DISTRIBUTION CHANNEL MARKET, BY SUBTYPE, 2018–2022 (USD MILLION)
                       TABLE 149 ASIA PACIFIC: RETAIL DISTRIBUTION CHANNEL MARKET, BY SUBTYPE, 2023–2028 (USD MILLION)
             12.5.2 CHINA
                       12.5.2.1 Adoption of soy-derived dairy alternatives in various Chinese cuisines to drive growth
                                   TABLE 150 CHINA: DAIRY ALTERNATIVES MARKET, BY SOURCE, 2018–2022 (USD MILLION)
                                   TABLE 151 CHINA: DAIRY ALTERNATIVES MARKET, BY SOURCE, 2023–2028 (USD MILLION)
             12.5.3 JAPAN
                       12.5.3.1 Scope for high-protein healthy products in traditional recipes to boost growth
                                   TABLE 152 JAPAN: DAIRY ALTERNATIVES MARKET, BY SOURCE, 2018–2022 (USD MILLION)
                                   TABLE 153 JAPAN: DAIRY ALTERNATIVES MARKET, BY SOURCE, 2023–2028 (USD MILLION)
             12.5.4 AUSTRALIA & NEW ZEALAND
                       12.5.4.1 Consumer interest in paying premium for fitness products to propel market
                                   TABLE 154 AUSTRALIA & NEW ZEALAND: DAIRY ALTERNATIVES MARKET, BY SOURCE, 2018–2022 (USD MILLION)
                                   TABLE 155 AUSTRALIA & NEW ZEALAND: DAIRY ALTERNATIVES MARKET, BY SOURCE, 2023–2028 (USD MILLION)
             12.5.5 INDIA
                       12.5.5.1 Growth in demand for dairy-free substitutes in traditional sweets to boost market
                                   TABLE 156 INDIA: DAIRY ALTERNATIVES MARKET, BY SOURCE, 2018–2022 (USD MILLION)
                                   TABLE 157 INDIA: DAIRY ALTERNATIVES MARKET, BY SOURCE, 2023–2028 (USD MILLION)
             12.5.6 REST OF ASIA PACIFIC
                       TABLE 158 REST OF ASIA PACIFIC: DAIRY ALTERNATIVES MARKET, BY SOURCE, 2018–2022 (USD MILLION)
                       TABLE 159 REST OF ASIA PACIFIC: DAIRY ALTERNATIVES MARKET, BY SOURCE, 2023–2028 (USD MILLION)
     12.6 SOUTH AMERICA 
             12.6.1 SOUTH AMERICA: RECESSION IMPACT ANALYSIS
                       FIGURE 60 SOUTH AMERICA: INFLATION RATES, BY KEY COUNTRY, 2017–2022
                       FIGURE 61 SOUTH AMERICA: DAIRY ALTERNATIVES MARKET, RECESSION IMPACT ANALYSIS, 2023
                       TABLE 160 SOUTH AMERICA: DAIRY ALTERNATIVES MARKET, BY COUNTRY, 2018–2022 (USD MILLION)
                       TABLE 161 SOUTH AMERICA: DAIRY ALTERNATIVES MARKET, BY COUNTRY, 2023–2028 (USD MILLION)
                       TABLE 162 SOUTH AMERICA: DAIRY ALTERNATIVES MARKET, BY SOURCE, 2018–2022 (USD MILLION)
                       TABLE 163 SOUTH AMERICA: DAIRY ALTERNATIVES MARKET, BY SOURCE, 2023–2028 (USD MILLION)
                       TABLE 164 SOUTH AMERICA: DAIRY ALTERNATIVES MARKET, BY FORMULATION, 2018–2022 (USD MILLION)
                       TABLE 165 SOUTH AMERICA: DAIRY ALTERNATIVES MARKET, BY FORMULATION, 2023–2028 (USD MILLION)
                       TABLE 166 SOUTH AMERICA: DAIRY ALTERNATIVES MARKET, BY APPLICATION, 2018–2022 (USD MILLION)
                       TABLE 167 SOUTH AMERICA: DAIRY ALTERNATIVES MARKET, BY APPLICATION, 2023–2028 (USD MILLION)
                       TABLE 168 SOUTH AMERICA: DAIRY ALTERNATIVES MARKET, BY APPLICATION, 2018–2022 (MILLION LITERS)
                       TABLE 169 SOUTH AMERICA: DAIRY ALTERNATIVES MARKET, BY APPLICATION, 2023–2028 (MILLION LITERS)
                       TABLE 170 SOUTH AMERICA: DAIRY ALTERNATIVES MARKET, BY DISTRIBUTION CHANNEL, 2018–2022 (USD MILLION)
                       TABLE 171 SOUTH AMERICA: DAIRY ALTERNATIVES MARKET, BY DISTRIBUTION CHANNEL, 2023–2028 (USD MILLION)
                       TABLE 172 SOUTH AMERICA: RETAIL DISTRIBUTION CHANNEL MARKET, BY SUBTYPE, 2018–2022 (USD MILLION)
                       TABLE 173 SOUTH AMERICA: RETAIL DISTRIBUTION CHANNEL MARKET, BY SUBTYPE, 2023–2028 (USD MILLION)
             12.6.2 BRAZIL
                       12.6.2.1 Demand for soy-based clean label products to drive market
                                   TABLE 174 BRAZIL: DAIRY ALTERNATIVES MARKET, BY SOURCE, 2018–2022 (USD MILLION)
                                   TABLE 175 BRAZIL: DAIRY ALTERNATIVES MARKET, BY SOURCE, 2023–2028 (USD MILLION)
             12.6.3 ARGENTINA
                       12.6.3.1 Production of soy to help meet vegan, gluten-and fat-free demands
                                   TABLE 176 ARGENTINA: DAIRY ALTERNATIVES MARKET, BY SOURCE, 2018–2022 (USD MILLION)
                                   TABLE 177 ARGENTINA: DAIRY ALTERNATIVES MARKET, BY SOURCE, 2023–2028 (USD MILLION)
             12.6.4 REST OF SOUTH AMERICA
                       TABLE 178 REST OF SOUTH AMERICA: DAIRY ALTERNATIVES MARKET, BY SOURCE, 2018–2022 (USD MILLION)
                       TABLE 179 REST OF SOUTH AMERICA: DAIRY ALTERNATIVES MARKET, BY SOURCE, 2023–2028 (USD MILLION)
     12.7 REST OF THE WORLD (ROW) 
             12.7.1 ROW: RECESSION IMPACT ANALYSIS
                       FIGURE 62 ROW: INFLATION RATES, BY KEY REGION, 2017–2022
                       FIGURE 63 ROW: DAIRY ALTERNATIVE MARKET, RECESSION IMPACT ANALYSIS, 2023
                       TABLE 180 ROW: DAIRY ALTERNATIVES MARKET, BY REGION, 2018–2022 (USD MILLION)
                       TABLE 181 ROW: DAIRY ALTERNATIVES MARKET, BY REGION, 2023–2028 (USD MILLION)
                       TABLE 182 ROW: DAIRY ALTERNATIVES MARKET, BY SOURCE, 2018–2022 (USD MILLION)
                       TABLE 183 ROW: DAIRY ALTERNATIVES MARKET, BY SOURCE, 2023–2028 (USD MILLION)
                       TABLE 184 ROW: DAIRY ALTERNATIVES MARKET, BY FORMULATION, 2018–2022 (USD MILLION)
                       TABLE 185 ROW: DAIRY ALTERNATIVES MARKET, BY FORMULATION, 2023–2028 (USD MILLION)
                       TABLE 186 ROW: DAIRY ALTERNATIVES MARKET, BY APPLICATION, 2018–2022 (USD MILLION)
                       TABLE 187 ROW: DAIRY ALTERNATIVES MARKET, BY APPLICATION, 2023–2028 (USD MILLION)
                       TABLE 188 ROW: DAIRY ALTERNATIVES MARKET, BY APPLICATION, 2018–2022 (MILLION LITERS)
                       TABLE 189 ROW: DAIRY ALTERNATIVES MARKET, BY APPLICATION, 2023–2028 (MILLION LITERS)
                       TABLE 190 ROW: DAIRY ALTERNATIVES MARKET, BY DISTRIBUTION CHANNEL, 2018–2022 (USD MILLION)
                       TABLE 191 ROW: DAIRY ALTERNATIVES MARKET, BY DISTRIBUTION CHANNEL, 2023–2028 (USD MILLION)
                       TABLE 192 ROW: RETAIL DISTRIBUTION CHANNEL MARKET, BY SUBTYPE, 2018–2022 (USD MILLION)
                       TABLE 193 ROW: RETAIL DISTRIBUTION CHANNEL MARKET, BY SUBTYPE, 2023–2028 (USD MILLION)
             12.7.2 MIDDLE EAST
                       12.7.2.1 High demand for lactose-free and low-cholesterol products to boost growth
                                   TABLE 194 MIDDLE EAST: DAIRY ALTERNATIVES MARKET, BY SOURCE, 2018–2022 (USD MILLION)
                                   TABLE 195 MIDDLE EAST: DAIRY ALTERNATIVES MARKET, BY SOURCE, 2023–2028 (USD MILLION)
             12.7.3 AFRICA
                       12.7.3.1 Rise in urbanization and growth in retail chains to drive market demand
                                   TABLE 196 AFRICA: DAIRY ALTERNATIVES MARKET, BY SOURCE, 2018–2022 (USD MILLION)
                                   TABLE 197 AFRICA: DAIRY ALTERNATIVES MARKET, BY SOURCE, 2023–2028 (USD MILLION)
 
13 COMPETITIVE LANDSCAPE (Page No. - 205)
     13.1 OVERVIEW 
     13.2 MARKET SHARE ANALYSIS 
               TABLE 198 DAIRY ALTERNATIVES MARKET: DEGREE OF COMPETITION
     13.3 HISTORICAL REVENUE ANALYSIS OF KEY PLAYERS 
               FIGURE 64 HISTORICAL REVENUE ANALYSIS OF KEY PLAYERS, 2018–2022 (USD BILLION)
     13.4 ANNUAL REVENUE VS. GROWTH OF KEY PLAYERS 
               FIGURE 65 ANNUAL REVENUE, 2022 (USD BILLION) VS. REVENUE GROWTH, 2020–2022
     13.5 EBITDA OF KEY PLAYERS 
               FIGURE 66 EBITDA, 2022 (USD BILLION)
     13.6 STRATEGIES ADOPTED BY KEY PLAYERS 
               TABLE 199 STRATEGIES ADOPTED BY KEY PLAYERS
     13.7 COMPANY EVALUATION MATRIX FOR KEY PLAYERS 
             13.7.1 STARS
             13.7.2 EMERGING LEADERS
             13.7.3 PERVASIVE PLAYERS
             13.7.4 PARTICIPANTS
                       FIGURE 67 COMPANY EVALUATION MATRIX FOR KEY PLAYERS, 2022
             13.7.5 KEY COMPANY FOOTPRINT
                       TABLE 200 KEY COMPANY FOOTPRINT, BY FORMULATION
                       TABLE 201 KEY COMPANY FOOTPRINT, BY SOURCE
                       TABLE 202 KEY COMPANY FOOTPRINT, BY APPLICATION
                       TABLE 203 KEY COMPANY FOOTPRINT, BY REGION
                       TABLE 204 OVERALL KEY COMPANY FOOTPRINT
     13.8 COMPANY EVALUATION QUADRANT FOR STARTUPS/SMES 
             13.8.1 PROGRESSIVE COMPANIES
             13.8.2 STARTING BLOCKS
             13.8.3 RESPONSIVE COMPANIES
             13.8.4 DYNAMIC COMPANIES
                       FIGURE 68 COMPANY EVALUATION MATRIX FOR STARTUPS/SMES, 2022
             13.8.5 COMPETITIVE BENCHMARKING OF STARTUPS/SMES
                       TABLE 205 LIST OF KEY STARTUPS/SMES
                       TABLE 206 COMPETITIVE BENCHMARKING OF STARTUPS/SMES
     13.9 COMPETITIVE SCENARIO 
             13.9.1 PRODUCT LAUNCHES
                       TABLE 207 DAIRY ALTERNATIVES MARKET: PRODUCT LAUNCHES, 2020–2023
             13.9.2 DEALS
                       TABLE 208 DAIRY ALTERNATIVES MARKET: DEALS, 2021
             13.9.3 OTHERS
                       TABLE 209 DAIRY ALTERNATIVES MARKET: OTHERS, 2020–2023
 
14 COMPANY PROFILES (Page No. - 222)
(Business overview, Products offered, Recent developments & MnM View)*
     14.1 KEY PLAYERS 
             14.1.1 DANONE NORTH AMERICA PUBLIC BENEFIT CORPORATION
                       TABLE 210 DANONE NORTH AMERICA PUBLIC BENEFIT CORPORATION: BUSINESS OVERVIEW
                       FIGURE 69 DANONE NORTH AMERICA PUBLIC BENEFIT CORPORATION: COMPANY SNAPSHOT
                       TABLE 211 DANONE NORTH AMERICA PUBLIC BENEFIT CORPORATION: PRODUCTS OFFERED
                       TABLE 212 DANONE NORTH AMERICA PUBLIC BENEFIT CORPORATION: PRODUCT LAUNCHES
             14.1.2 THE HAIN CELESTIAL GROUP, INC.
                       TABLE 213 THE HAIN CELESTIAL GROUP, INC.: BUSINESS OVERVIEW
                       FIGURE 70 THE HAIN CELESTIAL GROUP, INC.: COMPANY SNAPSHOT
                       TABLE 214 THE HAIN CELESTIAL GROUP, INC.: PRODUCTS OFFERED
             14.1.3 BLUE DIAMOND GROWERS
                       TABLE 215 BLUE DIAMOND GROWERS: BUSINESS OVERVIEW
                       FIGURE 71 BLUE DIAMOND GROWERS: COMPANY SNAPSHOT
                       TABLE 216 BLUE DIAMOND GROWERS: PRODUCTS OFFERED
                       TABLE 217 BLUE DIAMOND GROWERS: PRODUCT LAUNCHES
             14.1.4 SUNOPTA
                       TABLE 218 SUNOPTA: BUSINESS OVERVIEW
                       FIGURE 72 SUNOPTA: COMPANY SNAPSHOT
                       TABLE 219 SUNOPTA: PRODUCTS OFFERED
                       TABLE 220 SUNOPTA: DEALS
                       TABLE 221 SUNOPTA: PRODUCT LAUNCHES
                       TABLE 222 SUNOPTA: OTHERS
             14.1.5 FREEDOM FOODS GROUP LIMITED
                       TABLE 223 FREEDOM FOODS GROUP LIMITED: BUSINESS OVERVIEW
                       FIGURE 73 FREEDOM FOODS GROUP LIMITED: COMPANY SNAPSHOT
                       TABLE 224 FREEDOM FOODS GROUP LIMITED: PRODUCTS OFFERED
             14.1.6 VALSOIA S.P.A.
                       TABLE 225 VALSOIA S.P.A: BUSINESS OVERVIEW
                       FIGURE 74 VALSOIA SPA: COMPANY SNAPSHOT
                       TABLE 226 VALSOIA S.P.A: PRODUCTS OFFERED
             14.1.7 OATLY GROUP AB
                       TABLE 227 OATLY GROUP AB: BUSINESS OVERVIEW
                       FIGURE 75 OATLY GROUP AB: COMPANY SNAPSHOT
                       TABLE 228 OATLY GROUP AB: PRODUCTS OFFERED
                       TABLE 229 OATLY GROUP AB: PRODUCT LAUNCHES
             14.1.8 SANITARIUM
                       TABLE 230 SANITARIUM: BUSINESS OVERVIEW
                       TABLE 231 SANITARIUM: PRODUCTS OFFERED
             14.1.9 EDEN FOODS, INC.
                       TABLE 232 EDEN FOODS, INC.: BUSINESS OVERVIEW
                       TABLE 233 EDEN FOODS, INC.: PRODUCTS OFFERED
             14.1.10 NUTRIOPS, S.L.
                       TABLE 234 NUTRIOPS, S.L.: BUSINESS OVERVIEW
                       TABLE 235 NUTRIOPS, S.L.: PRODUCTS OFFERED
             14.1.11 EARTH'S OWN
                       TABLE 236 EARTH'S OWN: BUSINESS OVERVIEW
                       TABLE 237 EARTH'S OWN: PRODUCTS OFFERED
             14.1.12 TRIBALLAT NOYAL
                       TABLE 238 TRIBALLAT NOYAL: BUSINESS OVERVIEW
                       TABLE 239 TRIBALLAT NOYAL: PRODUCTS OFFERED
             14.1.13 GREEN SPOT CO., LTD.
                       TABLE 240 GREEN SPOT CO., LTD.: BUSINESS OVERVIEW
                       TABLE 241 GREEN SPOT CO., LTD.: PRODUCTS OFFERED
             14.1.14 HILAND DAIRY
                       TABLE 242 HILAND DAIRY: BUSINESS OVERVIEW
                       TABLE 243 HILAND DAIRY: PRODUCTS OFFERED
             14.1.15 ELMHURST MILKED DIRECT LLC
                       TABLE 244 ELMHURST MILKED DIRECT LLC: BUSINESS OVERVIEW
                       TABLE 245 ELMHURST MILKED DIRECT LLC: PRODUCTS OFFERED
     14.2 STARTUPS/SMES 
             14.2.1 RIPPLE FOODS
                       TABLE 246 RIPPLE FOODS: BUSINESS OVERVIEW
                       TABLE 247 RIPPLE FOODS: PRODUCTS OFFERED
             14.2.2 KITE HILL
                       TABLE 248 KITE HILL: BUSINESS OVERVIEW
                       TABLE 249 KITE HILL: PRODUCTS OFFERED
                       TABLE 250 KITE HILL: PRODUCT LAUNCHES
             14.2.3 RUDE HEALTH
                       TABLE 251 RUDE HEALTH: BUSINESS OVERVIEW
                       TABLE 252 RUDE HEALTH: PRODUCTS OFFERED
             14.2.4 CALIFIA FARMS, LLC
                       TABLE 253 CALIFIA FARMS, LLC: BUSINESS OVERVIEW
                       TABLE 254 CALIFIA FARMS, LLC: PRODUCTS OFFERED
                       TABLE 255 CALIFIA FARMS, LLC: PRODUCT LAUNCHES
             14.2.5 PANOS BRANDS
                       TABLE 256 PANOS BRANDS: BUSINESS OVERVIEW
                       TABLE 257 PANOS BRANDS: PRODUCTS OFFERED
             14.2.6 PUREHARVEST
                       TABLE 258 PUREHARVEST: COMPANY OVERVIEW
             14.2.7 ONE GOOD
                       TABLE 259 ONE GOOD: COMPANY OVERVIEW
             14.2.8 VLY
                       TABLE 260 VLY: COMPANY OVERVIEW
             14.2.9 MIYOKO’S CREAMERY
                       TABLE 261 MIYOKO’S CREAMERY: COMPANY OVERVIEW
             14.2.10 DAIYA FOODS INC.
                       TABLE 262 DAIYA FOODS INC.: COMPANY OVERVIEW
*Details on Business overview, Products offered, Recent developments & MnM View might not be captured in case of unlisted companies.
 
15 ADJACENT AND RELATED MARKETS (Page No. - 273)
     15.1 INTRODUCTION 
               TABLE 263 MARKETS ADJACENT TO DAIRY ALTERNATIVES MARKET
     15.2 RESEARCH LIMITATIONS 
     15.3 PLANT-BASED PROTEIN MARKET 
             15.3.1 MARKET DEFINITION
             15.3.2 MARKET OVERVIEW
             15.3.3 PLANT-BASED PROTEIN MARKET, BY SOURCE
                       TABLE 264 PLANT-BASED PROTEIN MARKET, BY SOURCE, 2018–2021 (USD MILLION)
                       TABLE 265 PLANT-BASED PROTEIN MARKET, BY SOURCE, 2022–2027 (USD MILLION)
             15.3.4 PLANT-BASED PROTEIN MARKET, BY REGION
                       TABLE 266 PLANT-BASED PROTEIN MARKET, BY REGION, 2018–2021 (USD MILLION)
                       TABLE 267 PLANT-BASED PROTEIN MARKET, BY REGION, 2022–2027 (USD MILLION)
     15.4 ALMOND INGREDIENTS MARKET 
             15.4.1 MARKET DEFINITION
             15.4.2 MARKET OVERVIEW
             15.4.3 ALMOND INGREDIENTS MARKET, BY TYPE
                       TABLE 268 ALMOND INGREDIENTS MARKET, BY TYPE, 2018–2025 (KT)
             15.4.4 ALMOND INGREDIENTS MARKET, BY REGION
                       TABLE 269 ALMOND INGREDIENTS MARKET, BY REGION, 2018–2025 (KT)
                       TABLE 270 ALMOND INGREDIENTS MARKET, BY REGION, 2018–2025 (USD MILLION)
 
16 APPENDIX (Page No. - 279)
     16.1 KNOWLEDGESTORE: MARKETSANDMARKETS’ SUBSCRIPTION PORTAL 
     16.2 CUSTOMIZATION OPTIONS 
     16.3 RELATED REPORTS 
     16.4 AUTHOR DETAILS 

This research study involved the extensive use of secondary sources—directories and databases such as Bloomberg Businessweek and Factiva—to identify and collect information useful for a technical, market-oriented, and commercial study of the dairy alternatives market. In-depth interviews were conducted with various primary respondents—such as key industry participants, subject matter experts (SMEs), C-level executives of key market players, and industry consultants—to obtain and verify critical qualitative and quantitative information as well as to assess prospects.

Secondary Research

The secondary sources referred for this research study include government sources, the EU Commission, the European Food Safety Authority, the German Federal Institute of Risk Assessment, the Food Safety and Standards Authority of India (FSSAI), and the Japanese Ministry of Health, Labor and Welfare have referred to, to identify and collect information for this study. The secondary sources also included dairy alternatives annual reports, press releases & investor presentations of companies, white papers, food journals, certified publications, articles from recognized authors, gold & silver standard websites, regulatory bodies, trade directories, and paid databases.

Secondary research was used to obtain key information about the industry’s supply chain, the total pool of key players, and market classification and segmentation according to industry trends to the bottom-most level, regional markets, and key developments from both market and technology-oriented perspectives. The secondary data was collected and analyzed to arrive at the overall market size, which was further validated by primary research. It was also used to obtain information on the key developments from a market-oriented perspective.

Primary Research

The dairy alternatives market comprises multiple stakeholders, including raw material suppliers, processed food suppliers, and regulatory organizations in the supply chain. Various primary sources from the supply and demand sides of the market were interviewed to obtain qualitative and quantitative information. Primary interviewees from the supply side include research institutions involved in R&D to introduce to the manufacturers and importers & exporters of dairy alternatives products, from the demand side include distributors, wholesalers, and key opinion leaders through questionnaires, emails, and telephonic interviews.
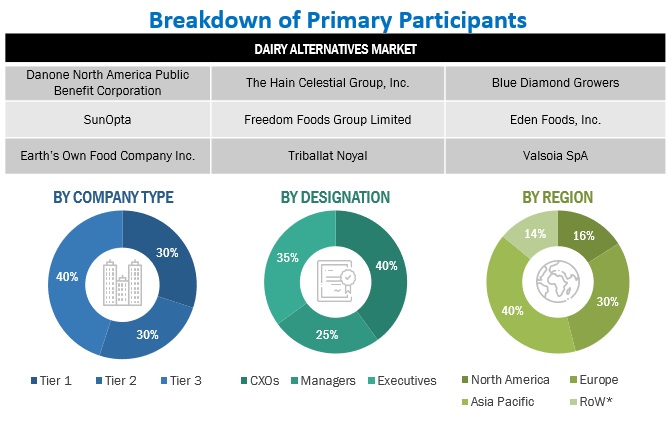
Dairy Alternatives Market Primary Research

To know about the assumptions considered for the study, download the pdf brochure

Market Size Estimation

  • Both top-down and bottom-up approaches were used to estimate and validate the total size of the dairy alternatives market. These approaches were also used extensively to estimate the size of various dependent submarkets. The research methodology used to estimate the market size includes the following:
  • Key players were identified through extensive secondary research.
  • The industry’s supply chain and market size were determined through primary and secondary research.
  • All percentage share splits and breakdowns were determined using secondary sources and verified through primary sources.
  • All the possible parameters that affect the markets covered in this research study were accounted for, viewed in extensive detail, verified through primary research, and analyzed to obtain the final quantitative and qualitative data.
  • The research includes the study of reports, reviews, and newsletters of top market players, along with extensive interviews for key opinions from industry experts (such as CEOs, vice presidents, directors, and marketing executives).

The following sections (bottom-up & top-down) (supply-demand) depict the overall market size estimation process employed for this study.

Dairy Alternatives Market Size Estimation (Bottom-up Approach)

Through the bottom-up approach, the data extracted from secondary research was utilized to validate the market segment sizes obtained. The approach was employed to arrive at the overall size of the dairy alternatives market in particular regions, and its share in the market was validated through primary interviews conducted with product manufacturers, suppliers, dealers, and distributors.

With the data triangulation procedure and validation of data through primaries, the overall size of the parent market and each segmental market were determined.
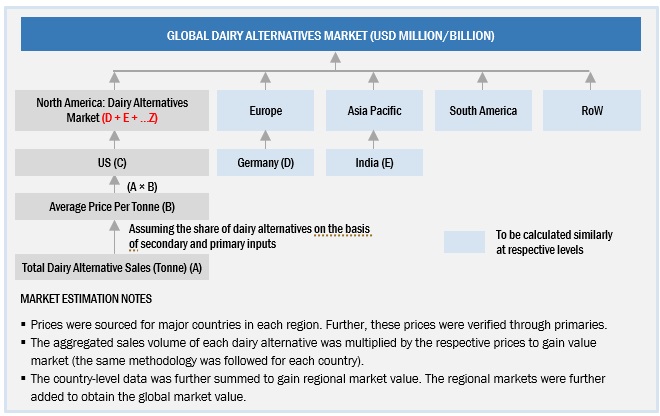
Dairy Alternatives Market Bottom-up Approach

To know about the assumptions considered for the study, Request for Free Sample Report

dairy alternatives market size estimation (Top-down approach

For the estimation of the dairy alternatives market, the size of the most appropriate immediate parent market was considered to implement the top-down approach. For the dairy alternatives market, the plant-based food market was considered as the parent market to arrive at the market size, which was again used to estimate the size of individual markets (mentioned in the market segmentation) through percentage shares arrived from secondary and primary research.
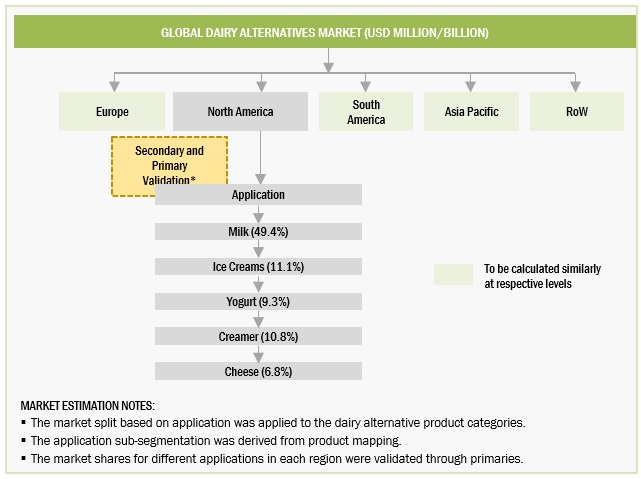
Dairy Alternatives Market Top-down Approach

Data Triangulation

After arriving at the overall market size from the estimation process explained above, the total market was split into several segments and subsegments. To estimate the overall dairy alternatives market and arrive at the exact statistics for all segments and subsegments, data triangulation and market breakdown procedures were employed, wherever applicable. The data was triangulated by studying various factors and trends from the demand and supply sides. Along with this, the market size was validated using both the top-down and bottom-up approaches.

Market Definition

Dairy alternatives are food & beverage products that are like certain types of dairy-based products in terms of texture and flavor, as well as the nutritional benefits they offer. They are lactose-free and are used to replace dairy-based products. They are manufactured using cereals, such as oats, rice, wheat, barley, and nuts. The health benefits of dairy alternatives have resulted in their wide-scale adoption in numerous applications.

Key Stakeholders

  • Food & beverage manufacturers, suppliers, and processors
  • Research & development institutions
  • Traders & Retailers
  • Distributors, importers, and exporters
  • Regulatory bodies
    • Organizations such as the Food and Drug Administration (FDA), United States Department of Agriculture (USDA), European Food Safety Agency (EFSA), EUROPA, and Food Safety Australia and New Zealand (FSANZ)
    • Government agencies
  • Intermediary suppliers
  • Universities and industry bodies
  • End users

Report Objectives

Market Intelligence

  • Determining and projecting the size of the dairy alternatives market with respect to source, application, formulation, distribution channel, and region over a five-year period ranging from 2023 to 2028.
  • Identifying the attractive opportunities in the market by determining the largest and fastest-growing segments across the key regions and analyzing the demand-side factors based on the following:
    • Impact of macro- and microeconomic factors on the market
    • Shifts in demand patterns across different subsegments and regions

Competitive Intelligence

  • Identifying and profiling the key market players in the dairy alternatives market
  • Determining the market share of key players operating in the dairy alternatives market
  • Providing a comparative analysis of the market leaders on the basis of the following:
    • Product offerings
    • Business strategies
    • Strengths and weaknesses
    • Key financials
  • Understanding the competitive landscape and identifying the major growth strategies adopted by key players across the key regions
  • Providing insights on the trade scenario

Available Customizations:

MarketsandMarkets offers customizations according to client-specific scientific needs with the given market data.

The following customization options are available for the report:

Product Analysis

  • Product matrix, which gives a detailed comparison of the product portfolio of each company.

Geographic Analysis

  • Further breakdown of the rest of the Asia Pacific’s dairy alternatives market into South Korea, Taiwan, Singapore, Malaysia, and Indonesia.
  • Further breakdown of the rest of Europe's dairy alternatives market into Greece and Eastern European countries.
  • Further breakdown of the Rest of South America includes Chile, Peru, and Bolivia.

Company Information

  • Detailed analyses and profiling of additional market players (up to five)
Custom Market Research Services

We will customize the research for you, in case the report listed above does not meet with your exact requirements. Our custom research will comprehensively cover the business information you require to help you arrive at strategic and profitable business decisions.

Request Customization

Instant Answers with GPT - Ask Now!

Ask real questions. Get complete answers !
Report Code
FB 1142
Published ON
Oct, 2023
Choose License Type
BUY NOW
  • SHARE
X
Request Customization
Speak to Analyst
Speak to Analyst
OR FACE-TO-FACE MEETING
PERSONALIZE THIS RESEARCH
  • Triangulate with your Own Data
  • Get Data as per your Format and Definition
  • Gain a Deeper Dive on a Specific Application, Geography, Customer or Competitor
  • Any level of Personalization
REQUEST A FREE CUSTOMIZATION
LET US HELP YOU!
  • What are the Known and Unknown Adjacencies Impacting the Dairy Alternatives Market
  • What will your New Revenue Sources be?
  • Who will be your Top Customer; what will make them switch?
  • Defend your Market Share or Win Competitors
  • Get a Scorecard for Target Partners
CUSTOMIZED WORKSHOP REQUEST
  • Call Us
  • +1-888-600-6441 (Corporate office hours)
  • +1-888-600-6441 (US/Can toll free)
  • +44-800-368-9399 (UK office hours)
CONNECT WITH US
ABOUT TRUST ONLINE
©2024 MarketsandMarkets Research Private Ltd. All rights reserved
DMCA.com Protection Status Website Feedback