Diagnostic Imaging Services Market Size, Growth by Procedure (MRI, Ultrasound, CT, X-RAY, Nuclear Imaging, Mammography), Application (OB/Gyn, Pelvic/Abdomen, Cardiology, Oncology, Neurology), Technology, End User (Hospitals, Diagnostic Centers) & Region - Global Forecasts to 2027
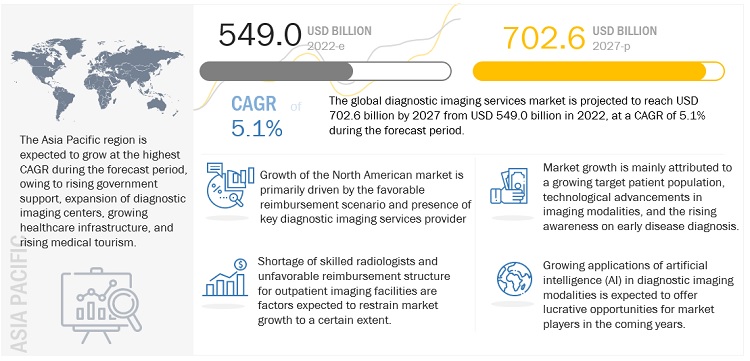
The global diagnostic imaging services market size is projected to reach USD 702.6 billion by 2027, at a CAGR of 5.1%. Major factors such as high chronic diseases coupled with growing geriatric patient population, increasing awareness about the different imaging procedures, rapid expansion of new imaging diagnostic centers with state-of-the art imaging technologies are playing major fuelling the diagnostic imaging services market growth during the forecast period.
However, increased cost associated with imaging technologies are likely to limit the adoption of diagnostic imaging modalities among lower income countries. Also , shortage of well- trained radiologist has led to an increase in the the overall trunaround time of imaging results, further creating a negative impact on the patient outcome. Such factors are expected to hinder the gowth of the market.
Global Opportunities in the Diagnostic Imaging Services Market

To know about the assumptions considered for the study, Request for Free Sample Report
Diagnostic Imaging Services Market Dynamics
Drivers: Rising geriatric population and subsequent increase in age-related diseases
The risk of developing diseases increases proportionately with age. According to the Centers for Disease Control and Prevention (CDC), nearly 80% of the elderly in the US suffer from at least one chronic condition. The American Medical Association (AMA) estimates that at least 60% of individuals aged 65 years and above will live with more than one chronic condition by 2030. Thus, an increase in
the senior population is expected to increase the demand for improved and advanced diagnostic treatment options and diagnostic imaging services. The increasing prevalence of various age-related disorders such as Alzheimer’s disease, Parkinson's disease, arthritis, and dementia is expected to fuel users' need for diagnostic imaging services, thereby contributing to market growth.
Restraints: High cost of diagnostic imaging equipment
Diagnostic imaging systems are priced at a premium and require high investments for installation. Healthcare facilities, especially outpatient imaging centers that purchase such costly systems, often depend on third-party payers to get reimbursements for the costs incurred in the diagnostic, screening, and therapeutic procedures performed using these systems. As a result, factors such as continuous cuts in reimbursements for diagnostic imaging scans and the increasing cost of diagnostic imaging systems are preventing small and medium-sized imaging facilities from investing in technologically advanced diagnostic imaging modalities, thereby hampering the growth of the services market.
Opportunities: Adoption of AI and blockchain
Artificial intelligence (AI) is one of the most promising breakthroughs in the field of medical imaging/diagnostic imaging. In the imaging field, obtaining the right image is the first step; however, confident analysis of data plays a vital role in disease diagnosis. In line with this, various service providers are now adopting artificial intelligence and deep learning to provide accurate diagnosis results and shorten the path for clinical decision-making and treatment planning. Similarly, blockchain also plays a vital role in the distribution and storage of medical images. This can aid in solving problems related to image storage and availability, patient health information security, and timely interpretation of medical imaging studies. Thus, implementing blockchain by imaging service providers will help increase data interpretation accuracy and speed.
Challenges: Shortage of skilled radiologists
A high degree of technical skill and expertise is required to handle advanced and sophisticated diagnostic imaging systems. However, the shortfall of skilled force has become one major challenges for countries across the globe. According to the annual census report released by the Royal College of Radiologists (RCR) in 2022, the UK is currently facing a shortage of around 1,699 radiologists, and the shortfall is anticipated to hit 36% by 2026, leading to an increase in shortage of 3166 radiology in the country.
The x-ray segment accounted for the largest share of the diagnostic imaging services market in 2021
Based on modality, the diagnostic imaging services market is segmented into magnetic resonance imaging (MRI), ultrasound, computed tomography (CT), X-ray, nuclear imaging, and mammography. In 2021, the x-ray segment accounted for the largest share of the diagnostic imaging services market. Factors such as rising prevalence of lung diseases, dental disorders, increasing cases of bone fractures have accelerated the adoption of X-ray imaging procedures. Moreover, rapid adoption of digital X-ray and ongoing technological advancemnets in X-ray imaging are anticipated to boost its adoption.
The neurology application segment dominated the of the MRI imaging services market in 2021.
Based on application, the MRI services market is segmented into neurology, orthopedics, cardiovascular, pelvic & abdomen, and oncology. The neurology segment accounted for the largest share of the MRI services market in 2021. Factors such ad rising geriatric population and increasing incidences of brain injuries and neurodegenerative disordes, such as Alzheimer's disease (AD) and Parkinson's disease (PD), globally are antivipated to drive the growth of the segment. According to the report published by Alzheimer's Association, in US an estimated 6.5 million people age 65 and older are living with Alzheimer’s dementia in 2022 and is expected to reach 12.7 million by 2050. Moreover, an increase in research activities in MRI Imaging field and approval of new MRI technique for diagnosis of brain disorders are likely to contribute towards the growth of the segment. In December 2021, ADM Diagnostics, Inc. received FDA approval to use CorInsights MRI to extract quantitative information about brain tissue volume to detect the Alzheimer's disease.
The hospitals segment commanded the largest share of the diagnostic imaging services market in 2021.
Based on end user, the diagnostic imaging services market is segmented into hospitals, diagnostic centers, ambulatory care centers, and research & academia. The hospitals segment held the largest share of the diagnostic imaging services market in 2021. This is attributed to the increased number of imaging procedures coupled with rising cases of cancer, arthritis and cardiovascular diseaases. Moreover, adopton of minimally invasive procedures by hopitals and strategic collbarations among imaging service providers and hospitals to enhance the diagnosric imaging procedures are are likely to contribute towards the growth of the segment. In October 2020, RadNet entered into partnership with CommonSpirit Health, 2nd largest non-profit hospital chain in US with an aim to expand its outpatient imaging centers in Arizona
The Asia Pacific market is expected to grow at the highest CAGR during the forecast period.
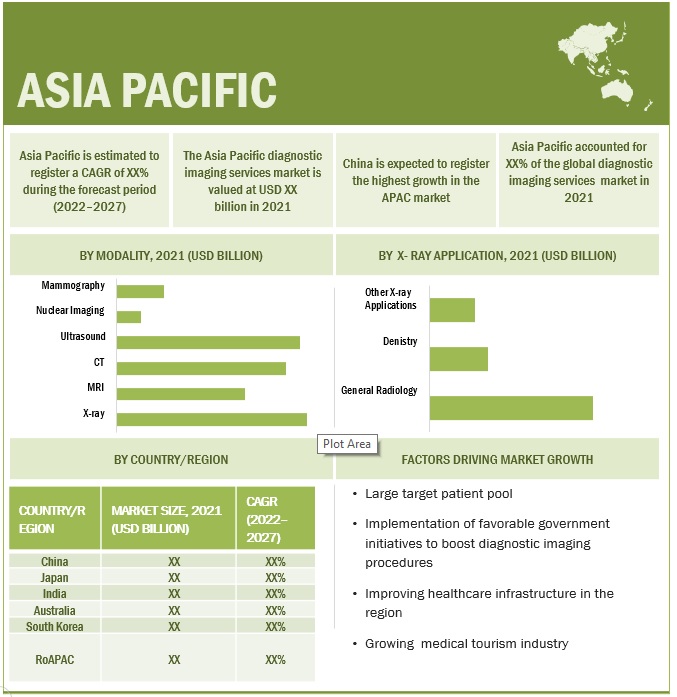
The diagnostic imaging services market is segmented into four major regions, namely, North America, Europe, the Asia Pacific, Latin America, and Middle East & Africa. In 2021, North America commanded the largest share of the global diagnostic imaging service market. However, the Asia Pacific market is estimated to grow at the highest CAGR during the forecast period owing to the increasing incidence of chronic disease, government iniatives to mordenize healthcare infrastructure, flourishing medical tourim and increase in imaging procedure volume.

To know about the assumptions considered for the study, download the pdf brochure
Diagnostic Imaging Services Market Key Players
Some of the prominent players in the diagnostic imaging services market include RadNet, Inc. (US), Sonic Healthcare (Australia), Akumin Inc. (US), Healius Limited (Australia), RAYUS Radiology (US), Dignity Health (US), Novant Health (US), Alliance Medical (UK), InHealth Group (UK), Apex Radiology (Australia), Concord Medical Services Holdings Limited (China), Unilabs (Switzerland), Affidea (Netherlands), I-MED Radiology Network (Australia), Capitol Imaging Services (US), SimonMed (US), among others.
An analysis of market developments between 2019 and 2022 revealed that several growth strategies such as partnerships & agreements, joint ventures, and strategic acquisitions were adopted by market players to strengthen their service portfolios and maintain a competitive position in the diagnostic imaging services market.
Scope of the Diagnostic Imaging Services Market Report
|
Report Metrics |
Details |
|
Market Size value 2027 |
USD 702.6 billion |
|
Growth Rate |
5.1% CAGR |
|
Largest Market |
Asia Pacific |
|
Market Dynamics |
Drivers, Opportunities, Restraints & Challenges |
|
Largest Share Segments |
X-ray, Neurology & Hospitals |
|
Forecasts up to |
2027 |
|
Market Segmentation |
Modality, Application, Technology, End User and Region |
|
Diagnostic Imaging Services Market Growth Drivers |
|
|
Diagnostic Imaging Services Market Growth Opportunities |
|
|
Geographies covered |
North America, Europe, APAC, MEA, and Latin America |
This research report categorizes the global diagnostic imaging services market by modality, application, technology, end user, and region.
By Modality
- X-ray
- Magnetic Resonance (MRI)
- Computed Tomography (CT)
- Ultrasound
- Nuclear Imaging
- Mammography
By Application
-
X-ray
- General Radiography
- Dentistry
- Other X-ray applications
-
Magnetic Resonance Imaging (MRI)
- Neurology
- Orthopedics
- Cardiovascular
- Pelvic & Abdomen
- Oncology
- Other MRI applications
-
Ultrasound
- Neurology
- Orthopedics
- Cardiovascular
- Obstetrics & Gynecology
- Oncology
- Other Ultrasound Applications
-
Computed Tomography (CT)
- Cardiovascular
- Oncology
- Neurology
- Other CT Applications
-
Nuclear Imaging
- Neurology
- Oncology
- Cardiovascular
- Other Nuclear Imaging Applications
- Mammography
By Technology
- 2D Imaging Technology
- 3D/4D Imaging Technology
By End User
- Hospitals
- Diagnostic Centers
- Ambulatory Care Centers
- Research and Academia
By Region
-
North America
- US
- Canada
-
Europe
- Germany
- UK
- France
- Spain
- Italy
- RoE
-
Asia Pacific
- China
- Japan
- India
- Australia
- South Korea
- RoAPAC
- Latin America
- The Middle East and Africa
Recent Developments:
- In 2022, Radnet, Inc. acquired Quantib and Aidence with an aim to expand its cancer screening portfolio for breast, prostate, and lung cancers through the integration of AI technology.
- In 2021 , Sonic Healthcare announced the acquisition of Canberra Imaging Group (Australia) to helped strengthen Sonic Healthcare’s geographic footprint in the Australian diagnostic imaging services market.
- In 2021, Akumin Inc. acquired Alliance Healthcare to enhance its diagnostic imaging service portfolio.
Frequently Asked Questions (FAQ):
What is the size of Diagnostic Imaging Services Market ?
The Diagnostic Imaging Services Market size is projected to reach USD 702.6 Billion by 2027, growing at a CAGR of 5.1%.
What are the major growth factors of Diagnostic Imaging Services Market ?
Factors such as rising cases of cancer, cardiovascular diseases, and other chronic diseases couples with ring geriatric patient population are fuleing the demand for early diagnosis of the diseases. Rapid technological advancements in diagnostic imaging and increase awareness about the different imaging modalities, and ongoing collaboration & partnership by diagnostic imaging services providers are expected to support the growth of market
Who all are the prominent players of Diagnostic Imaging Services Market ?
Prominent players in the diagnostic imaging services market include RadNet, Inc. (US), Sonic Healthcare (Australia), Akumin Inc. (US), Healius Limited (Australia), RAYUS Radiology (US), Dignity Health (US), Novant Health (US), Alliance Medical (UK), InHealth Group (UK), Apex Radiology (Australia), Concord Medical Services Holdings Limited (China), Unilabs (Switzerland), Affidea (Netherlands), I-MED Radiology Network (Australia), Capitol Imaging Services (US), SimonMed (US), among others.
To speak to our analyst for a discussion on the above findings, click Speak to Analyst

The study involved four major activities in estimating the current size of the diagnostic imaging services market. Exhaustive secondary research was done to collect information on the market and its different subsegments. The next step was to validate these findings, assumptions, and sizing with industry experts across the value chain through primary research. Both top-down and bottom-up approaches were employed to estimate the total market size. After that, market breakdown and data triangulation procedures were used to determine the size of the segments and subsegments.
Secondary Research
The secondary sources referred to in this research study include corporate filings (such as annual reports, SEC filings, investor presentations, and financial statements); research journals; and press releases; trade, business, and professional associations. Secondary sources were used to identify and collect useful information for this extensive and commercial study of the diagnostic imaging services market. Secondary research was mainly used to obtain key information about the industry’s total pool of key players, market classification and segmentation according to industry trends to the bottom-most level, market trends, and critical developments by both the public and private organizations in the diagnostic imaging services market.
The secondary sources referred to for this research study include government sources, independent or public sources, paid/private databases, and research databases, among others. Secondary data was collected and analyzed to arrive at the overall market size of the diagnostic imaging services market, which was further validated by primary research. Some of the key secondary sources referred to during the preparation of this report are listed below-
- Governmental and inter-governmental sources & databases such as World Health Organization (WHO), World Bank, Organisation for Economic Co-operation and Development (OECD), and Centers for Disease Control and Prevention (CDC), among others.
- Business and research articles such as Springer Nature, The Lancet, PubMed, and US National Library of Medicine, among others.
- Company sources involving annual reports, SEC filings, regulatory filings, investor presentations, press releases, and financial statements, among others.
Primary Research
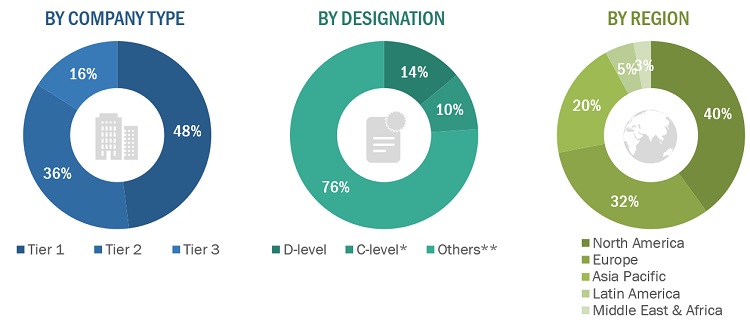
Extensive primary research was conducted after acquiring knowledge about the diagnostic imaging services market scenario through secondary research. A significant number of primary interviews were conducted from both the demand (healthcare providers, research institutes, physicians, and healthcare professionals) and supply sides (developers, manufacturers, and distributors of diagnostic imaging services). The primaries interviewed for this study include experts from the diagnostic imaging and medical imaging devices industry (such as CEOs, VPs, directors, sales heads, and marketing managers of tier 1, 2, and 3 companies engaged in offering diagnostic imaging solutions across the globe) and administrators & purchase managers of hospitals, general physicians, radiologists, neurologists, cardiologists, oncologists, ambulatory care centers, and healthcare service providers.
Around 65% and 35% of primary interviews were conducted from the supply and demand side, respectively. A robust primary research methodology has been adopted to validate the contents of the report and to fill gaps. Telephonic and e-mail communications were adopted to conduct interviews (questionnaires were designed and sent to primary participants as per their convenience).

* C-level includes CEOs, CFOs, COOs, and VPs.
** Others include sales managers, marketing managers, business development managers, product managers, distributors, and suppliers.
Note: Diagnostic imaging service providers are classified into tiers based on their total revenue as of 2018: Tier 1 = >USD 2 billion, Tier 2 = USD 50 million to USD 2 billion, and Tier 3 =
To know about the assumptions considered for the study, download the pdf brochure
Diagnostic Imaging Services Market Size Estimation
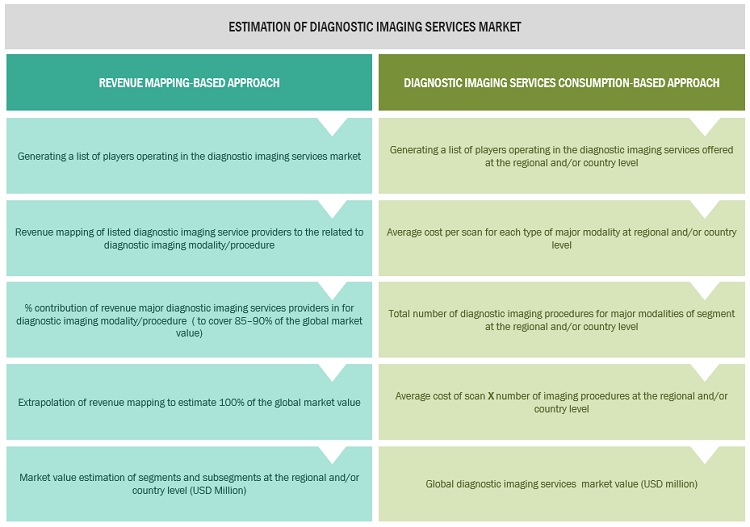
Both top-down and bottom-up approaches were used to estimate and validate the total size of the diagnostic imaging services market. These methods were also used extensively to estimate the size of various subsegments in the market. The research methodology used to estimate the market size includes the following:
- The key players in the industry and markets have been identified through extensive secondary research
- The industry’s supply chain and market size, in terms of value, have been determined through primary and secondary research
- All percentage shares, splits, and breakdowns have been determined using secondary sources and verified through primary sources
Market Size Estimation: Overall Diagnostic Imaging Services Market

To know about the assumptions considered for the study, Request for Free Sample Report
Data Triangulation
After arriving at the overall size of the global diagnostic imaging services market through the above-mentioned methodology, this market was split into several segments and subsegments. The data triangulation and market breakdown procedures were employed, wherever applicable, to complete the overall market engineering process and arrive at the exact market value data for the key segments and subsegments. The extrapolated market data was triangulated by studying various macro indicators and regional trends from both demand- and supply-side participants.
Report Objectives
- To define, describe, and forecast the global diagnostic imaging services market on the basis of product, modality, usage, disease indication, and region.
- To provide detailed information regarding the major factors influencing the market growth (such as drivers, restraints, opportunities, and challenges)
- To strategically analyze micromarkets with respect to individual growth trends, future prospects, and contributions to the overall market
- To analyze the opportunities in the market for key stakeholders and provide details of the competitive landscape for major market leaders
- To forecast the size of the market segments with respect to five main regions, namely, North America (the US and Canada), Europe (Germany, the UK, France, Italy, Spain, and Rest of Europe), Asia Pacific (Japan, China, India, Australia, South Korea, and Rest of Asia Pacific), Latin America (Brazil, Mexico, and Rest of Latin America), and the Middle East & Africa
- To profile the key market players and comprehensively analyze their market shares and core competencies
- To track and analyze competitive developments such as partnerships, agreements, collaborations, and expansions in the global diagnostic imaging services market
Available Customizations
With the given market data, MarketsandMarkets offers customizations as per the company’s specific needs. The following customization options are available for the present diagnostic imaging services market report:
Product Analysis
- Product matrix, which gives a detailed comparison of the product portfolios of the top five companies
Company Information
- Detailed analysis and profiling of additional market players (up to 5)


 Generating Response ...


Growth opportunities and latent adjacency in Diagnostic Imaging Services Market