The study involved four major activities in estimating the current size of the breast imaging market. Exhaustive secondary research was done to collect information on the market, peer, and parent markets. The next step was to validate these findings, assumptions, and sizing with industry experts across the value chain through primary research. Both top-down and bottom-up approaches were employed to estimate the complete market size. After that, market breakdown and data triangulation were used to estimate the market size of segments and subsegments.
Secondary Research
The secondary research process involves the widespread use of secondary sources, directories, databases (such as Bloomberg Businessweek, Factiva, and D&B Hoovers), white papers, annual reports, company house documents, investor presentations, and SEC filings of companies. Secondary research was used to identify and collect information useful for the extensive, technical, market-oriented, and commercial breast imaging market study. It was also used to obtain important information about the key players and market classification & segmentation according to industry trends to the bottom-most level, and key developments related to market and technology perspectives. A database of the key industry leaders was also prepared using secondary research.
Primary Research
In the primary research process, various supply and demand sources were interviewed to obtain qualitative and quantitative information for this report. The primary sources from the supply side include industry experts such as CEOs, vice presidents, marketing and sales directors, technology & innovation directors, and related key executives from various key companies and organizations in the breast imaging market. The primary sources from the demand side include medical OEMs, CDMOs, and service providers. Primary research was conducted to validate the market segmentation, identify key players, and gather insights on key industry trends & key market dynamics.
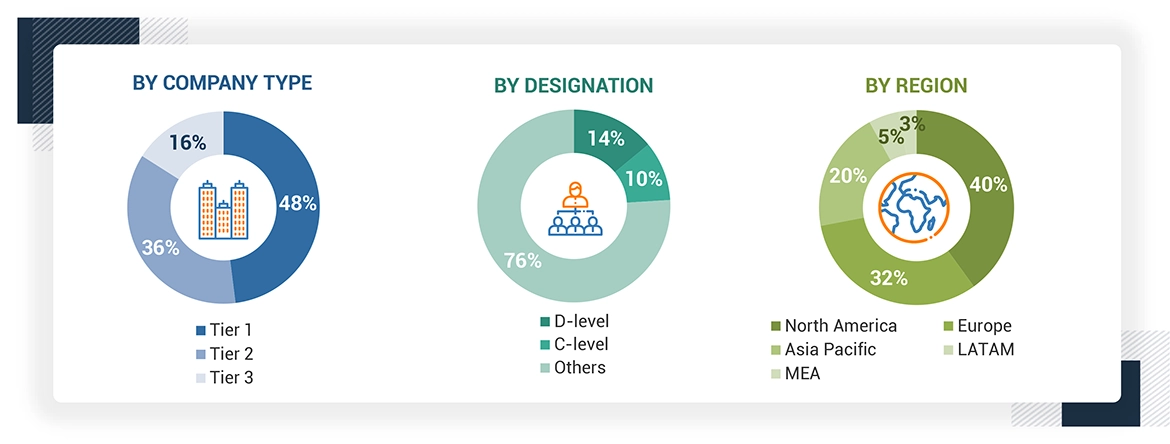
*Others include sales managers, marketing managers, business development managers, product managers, distributors, and suppliers.
Note: Companies are classified into tiers based on their total revenue. As of 2021, Tier 1 = >USD 1,000 million, Tier 2 = USD 500–1,000 million, and Tier 3 = USD 500 million.
About the assumptions considered for the study, To know download the pdf brochure
Market Size Estimation
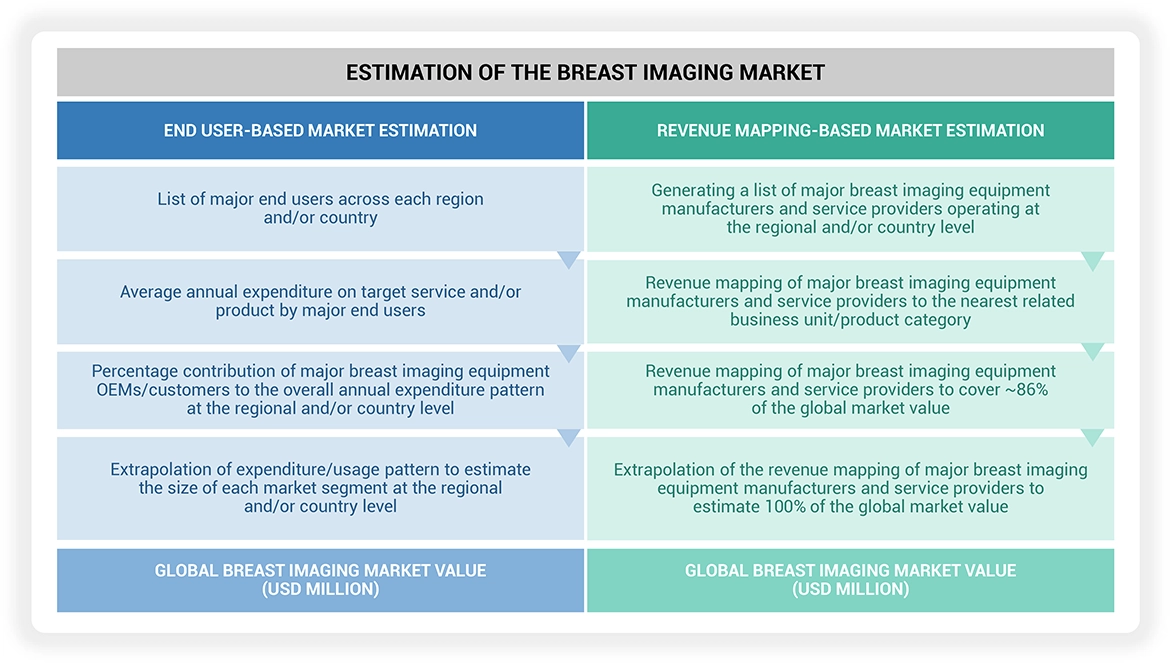
In this report, the breast imaging market’s size was determined using the revenue share analysis of leading players. For this purpose, key players in the market were identified, and their revenues from the market business were determined through various insights gathered during the primary and secondary research phases. Secondary research included the study of the annual and financial reports of the top market players. In contrast, primary research included extensive interviews with key opinion leaders, such as CEOs, directors, and key marketing executives.
Segmental revenues were calculated based on the revenue mapping of major solution/service providers to calculate the global market value. This process involved the following steps:
-
Generating a list of major global players operating in the breast imaging market.
-
Mapping annual revenues generated by major global players from the technology segment (or nearest reported business unit/product category)
-
Revenue mapping of major players to cover a major share of the global market share, as of 2021
-
Extrapolating the global value of the breast imaging market industry
Data Triangulation
After arriving at the overall market size from the market size estimation process explained above, the global breast imaging market was split into segments and subsegments. Data triangulation and market breakdown procedures were employed to complete the overall market engineering process and arrive at the exact statistics for all segments and subsegments. The data was triangulated by studying various factors and trends from both the demand and supply sides. Additionally, the breast imaging market was validated using top-down and bottom-up approaches.
Market Definition
Breast imaging plays a vital role in the early detection and screening of breast cancer. This market addresses the industry focusing on various technologies used for the detection, monitoring, and diagnosis of breast cancer-related complications. Technologies such as mammography, magnetic resonance imaging (MRI), ultrasound, molecular breast imaging (MBI), and positron emission tomography (PET) help healthcare professionals to visualize the internal structure of breasts and other surrounding tissues. Breast imaging equipment is primarily used in hospitals & clinics, diagnostic imaging centers, and breast care centers.
Key Stakeholders
-
Senior Management
-
End Users
-
R&D Department
-
Finance/Procurement Department
Report Objectives
-
To define, describe, and forecast the size of the breast imaging market based on technology, product, end user, and region
-
To provide detailed information regarding the major factors influencing the growth potential of the global breast imaging market (drivers, restraints, opportunities, challenges, and trends)
-
To analyze the micro markets with respect to individual growth trends, prospects, and contributions to the global breast imaging market.
-
To analyze key growth opportunities in the global breast imaging market for key stakeholders and provide details of the competitive landscape for market leaders
-
To forecast the size of market segments and/or subsegments with respect to five major regions, namely, North America (US and Canada), Europe (Germany, France, the UK, Italy, Spain, and the RoE), Asia Pacific (Japan, China, India, Australia, South Korea, and the RoAPAC), Latin America (Brazil, Mexico, and the RoLA), and the Middle East & Africa
-
To profile the key players in the breast imaging market and comprehensively analyze their market shares and core competencies
To track and analyze the competitive developments undertaken in the global breast imaging market, such as product launches; agreements; expansions; and mergers & acquisitions
Available Customizations
With the given market data, MarketsandMarkets offers customizations per the company’s specific needs. The following customization options are available for the present global breast imaging market report:
Product Analysis
-
Product matrix, which gives a detailed comparison of the product portfolios of the top five companies
Company Information
-
Detailed analysis and profiling of additional market players (up to five)


 HIGHEST CAGR MARKET IN 2024
 US FASTEST GROWING MARKET IN THE REGION


Growth opportunities and latent adjacency in Breast Imaging Market