
Digital Substation Market Size, Share & Trends

Digital Substation Market Size, Share, Growth & Trends by Transformers, Busbars, Circuit Breakers, Protection Relays, Switchgears, Interfacing Units, Fiber-optic Communication Networks, SCADA Systems, Transmission Substation and Distribution Substation - Global Forecast to 2030


DIGITAL SUBSTATION SYSTEM MARKET SIZE, SHARE & TRENDS
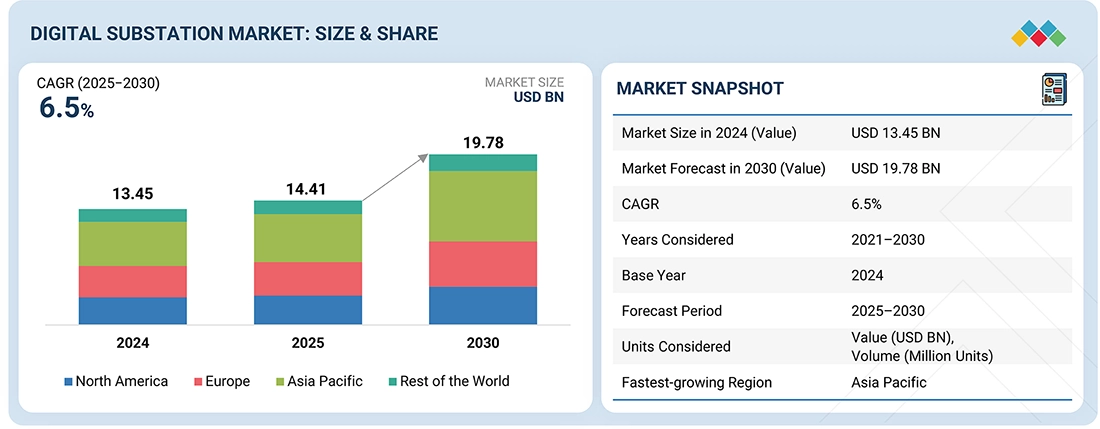
According to Marketsandmarkets, the global digital substation market size was valued at USD 14.41 billion in 2025 and is projected to reach USD 19.78 billion by 2030, growing at a CAGR of 6.5% from 2025 to 2030. Growth is driven by the rising demand for grid modernization, renewable energy integration, and improved substation automation to enhance efficiency, reliability, and real-time control in power transmission and distribution systems.
MARKET SNAPSHOT TABLE
| REPORT METRIC | DETAILS |
|---|---|
| Market Size in 2025 (Value) | USD 14.41 Billion |
| Market Forecast in 2030 (Value) | USD 19.78 Billion |
| Growth Rate | CAGR of 6.5% from 2025-2030 |
| Years Considered | 2021-2030 |
| Base Year | 2024 |
| Forecast Period | 2025-2030 |
| Units Considered | Value (USD Million/Billion), Volume (Million Units) |
| Report Coverage | Revenue forecast, company ranking, competitive landscape, growth factors, and trends |
| Segments Covered |
|
| Regions Covered | North America, Asia Pacific, Europe, South America, Middle East, Africa |
| Top Companies |
|
| Growth Drivers |
|
Market Size & Forecast
KEY TAKEAWAYS
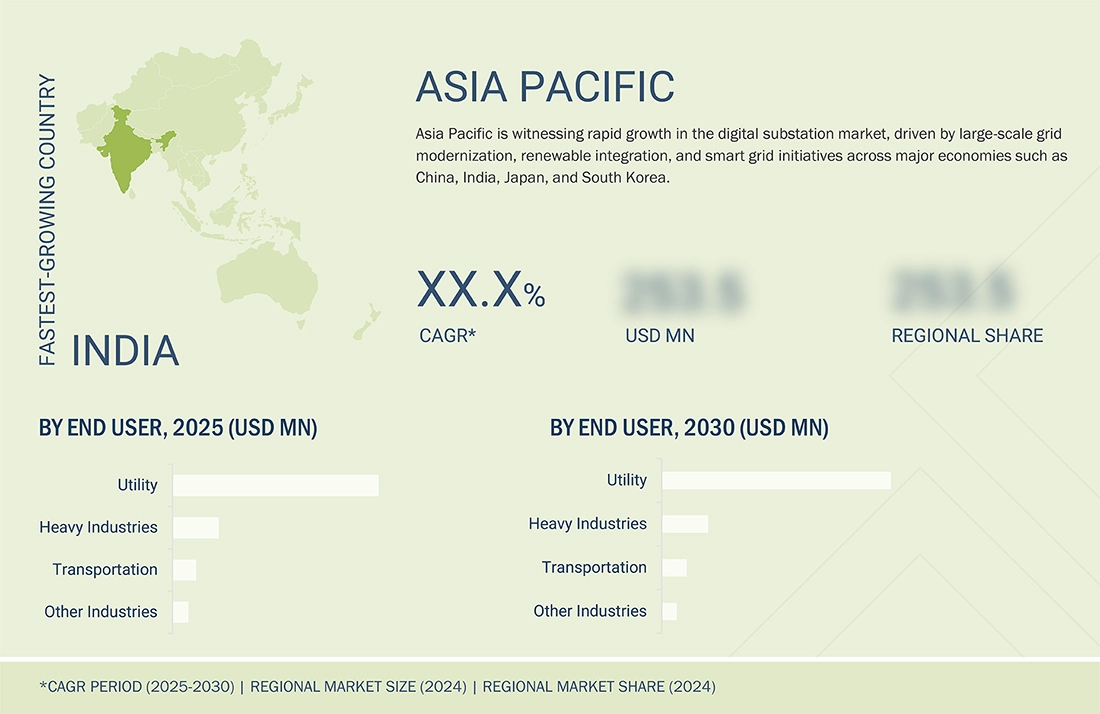
- By Region, Asia Pacific digital substation market accounted for 38.1% revenue share in 2024.
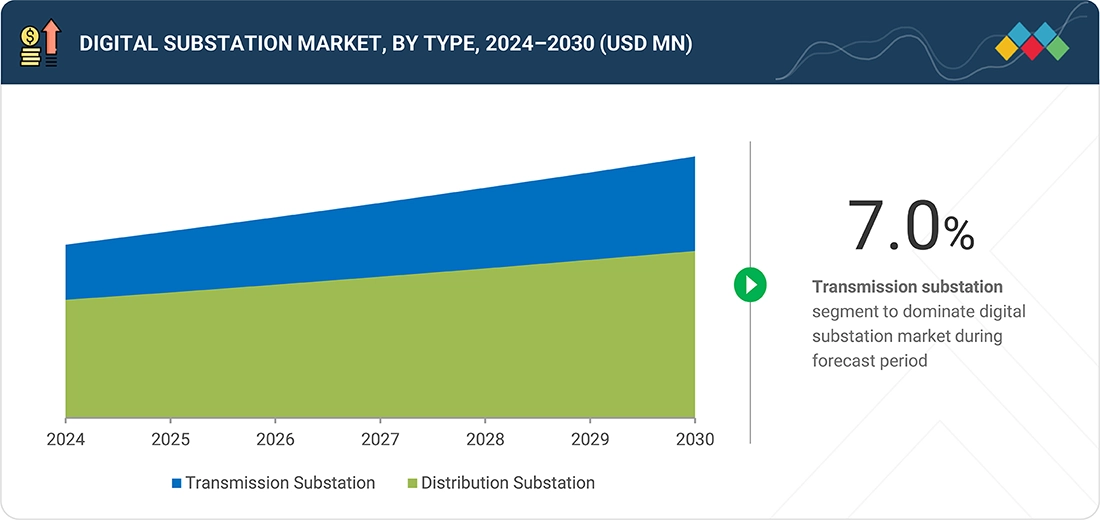
- By type, the transmission substation segment is expected to register 7.0% CAGR during the forecast period.
- By module, the hardware segment is expected to hold the largest market share.
- By industry, the utility segment is expected to witness the fastest growth in the digital substation market.
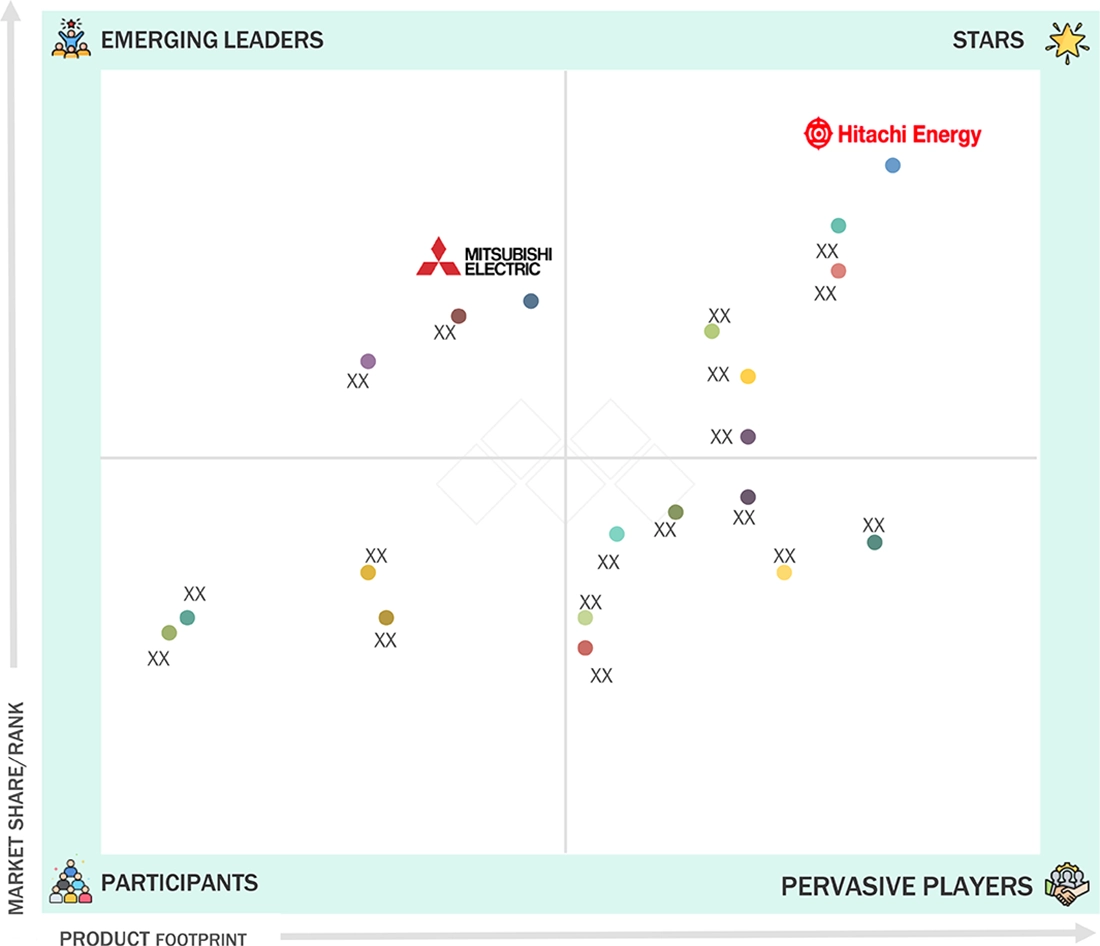
- Hitachi Ltd., Siemens Energy,and ABB were identified as some of the star players in the global digital substation market size, given their strong market share and product footprint.
- iGrid T&D, Welotec GmbH, and Netcontrol Group among others, have distinguished themselves among startups and SMEs by securing strong footholds in specialized niche areas, underscoring their potential as emerging market leaders
The digital substation industry is experiencing steady growth, driven by increased adoption of smart grid technologies, substation automation, and IEC 61850-based communication systems to improve grid reliability, operational efficiency, and real-time monitoring. New developments, including strategic partnerships between utilities and technology providers, investments in digital twin platforms, and advances in intelligent switchgear, protection relays, and cybersecurity solutions, are transforming the industry landscape.
Source: Secondary Research, Interviews with Experts, MarketsandMarkets Analysis
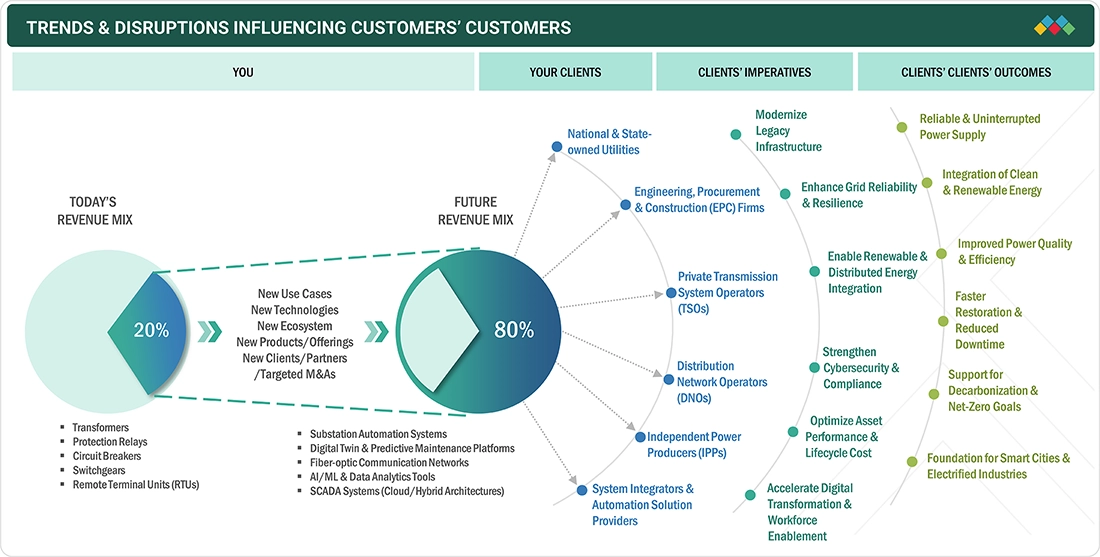
TRENDS & DISRUPTIONS IMPACTING CUSTOMERS' CUSTOMERS
The impact on consumers’ business in the digital substation market growth comes from the ongoing shift from traditional hardware-based systems to intelligent, data-driven, and interconnected substations. Utilities, transmission and distribution companies, and EPC firms are the main users, concentrating on grid modernization, renewable energy integration, and cybersecurity compliance. The reliance on transformers, relays, and switchgears is transforming into IEC 61850-based automation, digital twins, predictive maintenance, and AI-powered analytics. These innovations directly improve operational efficiency, asset reliability, and regulatory compliance, increasing demand for connected, resilient, and adaptable substation solutions. Consequently, end users experience better power quality, less downtime, and greater energy efficiency, supporting broader goals of smart grid development and decarbonization.
Source: Secondary Research, Interviews with Experts, MarketsandMarkets Analysis
MARKET DYNAMICS
Level
-
Growing push for grid modernization

-
Rising renewable energy integration

Level
-
High initial investment cost

-
Integration complexities

Level
-
Expansion in emerging markets

-
Integration of AI & advanced analytics

Level
-
Skilled workforce shortage

-
Data management and privacy issues

Source: Secondary Research, Interviews with Experts, MarketsandMarkets Analysis
Driver: Growing push for grid modernization
The modernization of aging power infrastructure is a major factor driving the digital substation market growth. Utilities worldwide are replacing analog systems with digital substations that include IEDs, SCADA, and fiber-optic networks to enhance reliability, automation, and real-time monitoring. This shift supports renewable energy integration, predictive maintenance, and grid resilience in response to increasing electricity demand and decarbonization goals.
Restraint: High initial investment cost
The deployment of digital substations requires substantial upfront capital investment in intelligent electronic devices (IEDs), communication networks, automation systems, and integration software. These expenses can be challenging for utilities with limited budgets or operating in developing regions, where modernization funding is constrained. Despite long-term benefits like improved reliability and lower maintenance costs, high initial expenditures remain a key restraint. Utilities often adopt phased upgrades or partnerships to manage costs, yet financial barriers continue to slow the widespread adoption of digital substation technologies.
Opportunity: Expansion in emerging markets
Emerging economies across Asia, Africa, and Latin America offer significant opportunities for digital substations amid rapid industrialization, urbanization, and renewable energy expansion. Nations such as India, Brazil, Indonesia, and Saudi Arabia are prioritizing smart grid and automation projects to strengthen power infrastructure. Global players like GE Vernova and Hitachi Energy are leveraging these markets through strategic investments, partnerships, and localized manufacturing.
Challenge: Skilled workforce shortage
The deployment of digital substations requires specialized expertise in IEC 61850 protocols, SCADA, IoT-based monitoring, and cybersecurity. Many utilities, especially in emerging markets, face challenges recruiting qualified engineers and technicians, causing project delays, higher costs, and dependence on external consultants. Despite growing investments in training and partnerships with technical institutes, the shortage of skilled professionals remains a major challenge to widespread adoption.
Digital Substation Market Share: COMMERCIAL USE CASES ACROSS INDUSTRIES
| COMPANY | USE CASE DESCRIPTION | BENEFITS |
|---|---|---|
 |
Deployed IEC 61850-based digital substations with optical current transformers and digital relays across urban networks | Enhances grid reliability, streamlines maintenance, and enables integration of renewable energy sources |
 |
Implemented digital twin and predictive monitoring platforms in transmission substations for real-time condition assessment | Enables predictive maintenance, minimizes unplanned outages, and improves operational efficiency |
 |
Rolled out digital substations integrated with optical sensors and process bus communication to replace legacy analog systems | Improves data accuracy and fault isolation speed, strengthens cybersecurity, and lowers lifecycle cost |
 |
Adopted fully digital substation architecture with IEC 61850 process bus and fiber-based communication for renewable grid expansion | Enhances interoperability, supports remote operation in harsh environments, and accelerates renewable energy integration |
 |
Implemented substation automation and digital protection devices across transmission infrastructure as part of grid modernization | Increases reliability, enables real-time monitoring and control, and reduces maintenance overheads |
Logos and trademarks shown above are the property of their respective owners. Their use here is for informational and illustrative purposes only.
MARKET ECOSYSTEM
The digital substation market trends ecosystem includes manufacturers (ABB, Siemens, GE Vernova, Schneider Electric, Hitachi Energy), system integrators (L&T Construction, Emerson, NR Electric), technology and software providers (Cisco Systems, Honeywell, Bentley, SEL), and end users (National Grid, Duke Energy, State Grid Corporation of China). Manufacturers provide advanced automation and protection equipment, while integrators deliver customized digital solutions. Technology providers support secure communication and monitoring platforms. End users fuel demand for reliable, intelligent, and efficient grid modernization. Collaboration across the entire value chain is crucial for innovation and market growth.
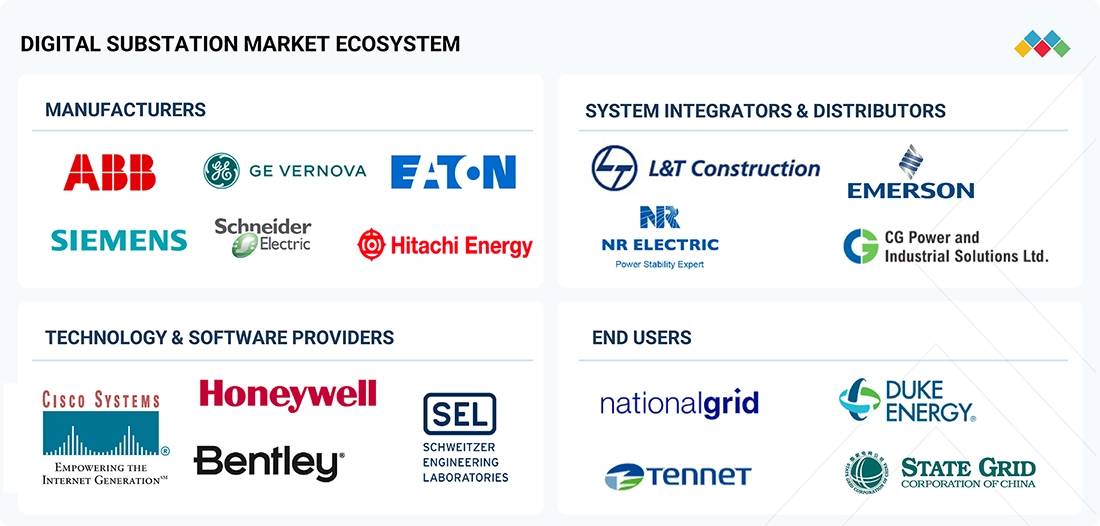
Logos and trademarks shown above are the property of their respective owners. Their use here is for informational and illustrative purposes only.
MARKET SEGMENTS
Source: Secondary Research, Interviews with Experts, MarketsandMarkets Analysis
Digital Substation Market, By Module
As of 2024, hardware held the largest share of the digital substation market and will continue to dominate through 2025, driven by the widespread deployment of transformers, circuit breakers, protection relays, and switchgears. These components form the physical foundation of substation automation, ensuring reliable power distribution and fault protection. The ongoing replacement of aging analog assets with intelligent electronic devices (IEDs) and advanced monitoring systems reinforces hardware’s leading role in digital substations.
Digital Substation Market, By Type
As of 2024, the transmission substation segment accounted for the largest share of the digital substation market and is projected to maintain its lead through 2025. The growing demand for high-voltage power transmission, grid stability, and integration of large-scale renewables has accelerated investments in transmission automation. Utilities are increasingly adopting digital substations to improve reliability, enable remote monitoring, and reduce operational downtime in long-distance power transmission networks.
Digital Substation Market, By Installation Type
In 2024, new installations represented the largest share of the digital substation market, driven by expanding grid infrastructure projects and renewable energy integration. Emerging economies, particularly in Asia and the Middle East, are investing in next-generation substations to support industrialization and smart city programs. The lower cost of deploying digital-ready infrastructure, compared to retrofitting legacy systems, continues to favor new installations across both transmission and distribution networks.
Digital Substation Market, By Architecture Type
As of 2024, the AIS (air-insulated substations) segment dominated the digital substation market and is expected to retain its leading position through 2025. Their cost-effectiveness, ease of maintenance, and suitability for outdoor installations make them a preferred choice, particularly in regions with ample space. Continuous upgrades in AIS systems with digital sensors, remote control interfaces, and condition monitoring tools are further driving their adoption over GIS and hybrid architectures.
Digital Substation Market, By Voltage
In 2024, substations rated up to 220 kV held the largest share of the digital substation market, primarily due to their extensive use in distribution and urban grid modernization projects. These substations are vital for integrating renewable generation and ensuring reliable power supply in medium-voltage networks. Ongoing upgrades in regional and municipal grids to incorporate automation and predictive maintenance are fueling steady demand in this segment.
Digital Substation Market, By Industry
As of 2024, the utility sector accounted for the largest share of the digital substation market and will continue leading through 2025. Utilities worldwide are prioritizing digital transformation to enhance grid reliability, integrate distributed energy resources, and ensure cybersecurity compliance. Investments in SCADA, IEDs, and fiber-optic communication systems by major utilities such as State Grid Corporation of China and National Grid are reinforcing the segment’s dominance.
REGION
Asia Pacific to be fastest-growing region in global digital substation market share during forecast period
The Asia Pacific digital substation market is expected to register the highest CAGR during the forecast period, driven by rapid industrialization, urbanization, and major investments in grid modernization across countries such as China, India, Japan, and South Korea. Governments and utilities are adopting digital substations with IEC 61850-based automation, real-time monitoring, and advanced protection systems to enhance reliability. Rising renewable energy integration, smart city development, and transmission expansion projects further accelerate market growth across the region.
Digital Substation Market: COMPANY EVALUATION MATRIX
In the digital substation market matrix, Hitachi Energy (Star) leads with a strong market share and comprehensive portfolio across digital automation, protection, and communication systems. Its IEC 61850-based solutions, strong global presence, and continuous innovation in digital twin and predictive maintenance technologies position it as a dominant force in grid modernization. Mitsubishi Electric (Emerging Leader) is steadily strengthening its presence with advanced control systems, smart grid integration solutions, and regional collaborations, signaling strong potential to move toward the leaders’ quadrant.
Source: Secondary Research, Interviews with Experts, MarketsandMarkets Analysis
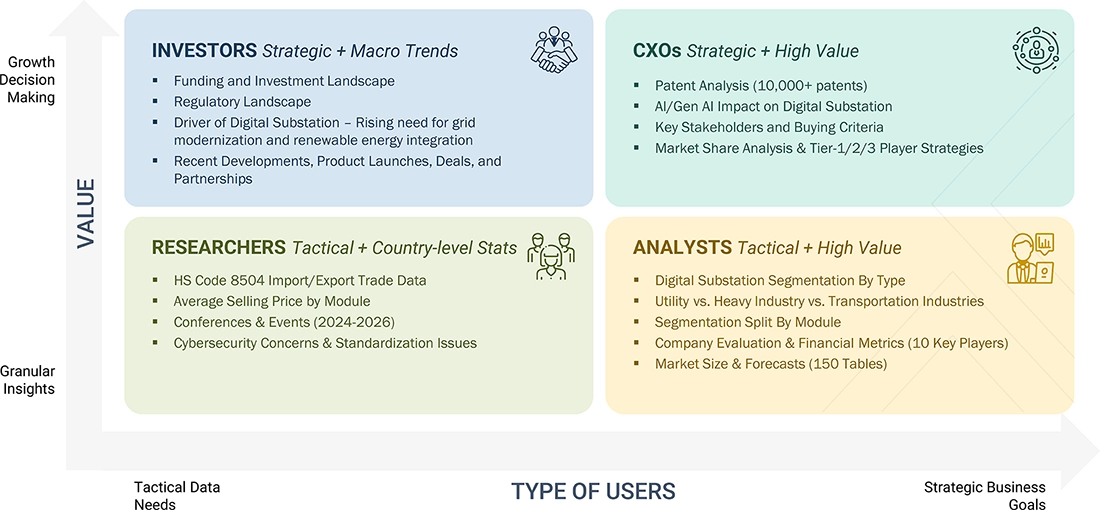
WHAT IS IN IT FOR YOU: Digital Substation Market REPORT CONTENT GUIDE
DELIVERED CUSTOMIZATIONS
We have successfully delivered the following deep-dive customizations:
| CLIENT REQUEST | CUSTOMIZATION DELIVERED | VALUE ADDS |
|---|---|---|
| Transmission Utility |
|
|
| Investment Firm/Private Equity |
|
|
| Cybersecurity Solution Provider |
|
|
| Government/Regulatory Authority |
|
|
| Technology Startup/Digital Twin Developer |
|
|
RECENT DEVELOPMENTS
- August 2024 : Hitachi Energy launched SF6-free circuit breakers, providing high-performance switching and protection for substations while minimizing greenhouse gas emissions, enhancing sustainability, operational safety, and reliability for transmission and distribution networks
- February 2024 : GE Vernova introduced GridBeats Integrated Digital Substation, a hardware-inclusive automation platform that uses software-defined merging units and protection relays to streamline substation operations. It enables real-time data conversion, reduces copper cabling requirements by up to 80%, and strengthens grid resilience through top-down engineering and wide-area monitoring designed for high-voltage environments.
- January 2024 : Hitachi Energy introduced the upgraded SAM600 3.0 process interface unit, designed to accelerate digital substation adoption by integrating multiple functions into one device. It significantly reduces wiring complexity by as much as 90%, and enhances operational flexibility, reliability, and sustainability for grid operators, while fully aligning with the latest IEC 61850 standards and cybersecurity requirements.
- COLUMN 'A' SHOULD BE IN TEXT FORMAT AND NOT DATE FORMAT :
Table of Contents
 Exclusive indicates content/data unique to MarketsandMarkets and not available with any competitors.
Methodology
The research study involved four main activities in estimating the size of the digital substation market. Extensive secondary research was conducted to gather key information about the market and related markets. The accuracy of these findings, assumptions, and sizing was then validated through primary research with industry experts across the value chain. Both top-down and bottom-up approaches were used to estimate the market size. Market breakdown and data triangulation were applied to determine the sizes of segments and sub-segments.
Secondary Research
In the secondary research process, various sources were used to identify and gather the information needed for this study. The secondary sources include annual reports, press releases, investor presentations of companies, white papers, and articles from reputable authors. The secondary research primarily aimed to gather key details about the market’s value chain, the main market players, market segmentation based on industry trends, regional outlook, and developments from both market and technology perspectives.
In the digital substation market report, the global market size has been estimated using both the top-down and bottom-up methods, along with several other related submarkets. The major players in the market were identified through extensive secondary research, and their presence was confirmed through both secondary and primary research. All percentage shares, splits, and breakdowns were determined using secondary sources and verified through primary sources.
Primary Research
Extensive primary research was carried out after analyzing the digital substation market scenario through secondary research. Several primary interviews were conducted with key opinion leaders from both demand- and supply-side vendors across four major regions—North America, Europe, Asia Pacific, and the Rest of the World. About 25% of the primary interviews involved demand-side vendors, while 75% involved supply-side vendors. The primary data was mainly collected through telephonic interviews, accounting for 80% of all primary interviews; questionnaires and emails were also used to gather data.
After successful engagement with industry experts, brief sessions were held with highly experienced independent consultants to reinforce the findings of our primary research. This, combined with the opinions of in-house subject matter experts, led to the conclusions outlined in the report.

Note: “Others” includes sales, marketing, and product managers
To know about the assumptions considered for the study, download the pdf brochure
Market Size Estimation
In the market engineering process, both, the top-down and bottom-up approaches, along with data triangulation methods, were used to estimate and validate the size of the digital substation market and other related submarkets. The research methodology employed to estimate the market sizes includes the following:
- Identifying top-line investments and spending in the ecosystem and considering segment-level splits and significant market developments
- Identifying different stakeholders in the digital substation market that influence the entire market, along with participants across the supply chain
- Analyzing major manufacturers in the digital substation market and studying their product portfolio
- Analyzing trends related to the adoption of digital substation modules
- Tracking recent and upcoming market developments, including investments, R&D activities, product launches, expansions, acquisitions, partnerships, collaborations, agreements, and investments, as well as forecasting the market size based on these developments and other critical parameters
- Carrying out multiple discussions with key opinion leaders to identify the adoption trends of silicon carbide (SiC)
- Segmenting the overall market into various other market segments
- Validating the estimates at every level through discussions with key opinion leaders, such as chief executives (CXOs), directors, and operations managers, and finally with the domain experts at MarketsandMarkets
Digital Substation Market : Top-Down and Bottom-Up Approach

Data Triangulation
After arriving at the overall market size by the market size estimation process explained in the earlier section, the overall digital substation market has been divided into several segments and subsegments. To complete the overall market engineering process and arrive at the exact statistics for all segments, the data triangulation and market breakdown procedures have been used, wherever applicable. The data has been triangulated by studying various factors and trends from both the demand and supply sides. Along with data triangulation and market breakdown, the market has been validated by top-down and bottom-up approaches.
Market Definition
A digital substation combines traditional substation functions with advanced digital communication, automation, and control technologies to improve grid reliability, flexibility, and efficiency. It replaces conventional copper wiring and analog instruments with fiber-optic communication, intelligent electronic devices (IEDs), sensors, and process bus architectures that follow IEC 61850 standards. These systems support real-time data collection, predictive maintenance, and remote monitoring, resulting in better operational visibility and faster fault detection across transmission and distribution networks. Digital substations are essential in modernizing power infrastructure, integrating renewable energy sources, and advancing smart grid development.
The digital substation market is broadly divided by module, type, installation type, architecture, voltage, and industry. The module category includes hardware (transformers, switchgears, protection devices, interfacing units, and communication systems), fiber-optic communication networks, and SCADA systems, all of which work together to ensure efficient monitoring, control, and automation of power systems. The market is also segmented by type into transmission and distribution substations, serving different voltage and capacity levels. Regarding installation type, digital substations are classified as either new installations or retrofits, supporting both greenfield and modernization projects. In terms of architecture, they are divided into air-insulated (AIS), gas-insulated (GIS), and hybrid substations, each designed for specific spatial and environmental conditions.
By voltage, digital substations are categorized into up to 220 kV, 220–550 kV, and above 550 kV, addressing diverse transmission needs. Industry-wise, the market includes utilities (renewable and non-renewable), heavy industries (steel, cement, chemicals), transportation (railways and metro), and others (data centers and commercial infrastructure). The increasing integration of renewable energy, expansion of grid automation, and adoption of IoT and AI-based monitoring platforms are propelling the rapid evolution of the digital substation ecosystem, making it a key element of next-generation power systems.
Key Stakeholders
- Primary equipment manufacturers (transformers, switchgear, circuit breakers, etc.)
- Intelligent electronic device (IED) manufacturers
- Supervisory control and data acquisition (SCADA) solution providers
- Communication network providers
- Engineering, procurement & construction (EPC) firms/system integrators
- Power utility companies
- Turnkey contractors
- Distributors and traders
- Research organizations
- Regulatory bodies & government energy agencies
- Forums, alliances, and associations
Report Objectives
- To define, analyze, and forecast the digital substation market size by module, type, installation type, voltage, architecture type, industry, and region, in terms of value
- To define, analyze, and forecast the digital substation market size, by hardware type, in terms of volume
- To forecast the market size for various segments with respect to four main regions, namely, North America, Europe, Asia Pacific, and RoW
- To provide detailed information regarding the major drivers, restraints, opportunities, and challenges influencing the growth of the market
- To study the complete supply chain and related industry segments for the market
- To strategically study the micromarkets with respect to individual growth trends, prospects, and contributions to the total market
- To analyze the supply chain, market ecosystem, trends/disruptions impacting customer’s business, technology analysis, pricing analysis, Porter’s five forces model, key stakeholders & buying criteria, case study analysis, trade analysis, patent analysis, key conferences & events, 2025–2026; regulations related to the digital substation market; and investment and funding scenario
- To understand opportunities in the market for various stakeholders by identifying the high-growth segments of the market
- To strategically profile the key players and comprehensively analyze their market position in terms of ranking, core competencies, company valuation & financial metrics, and product/brand comparison, along with detailing the competitive landscape for the market leaders
- To analyze competitive developments such as product launches, agreements, partnerships, collaborations, contracts, acquisitions, expansions, and research and development (R&D) activities carried out by players in the market
Customization Options
With the given market data, MarketsandMarkets offers customizations according to the specific requirements of companies. The following customization options are available for the report:
Country-wise Information:
- Country-wise breakdown for North America, Europe, Asia Pacific, and Rest of the World
Company Information:
- Detailed analysis and profiling of additional market players (up to five)
Key Questions Addressed by the Report
What is the current size of the global Digital Substation Market?
The global Digital Substation Market is valued at USD 14.41 billion in 2025. (MarketsandMarkets)
What is the projected market size of the Digital Substation Market by 2030?
The market is projected to reach USD 19.78 billion by 2030. (MarketsandMarkets)
What is the expected CAGR of the Digital Substation Market?
The Digital Substation Market is expected to grow at a CAGR of 6.5% during 2025–2030. (MarketsandMarkets)
What are the major growth drivers of the Digital Substation Market?
Key growth drivers include grid modernization initiatives, rising renewable energy integration, increasing demand for substation automation, real-time monitoring capabilities, and the adoption of smart grid technologies. (MarketsandMarkets)
What are the key trends shaping the Digital Substation industry?
Major trends include IEC 61850-based communication systems, digital twin technology, AI-powered analytics, predictive maintenance, intelligent electronic devices (IEDs), cybersecurity solutions, and advanced SCADA integration. (MarketsandMarkets)
Which segment is expected to grow the fastest in the Digital Substation Market?
The Transmission Substation segment is expected to register the fastest growth, with a projected CAGR of 7.0% during the forecast period. (MarketsandMarkets)
Which module segment holds the largest market share?
The Hardware segment holds the largest market share, driven by the deployment of transformers, circuit breakers, protection relays, switchgears, and intelligent monitoring equipment. (MarketsandMarkets)
Which region dominates the Digital Substation Market?
Asia Pacific is the leading region, accounting for approximately 38.1% of global revenue share in 2024, supported by investments in grid modernization and power infrastructure expansion. (MarketsandMarkets)
Which region is expected to witness the highest growth?
Asia Pacific is projected to be the fastest-growing regional market due to rapid industrialization, urbanization, renewable energy projects, and smart grid deployments across China, India, Japan, and South Korea. (MarketsandMarkets)
Who are the leading companies operating in the Digital Substation Market?
Major market participants include Hitachi Energy, Siemens Energy, GE Vernova, ABB Ltd., and Schneider Electric. (MarketsandMarkets)
Need a Tailored Report?
Customize this report to your needs
Get 10% FREE Customization
Customize This ReportPersonalize This Research
- Triangulate with your Own Data
- Get Data as per your Format and Definition
- Gain a Deeper Dive on a Specific Application, Geography, Customer or Competitor
- Any level of Personalization
Let Us Help You
- What are the Known and Unknown Adjacencies Impacting the Digital Substation Market
- What will your New Revenue Sources be?
- Who will be your Top Customer; what will make them switch?
- Defend your Market Share or Win Competitors
- Get a Scorecard for Target Partners

Custom Market Research Services
We Will Customise The Research For You, In Case The Report Listed Above Does Not Meet With Your Requirements
Get 10% Free CustomisationTESTIMONIALS

Tetsuya Ohhira
Business Development Manager-Technology Business
Nikon Corporation,
Leading Japanese MNC specializing in optics and imaging productswww.nikon.com
MarketsandMarkets™ response
is quick. Their attitude is flexible and positive. Analyst Insights are globally considered and
significant. Client Services quickly respond to our inquiry and demand. Their wide range of global
surveys help us make our strategic plan.
We hope Knowledge Store will be easier to search
for a report.
VP - Marketing & Business Development
Leading Provider of Process Control Solutions
We engaged with MarketsandMarkets on a study to perform an analysis and recommend a Go-To-Market strategy for metrology and process control in the semiconductor market. The study was tailored to our targets and needs with well-defined milestones. Our overall experience with the MarketsandMarkets team was very good throughout the project in all aspects including the analysis methodologies used, the quality and depth of primary and secondary data sets, the professionalism and flexibility of the team and the ability to meet the target schedule and milestones. We want to thank MarketsandMarkets team for a job well done.
Growth opportunities and latent adjacency in Digital Substation Market


Brenda
Apr, 2026
I appreciate the depth of vendor profiling it will help in strategic decision-making..
Jeffery
Apr, 2026
Is there a way to include a forecast of AI and IoT adoption within digital substation operations?.
Masataka
Apr, 2018
We would like to confirm how much in detail we could obtain the information related to Digital Substation by country. At least, we would like to obtain by-country data including Vietnam, India, Indonesia, Thailand, Malaysia, Singapore, Phillipins, and Australia. .
Reiko
Jan, 2018
We would like to obtain the data pretting to the penetaration of digital substation (hopefully by capacity: 500kV, 220kV, 110kV, and by type: SAS and SCADA). Market size of digital substation, trends, and growth perspectives - Governmental policies/regulations to accelarate the implementation of digital substations. .
Pankaj
Jan, 2019
I am currently working in the area of Transmission and Distribution. I wish to explore the opportunities provided by Digital Substation in future..