Substation Monitoring System Market by Component (Hardware & Software), Communication Technology (Wired & Wireless), Sector (Transmission & Distribution), Industry (Utility, Oil & Gas, Mining, Steel, and Transportation) and Geography - Global Forecast to 2036


Substation Monitoring System Market Summary
The global Substation Monitoring System Market was valued at approximately USD 4–6 billion in 2024 and is projected to reach USD 12–16 billion by 2036, expanding at a CAGR of 9%–11% during the forecast period. The market is witnessing significant growth due to the modernization of power infrastructure, increasing electricity demand, and the transition toward smart grids. Substation monitoring systems play a critical role in ensuring the reliability, efficiency, and safety of power transmission and distribution networks by enabling real-time monitoring and control of electrical assets.
The integration of Artificial Intelligence (AI), Internet of Things (IoT), and automation technologies is transforming traditional substations into intelligent, data-driven systems. AI-powered analytics are enabling predictive maintenance and fault detection, while IoT sensors facilitate real-time data acquisition and communication across grid networks. Automation and digital transformation initiatives are further enhancing operational efficiency and reducing downtime. The growing focus on grid resilience, renewable energy integration, and energy efficiency is expected to drive robust growth in the Substation Monitoring System Market through 2036.
Key Market Trends & Insights
The Substation Monitoring System Market is evolving rapidly with the increasing adoption of smart grid technologies. North America leads the market due to advanced grid infrastructure and early adoption of digital technologies. Asia Pacific is the fastest-growing region, driven by rapid urbanization, industrialization, and expansion of power networks. The hardware segment, including sensors and intelligent electronic devices (IEDs), dominates the market due to widespread deployment across substations. Emerging trends include the integration of AI and machine learning for predictive analytics and the adoption of cloud-based monitoring platforms. Automation is enabling remote monitoring and control, while IoT connectivity is enhancing data visibility and operational efficiency across power networks.
Market Size & Forecast
- Base Year Market Size (2024): USD 4–6 billion
- Forecast Value by 2036: USD 12–16 billion
- CAGR (2024–2036): 9%–11%
- Growth Factors: Increasing demand for reliable power supply, smart grid adoption, integration of renewable energy, and advancements in AI and IoT technologies
Substation Monitoring System Market Top 10 key takeaway
- Rising demand for smart grid infrastructure globally
- Increasing adoption of IoT-enabled monitoring systems
- Hardware segment dominating due to sensor deployment
- AI integration enabling predictive maintenance and fault detection
- Growth in renewable energy integration driving demand
- Asia Pacific emerging as the fastest-growing region
- Expansion of power transmission and distribution networks
- Cloud-based monitoring platforms gaining traction
- Automation enabling remote monitoring and control
- Growing focus on grid reliability and efficiency
Product Insights
The hardware segment holds the largest share in the Substation Monitoring System Market, primarily due to the extensive use of sensors, intelligent electronic devices (IEDs), and communication equipment in substations. These components are essential for collecting real-time data on parameters such as temperature, voltage, current, and equipment health. The increasing deployment of smart sensors and advanced monitoring devices is driving the growth of this segment.
Software solutions are also gaining prominence, offering advanced analytics, visualization tools, and remote monitoring capabilities. These platforms enable utilities to analyze large volumes of data and make informed decisions to optimize grid performance. The integration of AI into software solutions is enhancing predictive maintenance and fault detection capabilities.
Emerging product categories include integrated monitoring systems that combine hardware and software components into a unified platform. These systems provide centralized control and improved operational efficiency. The adoption of AI and machine learning technologies is further enhancing system capabilities, enabling real-time analytics and automated decision-making.
Technology / Component Insights
The Substation Monitoring System Market is driven by advanced technologies such as IoT, AI, cloud computing, and automation. IoT devices, including sensors and communication modules, form the backbone of modern monitoring systems, enabling real-time data collection and transmission. These devices provide critical insights into the performance and condition of substation equipment.
Artificial Intelligence is playing a transformative role by enabling predictive analytics, anomaly detection, and automated decision-making. AI algorithms analyze data from sensors to identify potential issues and optimize system performance, reducing downtime and maintenance costs.
Cloud computing provides the infrastructure for data storage and analysis, enabling utilities to monitor substations remotely and access real-time information. Automation technologies are enhancing system efficiency by enabling self-regulating systems that can respond to changes in real time. Future innovations are expected to focus on digital twin technology, advanced cybersecurity solutions, and integration with 5G networks for improved communication and reliability.
Application Insights
The transmission and distribution (T&D) segment is the leading application area in the Substation Monitoring System Market, driven by the need for reliable and efficient power delivery. Monitoring systems are essential for ensuring the stability and performance of power networks, particularly as electricity demand continues to rise.
Renewable energy integration is another key application area, where monitoring systems are used to manage the variability and intermittency of renewable power sources such as solar and wind. The increasing adoption of renewable energy is driving demand for advanced monitoring solutions.
Industrial and commercial applications also contribute to market growth, as organizations seek to ensure uninterrupted power supply and optimize energy usage. Future opportunities lie in smart grids, microgrids, and energy storage systems, where advanced monitoring systems will play a critical role in managing complex energy networks.
Regional Insights
North America dominates the Substation Monitoring System Market, supported by advanced grid infrastructure, high adoption of smart technologies, and significant investments in modernization projects. The presence of leading technology providers and strong regulatory frameworks further strengthen the region’s position.
Europe is also a key market, driven by sustainability initiatives and the integration of renewable energy into power grids. The region’s focus on reducing carbon emissions and improving energy efficiency is encouraging the adoption of advanced monitoring systems.
Asia Pacific is the fastest-growing region, fueled by rapid urbanization, industrialization, and expansion of power infrastructure. Countries such as China and India are investing heavily in smart grid projects and energy infrastructure, driving market growth.
- North America leads due to advanced grid infrastructure
- Europe driven by renewable energy integration
- Asia Pacific fastest-growing with infrastructure expansion
- Increasing investments in smart grid technologies
- Growing demand for reliable power supply
Country-Specific Market Trends
In Asia Pacific, China leads the Substation Monitoring System Market with a CAGR of approximately 11%–13%, driven by large-scale smart grid projects and power infrastructure development. Japan is also witnessing steady growth due to its focus on advanced technologies and energy efficiency.
In North America, the United States dominates the market, growing at a CAGR of 9%–11%, supported by strong investments in grid modernization and smart technologies. Canada is focusing on renewable energy integration, while Mexico is gradually adopting advanced monitoring systems.
In Europe, Germany and France are key contributors, with CAGRs ranging between 8%–10%. These countries are investing in renewable energy and smart grid technologies to achieve sustainability goals.
- China leading with smart grid and infrastructure projects
- Japan focusing on advanced energy technologies
- United States dominating with grid modernization initiatives
- Germany and France driving European market growth
- Canada and Mexico showing steady adoption trends
Key Substation Monitoring System Market Company Insights
The Substation Monitoring System Market is highly competitive, with leading players focusing on innovation, product development, and strategic partnerships. Companies are investing in AI-enabled monitoring solutions and IoT-based platforms to enhance system performance and reliability.
Key players such as Siemens AG, Schneider Electric, ABB Ltd., General Electric Company, and Eaton Corporation are at the forefront of market development. These companies are expanding their product portfolios and investing in research and development to maintain a competitive edge.
Strategic collaborations with utilities, governments, and technology providers are enabling companies to strengthen their market presence. The focus on digital transformation, energy efficiency, and grid resilience is shaping the competitive landscape.
- Companies focusing on AI and IoT integration
- Increasing investment in R&D and innovation
- Strategic partnerships enhancing market reach
- Expansion of product portfolios
- Emphasis on grid reliability and efficiency
Recent Developments
Recent developments in the Substation Monitoring System Market highlight the growing emphasis on digitalization and innovation. Several companies have launched advanced monitoring platforms with AI-driven analytics and real-time data visualization capabilities, improving operational efficiency and decision-making.
Additionally, partnerships between technology providers and utility companies are accelerating the adoption of smart grid solutions. The integration of digital twin technology is also gaining traction, enabling simulation and optimization of substation operations.
Market Segmentation
The Substation Monitoring System Market is segmented by product, technology/component, application, and region. By product, the market includes hardware, software, and services, with hardware dominating due to widespread deployment of sensors and devices. By technology, the market is driven by IoT, AI, cloud computing, and automation, which enhance system performance and scalability.
In terms of application, the market is segmented into transmission and distribution, renewable energy integration, and industrial applications, with transmission and distribution leading the market. Regionally, the market is divided into North America, Europe, Asia Pacific, and the Rest of the World, with North America leading and Asia Pacific showing the fastest growth.
- Hardware segment dominates product category
- IoT and AI driving technological advancements
- Transmission and distribution leading application segment
- North America leading regional market
- Asia Pacific showing highest growth potential
The Substation Monitoring System Market is poised for significant growth through 2036, driven by the increasing demand for reliable power supply and advancements in AI, IoT, and automation technologies. As the energy sector continues to undergo digital transformation, the adoption of intelligent monitoring systems will become increasingly critical.
Businesses operating in this market must focus on innovation, scalability, and strategic partnerships to remain competitive. The integration of AI-driven analytics, cloud computing, and smart technologies will play a crucial role in shaping the future of substation monitoring systems. Overall, the market presents substantial opportunities for growth, particularly in emerging regions and smart grid initiatives.
FAQs - Substation Monitoring System Market
1. What is the current size of the Substation Monitoring System Market?
The market was valued at approximately USD 4–6 billion in 2024.
2. What is the expected growth rate of the market?
The market is expected to grow at a CAGR of 9%–11% from 2025 to 2036.
3. What are the key drivers of market growth?
Key drivers include smart grid adoption, renewable energy integration, and advancements in AI and IoT technologies.
4. Which region leads the market?
North America currently leads the Substation Monitoring System Market.
5. Who are the major players in the market?
Major players include Siemens AG, Schneider Electric, ABB Ltd., General Electric Company, and Eaton Corporation.
To speak to our analyst for a discussion on the above findings, click Speak to Analyst
 Exclusive indicates content/data unique to MarketsandMarkets and not available with any competitors.
Table of Contents
1 Introduction (Page No. - 14)
1.1 Objectives of the Study
1.2 Market Definition
1.3 Market Scope
1.3.1 Markets Covered
1.3.2 Years Considered for the Study
1.3.3 Geographic Scope
1.4 Currency
1.5 Limitations
1.6 Package Size
1.7 Market Stakeholders
2 Research Methodology (Page No. - 18)
2.1 Research Data
2.1.1 Secondary Data
2.1.1.1 Key Data From Secondary Sources
2.1.2 Primary Data
2.1.2.1 Key Data From Primary Sources
2.1.2.2 Key Industry Insights
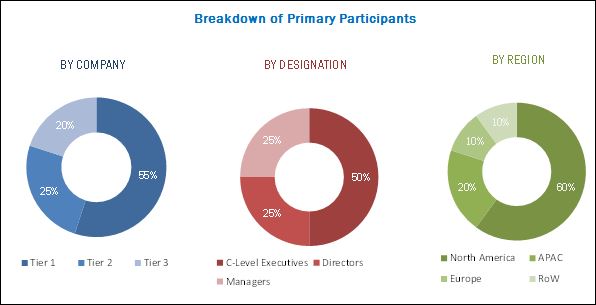
2.1.2.3 Breakdown of Primaries
2.2 Market Size Estimation
2.2.1 Bottom-Up Approach
2.2.2 Top-Down Approach
2.2.3 Market Share Estimation
2.3 Market Breakdown and Data Triangulation
2.4 Research Assumptions
3 Executive Summary (Page No. - 27)
4 Premium Insights (Page No. - 32)
4.1 Attractive Market Opportunities in Overall Substation Monitoring System Market
4.2 Market, By Communication Technology
4.3 APAC Market, By Industry
4.4 Geographic Analysis of Market
4.5 Market in North America, By Country
4.6 Market, By Industry
5 Market Overview (Page No. - 36)
5.1 Introduction
5.2 Market Dynamics
5.2.1 Drivers
5.2.1.1 Growing Demand for Reduction in Transmission and Distribution Losses
5.2.1.2 Aging Infrastructure
5.2.1.3 Increasing Investments (Contracts) From the Government
5.2.1.4 Developing Iec 61850 Standard to Enable Interoperability Between IEDs
5.2.1.5 Improving Iot-Based Communication Network
5.2.2 Restraints
5.2.2.1 High Capital Expenditure for Installations of Wireless Sensor Networks
5.2.2.2 Increasing Cost of Installations of IEDs in Substation
5.2.3 Opportunities
5.2.3.1 Growing Demand for Renewable Energy Projects
5.2.4 Challenges
5.2.4.1 Cyber-Risks in the Power Industry
5.2.4.2 Harsh Environmental Conditions
5.3 Value Chain Analysis
6 Market, By Component (Page No. - 45)
6.1 Introduction
6.2 Hardware
6.2.1 Intelligent Electronic Devices
6.2.1.1 Transformer
6.2.1.1.1 Voltage Instrument Transformer
6.2.1.1.2 Current Instrument Transformer
6.2.1.2 Relay Devices
6.2.1.3 Recloser Controllers
6.2.1.4 Circuit Breakers
6.2.1.5 Switches
6.2.2 Distribution Network Feeders
6.2.3 Others
6.2.3.1 Smart Sensors
6.2.3.2 Microcontrollers
6.2.3.3 Cameras
6.3 Software
6.3.1 Asset Management
6.3.2 Production Management
6.3.3 Performance Management
7 Market, By Communication Technology (Page No. - 59)
7.1 Introduction
7.2 Wired Communication Technology
7.2.1 Fiber Optic
7.2.2 Ethernet
7.2.3 PROFIBUS
7.2.4 Others
7.2.4.1 Fieldbus
7.2.4.2 HART
7.2.4.3 Modbus
7.3 Wireless Communication
7.3.1 Wireless LAN (Wi-Fi)
7.3.2 ZigBee
7.3.3 Cellular Technology
8 Market, By Sector (Page No. - 69)
8.1 Introduction
8.2 Transmission
8.3 Distribution
9 Market, By Industry (Page No. - 77)
9.1 Introduction
9.2 Oil & Gas
9.3 Steel
9.4 Utility
9.4.1 Non-Renewable
9.4.2 Renewable
9.5 Mining
9.6 Transportation
10 Geographic Analysis (Page No. - 88)
10.1 Introduction
10.2 Asia Pacific
10.2.1 China
10.2.2 India
10.2.3 Japan
10.2.4 Rest of APAC
10.3 North America
10.3.1 US
10.3.2 Canada
10.3.3 Mexico
10.4 Europe
10.4.1 UK
10.4.2 France
10.4.3 Germany
10.4.4 Rest of Europe
10.5 RoW
10.5.1 Middle East
10.5.2 Africa
10.5.3 South America
11 Competitive Landscape (Page No. - 112)
11.1 Overview
11.2 Market Share Analysis
11.3 Competitive Scenario
11.3.1 Product Launches/Product Developments
11.3.2 Partnerships, Acquisitions, Contracts, and Agreements
12 Company Profiles (Page No. - 119)
(Business Overview, Products Offered, Product Offering Scorecard, Business Strategy Scorecard, Recent Developments, Key Relationships)*
12.1 ABB
12.2 Siemens
12.3 General Electric
12.4 Schneider Electric
12.5 Cisco
12.6 Honeywell
12.7 Emerson Electric
12.8 Eaton
12.9 Crompton Greaves
12.10 Schweitzer Engineering Laboratories
12.11 Novatech
12.12 Key Innovators
12.12.1 Introduction
12.12.2 Igrid T&D
12.12.3 Sentient Energy
12.12.4 Cadillac Automation and Controls
12.12.5 Tekvel
12.12.6 I-TOR
*Details on Business Overview, Products Offered, Product Offering Scorecard, Business Strategy Scorecard, Recent Developments, Key Relationships Might Not Be Captured in Case of Unlisted Companies.
13 Appendix (Page No. - 157)
13.1 Insights of Industry Experts
13.2 Discussion Guide
13.3 Knowledge Store: Marketsandmarkets’ Subscription Portal
13.4 Introducing RT: Real-Time Market Intelligence
13.5 Available Customizations
13.6 Related Reports
13.7 Author Details
List of Tables (63 Tables)
Table 1 Substation Monitoring System Market, By Component, 2014–2023 (USD Million)
Table 2 Market for Transmission, By Component, 2014–2023 (USD Million)
Table 3 Market for Distribution, By Component, 2014–2023 (USD Million)
Table 4 Market, By Hardware, 2014–2023 (USD Million)
Table 5 Market for Transmission, By Hardware, 2014–2023 (USD Million)
Table 6 Market for Distribution, By Hardware, 2014–2023 (USD Million)
Table 7 Market, By Software, 2014–2023 (USD Million)
Table 8 Market for Transmission, By Software, 2014–2023 (USD Million)
Table 9 Market for Distribution, By Software, 2014–2023 (USD Million)
Table 10 Market, By Communication Technology, 2014–2023 (USD Million)
Table 11 Market for Communication Technology, By Wired, 2014–2023 (USD Million)
Table 12 Market for Communication Technology, By Fiber Optic, 2014–2023 (USD Million)
Table 13 Market for Communication Technology, By Ethernet, 2014–2023 (USD Million)
Table 14 Market for Communication Technology, By PROFIBUS, 2014–2023 (USD Million)
Table 15 Market for Communication Technology, By Others, 2014–2023 (USD Million)
Table 16 Market for Communication Technology, By Wireless, 2014–2023 (USD Million)
Table 17 Market for Communication Technology, By Wireless LAN, 2014–2023 (USD Million)
Table 18 Market for Communication Technology, By ZigBee, 2014–2023 (USD Million)
Table 19 Market for Communication Technology, By Cellular, 2014–2023 (USD Million)
Table 20 Market, By Sector, 2014–2023 (USD Million)
Table 21 Market for Transmission, By Industry, 2014–2023 (USD Million)
Table 22 Market for Transmission, By Communication Technology, 2014–2023 (USD Million)
Table 23 Market for Distribution, By Industry, 2014–2023 (USD Million)
Table 24 Market for Distribution, By Communication Technology, 2014–2023 (USD Million)
Table 25 Market, By Industry, 2014–2023 (USD Million)
Table 26 Market for Oil & Gas, By Communication Technology, 2014–2023 (USD Million)
Table 27 Market for Oil & Gas, By Sector, 2014–2023 (USD Million)
Table 28 Market for Steel, By Communication Technology, 2014–2023 (USD Million)
Table 29 Market for Steel, By Sector, 2014–2023 (USD Million)
Table 30 Market for Utility, By Communication Technology, 2014–2023 (USD Million)
Table 31 Market for Utility, By Sector, 2014–2023 (USD Million)
Table 32 Market for Utility, By Non-Renewable, 2014–2023 (USD Million)
Table 33 Market for Utility, By Renewable, 2014–2023 (USD Million)
Table 34 Market for Mining, By Communication Technology, 2014–2023 (USD Million)
Table 35 Market for Mining, By Sector, 2014–2023 (USD Million)
Table 36 Market for Transportation, By Communication Technology, 2014–2023 (USD Million)
Table 37 Market for Transportation, By Sector, 2014–2023 (USD Million)
Table 38 Market, By Region, 2014–2023 (USD Million)
Table 39 Market in APAC, By Country/Region, 2014–2023 (USD Million)
Table 40 Market in APAC, By Industry, 2014–2023 (USD Million)
Table 41 Market in China, By Industry, 2014–2023 (USD Million)
Table 42 Market in India, By Industry, 2014–2023 (USD Million)
Table 43 Market in Japan, By Industry, 2014–2023 (USD Million)
Table 44 Market in Rest of APAC, By Industry, 2014–2023 (USD Million)
Table 45 Market in North America, By Country, 2014–2023 (USD Million)
Table 46 Market in North America, By Industry, 2014–2023 (USD Million)
Table 47 Market in US, By Industry, 2014–2023 (USD Million)
Table 48 Market in Canada, By Industry, 2014–2023 (USD Million)
Table 49 Market in Mexico, By Industry, 2014–2023 (USD Million)
Table 50 Market in Europe, By Country/Region, 2014–2023 (USD Million)
Table 51 Market in Europe, By Industry, 2014–2023 (USD Million)
Table 52 Market in UK, By Industry, 2014–2023 (USD Million)
Table 53 Market in France, By Industry, 2014–2023 (USD Million)
Table 54 Market in Germany, By Industry, 2014–2023 (USD Million)
Table 55 Market in Rest of Europe, By Industry, 2014–2023 (USD Million)
Table 56 Market in RoW, By Region, 2014–2023 (USD Million)
Table 57 Market in RoW, By Industry, 2014–2023 (USD Million)
Table 58 Market in Middle East, By Industry, 2014–2023 (USD Million)
Table 59 Market in Africa, By Industry, 2014–2023 (USD Million)
Table 60 Market in South America, By Industry, 2014–2023 (USD Million)
Table 61 Top 5 Players in the Market, 2016
Table 62 10 Most Recent Product Launches and Developments in Market
Table 63 5 Most Recent Acquisitions, Partnerships, Agreements, and Contracts in Market
List of Figures (52 Figures)
Figure 1 Market Segmentation
Figure 2 Research Design
Figure 3 Research Flow of Market Size Estimation
Figure 4 Market Size Estimation Methodology: Bottom-Up Approach
Figure 5 Market Size Estimation Methodology: Top-Down Approach
Figure 6 Data Triangulation
Figure 7 Assumptions of the Research Study
Figure 8 Utility Industry to Hold Largest Share of Substation Monitoring System Market During Forecast Period
Figure 9 Hardware to Hold Largest Share of Market During Forecast Period
Figure 10 Transmission to Hold Largest Share of Market During Forecast Period
Figure 11 Oil & Gas Expected to Be Fastest Growing Industry in Market During Forecast Period
Figure 12 APAC to Be Fastest-Growing Region in Market During Forecast Period
Figure 13 Growing Demand for Reduction in Transmission and Distribution Losses to Drive Growth of Market
Figure 14 Wired Communication Technology to Lead Market During Forecast Period
Figure 15 Utility and APAC Expected to Hold Largest Share of Market By 2023
Figure 16 China Expected to Witness Highest CAGR in Market in APAC By 2023
Figure 17 Market in Canada is Expected to Grow at Highest CAGR During Forecast Period
Figure 18 Utility Expected to Hold Largest Share in Market During Forecast Period
Figure 19 Value Chain Analysis: Major Value is Added During Manufacturing and Transmission Phases
Figure 20 Hardware Held Largest Share of Market for Component in 2016
Figure 21 IEDs Expected to Grow at Highest CAGR in Market for Hardware During Forecast Period
Figure 22 Distribution Network Feeders Application
Figure 23 Microcontrollers
Figure 24 Asset Management Expected to Grow at Highest Rate in Market for Software During Forecast Period
Figure 25 Substation Monitoring System Configuration, By Communication Technology
Figure 26 Market for Wireless Communication Technology Expected to Grow at Higher CAGR During Forecast Period
Figure 27 PROFIBUS Expected to Grow at A Higher CAGR in Market for Wired Communication Technology During Forecast Period
Figure 28 Wireless LAN Expected to Grow at Higher CAGR in Market for Wireless Communication Technology During Forecast Period
Figure 29 Market for Distribution Sector Expected to Grow at Higher CAGR During Forecast Period
Figure 30 Oil & Gas Industry Expected to Grow at Highest CAGR in Market for Transmission Between 2017 and 2023
Figure 31 Market for Oil & Gas Industry Based on Distribution Sector Expected to Grow at the Highest Rate During the Forecast Period
Figure 32 Market, By Industry
Figure 33 Oil & Gas Industry Expected to Grow at Highest CAGR in Market During Forecast Period
Figure 34 Coal Held Largest Share of Market for Utility Industry Based on Non-Renewable in 2016
Figure 35 Solar Expected to Grow at Highest CAGR in Market for Utility Industry Based on Renewable During Forecast Period
Figure 36 Market, By Geography
Figure 37 Snapshot of Market in APAC
Figure 38 Snapshot of Market in North America
Figure 39 Snapshot of Market in Europe
Figure 40 Snapshot of Market in RoW
Figure 41 Companies in Market Adopted Product Launches as Key Growth Strategy Between January 2013 and May 2017
Figure 42 Market: Evaluation Framework
Figure 43 Battle for Market Share
Figure 44 ABB: Company Snapshot
Figure 45 Siemens: Company Snapshot
Figure 46 General Electric: Company Snapshot
Figure 47 Schneider Electric: Company Snapshot
Figure 48 Cisco: Company Snapshot
Figure 49 Honeywell : Company Snapshot
Figure 50 Emerson Electric: Company Snapshot
Figure 51 Eaton: Company Snapshot
Figure 52 Crompton Greaves: Company Snapshot
The substation monitoring system market is likely to witness high growth in the coming years, owing to the growing demand for reduction in transmission and distribution losses, aging infrastructure, Increasing investments (contracts) from the government, developing IEC 61850 standard to enable interoperability between IEDs, and improving IoT-based communication network. The substation monitoring system market was valued at USD 3.03 Billion in 2016 and is expected to reach USD 5.21 Billion by 2023, at a growing CAGR of 7.8% during the forecast period. The base year considered for the study is 2016 and the forecast period is between 2017 and 2023. The objective of the report is to provide a detailed analysis of the market based on component, communication technology, sector, industry, and region. The report provides detailed information on the major factors influencing the growth of the market. Moreover, the report provides a detailed overview of the value chain of the substation monitoring system market.
The research methodology used to estimate and forecast the substation monitoring system market begins with obtaining data through secondary research such as Automation World, Electric Energy Online, IEEE, and the newsletters and whitepapers of the leading players in this market. Moreover, the offerings of the substation monitoring system providers have been taken into consideration to determine the market segmentation. The bottom-up procedure has been employed to arrive at the overall size of the substation monitoring system market from the revenue of key players. After arriving at the overall market size, the total market has been split into several segments and subsegments, which have then been verified through primary research by conducting extensive interviews with officials holding key positions in this market, such as CEOs, VPs, directors, and executives. The market breakdown and data triangulation procedures have been employed to complete the overall market engineering process and arrive at the exact statistics for all the segments and subsegments. The breakdown of the profiles of primaries has been depicted in the following figure:
To know about the assumptions considered for the study, download the pdf brochure
The players offering substation monitoring system are ABB (Switzerland), Honeywell (US), Siemens (Germany), Schneider Electric (France), Emerson Electric (US), General Electric (US), Eaton (Ireland), Schweitzer Engineering Laboratories (US), NovaTech (UK), and Crompton Greaves (India).
Target Audience of the Report:
- Raw material and manufacturing equipment suppliers
- Electronic design automation (EDA) and design tool vendors
- Component manufacturers
- Original equipment manufacturers (OEMs)
- Integrated device manufacturers (IDMs)
- Original design manufacturers (ODMs)
- Technology, service, and solution providers
- Suppliers and distributors
- System integrators
- Government and other regulatory bodies
- Technology investors
- Research institutes and organizations
- Market research and consulting firms
This study answers several questions for the stakeholders, primarily regarding the market segments to focus on in the next two to five years for prioritizing efforts and investments.
Scope of the Report:
This research report categorizes the overall substation monitoring system market, based on component, communication technology, sector, industry, and region.
Substation Monitoring System Market, by Component
-
Hardware
- Distribution Network Feeders
- Smart Sensors
- Microcontrollers
- Cameras
-
Intelligent Electronic Devices (IEDs)
- Transformers
- Relay Devices
- Controllers
- Circuit Breakers
- Switches
-
Software
- Asset Management
- Production Management
- Performance Management
Substation Monitoring System Market, by Communication Technology
-
Wired
- Fiber Optic
- Ethernet
- PROFIBUS
- Others (Fieldbus, HART, Modbus)
-
Wireless
- Wireless LAN
- Cellular
- ZigBee
Substation Monitoring System Market, by Sector
- Transmission
- Distribution
Substation Monitoring System Market, by Industry
- Oil & Gas
- Steel
-
Utility
-
Non-Renewable
- Coal
- Crude Oil
- Natural Gas
- Nuclear
-
Renewable
- Solar
- Wind
- Water
- Others (Biofuels and Geothermal)
-
Non-Renewable
- Mining
- Transportation
Substation Monitoring System Market, by Geography
- Asia Pacific (APAC)
- North America
- Europe
- Rest of the World (ROW)
Available Customizations:
With the given market data, MarketsandMarkets offers customizations according to the companies’ specific needs. The following customization options are available for the report:
Company Information
- Detailed analysis and profiling of additional market players on the basis of various blocks of the value chain
Maintenance and Repairing Services
- Further breakdown of market by maintenance and repairing services
Country-wise Breakup in RoW
- Country-wise split of RoW in the substation monitoring system market


Growth opportunities and latent adjacency in Substation Monitoring System Market