Direct Methanol Fuel Cells Market by Application (Portable, Stationary, & Transportation), by Component (Electrode, Membrane, Balance of System, & Balance of Stack), & by Region -Global Forecast to 2020


[152 Pages Report] The Direct Methanol Fuel Cells Market was valued at USD 102.85 Million in 2014, and is projected to reach a market size of USD 188.82 Million by 2020, at a CAGR of 15.3% during the forecast period.
The DMFC units are a feasible alternative to other energy sources such as batteries and diesel-powered engines. While DMFCs can be refuelled within minutes, batteries take hours to recharge. Replacing batteries with DMFCs would also eliminate the need for battery charging infrastructure within the facility. The DMFC is gradually replacing batteries for material handling applications in forklift trucks. Increasing awareness about clean energy and demand for zero emission energy sources is driving the demand in the DMFC market. Furthermore, stringent environmental regulations would act as a catalyst in driving the demand in this market, as the regulations would likely to compel countries to shift their primary energy mix towards cleaner fuels, such as fuel cells.
The DMFC market has been segmented on the basis of application, component, and region. The years considered for the study are: :
- Historical Year - 2013
- Base Year � 2014
- Estimated Year � 2015
- Projected Year � 2020
- Forecast Period � 2015 to 2020
For company profiles in the report, 2014 has been considered. Where information is unavailable for the base year, the prior year has been considered.
Objectives of the study:
- To define and segment the global DMFC market with respect to application, component, and region
- To estimate the market size, in terms of value, of the global DMFC market
- To provide a detailed information regarding major factors influencing the market growth (drivers, restraints, opportunities, and industry-specific challenges)
- To strategically analyze micro markets with respect to individual growth trends, future prospects, and contribution to the total market covered by types of application, component and region
- To study individual growth trends of the DMFC market, their future expansions, and analysis of their contribution to the market
- To strategically profile key market players and comprehensively analyze their market shares and core competencies
- To track and analyze competitive developments, such as joint ventures, mergers & acquisitions, new product developments, awards and recognitions, and research and developments in the global market
Research Methodology
This research study involved the use of extensive secondary sources, directories, and databases, such as, Hoover�s, Bloomberg Businessweek, Factiva, and OneSource, to identify and collect information useful for a technical, market-oriented, and commercial study of the global DMFC market. Primary sources are mainly industry experts from core and related industries, service providers, technology developers, standard and certification organizations of companies, and organizations related to all segments of this industry�s value chain. The points given below explain the research methodology.
- Study of the annual revenue and market developments of major players providing DMFCs
- Analysis of major end-users and demand for DMFCs
- Assessment of future trends and growth of DMFCs
- Analysis of market trends in various regions or countries by studying the applications of DMFCs
- Study of contracts and developments related to DMFCs by key players across different regions
- Finalization of overall market sizes by triangulating the supply-side data, which includes product developments and annual revenues of companies providing DMFCs across the globe
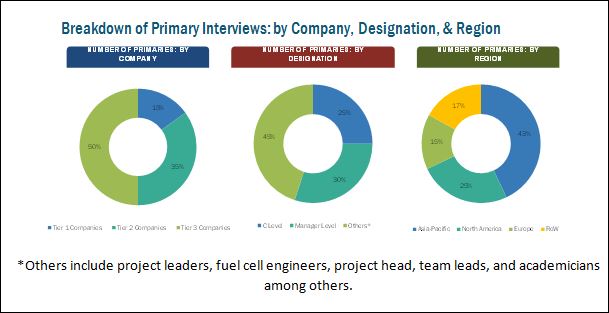
After arriving at the overall market size, the total market has been split into several segments and sub-segments. The figure given below illustrates the breakdown of primaries conducted during the research study on the basis of company type, designation, and region.
To know about the assumptions considered for the study, download the pdf brochure
Target Audience:
- Original equipment manufacturers
- DMFC component providers
- Methanol producers
- Distributers and suppliers
- Consulting firms
- Private equity groups
- Investment houses
- Equity research firms
- Government Agencies
- State and National Regulatory Authorities
Primarily, the report provides information about market segments and helps stakeholders to decide their focus areas in next two-to-five years for prioritizing efforts and investments.
Scope of the Report
On the basis of Application:
- Portable
- Stationary
- Transportation
On the basis of Componenet:
- Electrode
- Membrane
- Balance of System
- Balance of Stack
On the basis of Region:
- Asia-Pacific
- North America
- Europe
- Rest Of The World
Available Customizations
With the market data provided above, MarketsandMarkets offers customizations as per the company�s specific needs. The following customization options are available for the report:
- Detailed analysis and profiling of additional market players (Up to 5)
- Fuel Cell Technology Market, by Application
The Direct Methanol Fuel Cells (DMFC) market is expected to reach USD 188.82 Million by 2020, at a CAGR of 15.3% from 2015 to 2020. The growing demand for clean energy has been accompanied by depletion of fossil fuels, which has shifted the focus toward fuel cell markets. The DMFC market is still in its initial development phase in all the regions due to slow infrastructure development for refueling of fuel cells, technical limitations, and use of expensive materials for its manufacturing. Government initiatives and grants for fuel cell research, investments from financial institutions, high-energy storage density as compared with batteries and other fuel cells, growing demand for clean energy, and use of cheaper metals for its manufacturing are driving the growth of the global DMFC market.
The report segments the DMFC market on the basis of its application which include portable, stationary, and transportation. The portable application is the highest growth market for DMFC. The stationary DMFC application is projected to dominate the global DMFC market during the forecast period.
The DMFC market has also been segmented on the basis of components into electrodes, membranes, balance of stack, and balance of system, among others. Majority of the DMFC market is captured by electrode component.
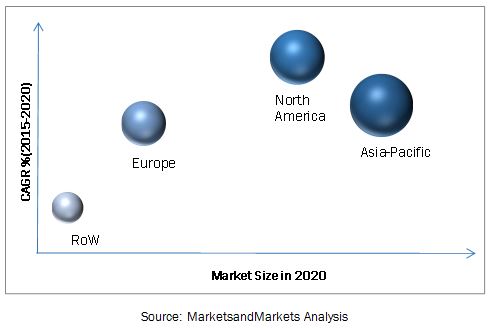
Asia-Pacific is the leading market for DMFC, owing to significant investments in fuel cell technologies, especially in Japan and South Korea. Governments of countries such as Japan and South Korea have also been undertaking initiatives to reduce dependence on nuclear energy and fossil fuel and move toward renewable energy. The Japanese government is investing in fuel cell technology that will power the 2020 Olympics in Tokyo. Other countries, such as Singapore, India, Indonesia, and Malaysia, have started or are expected to start exclusive programs to promote fuel cells in regional markets. These countries are currently focusing on back-up power (stationary application) fuel cells. India is expected to invest in fuel cell systems that will provide back-up power for telecommunication towers from 2015 to 2020.
The figure given below shows the market size of various regions in 2015 and 2020 with respective CAGR.
Methanol crossover results in loss of efficiency. For this reason, applications which require high efficiency, generally, do not prefer DMFC as its efficiency is lower as compared with other fuel cells. Secondly, DMFC involves the use of a catalyst to convert chemical energy into electrical energy. The catalyst used during the process is mainly platinum, which is expensive. Platinum was priced at around USD 844.52 per troy ounce as of December 2015, which makes periodic replacement of catalyst infeasible. These have proved to be restraining factors for the growth of the DMFC market.
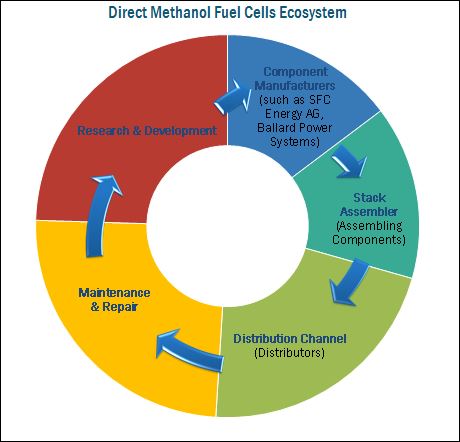
Some of the leading players in the DMFC market include SFC Energy AG (Germany), Ballard Power Systems, Inc. (Canada), and Oorja Protonics (U.S.). These players have adopted growth strategies such as new product launches, contracts & agreements, mergers & acquisitions, and expansions to capture a larger share in the DMFC market.
 Exclusive indicates content/data unique to MarketsandMarkets and not available with any competitors.
Table of Contents
1 Introduction (Page No. - 16)
1.1 Objectives of the Study
1.2 Market Definition
1.3 Study Scope
1.3.1 Markets Covered
1.3.2 Years Considered for the Study
1.4 Currency
1.5 Limitations
1.6 Stakeholders
2 Research Methodology (Page No. - 18)
2.1 Research Data
2.1.1 Secondary Data
2.1.1.1 Key Data From Secondary Sources
2.1.2 Primary Data
2.1.2.1 Key Data From Primary Sources
2.1.2.2 Key Industry Insights
2.1.2.3 Breakdown of Primaries
2.2 Market Size Estimation
2.2.1 Bottom-Up Approach
2.2.2 Top-Down Approach
2.3 Market Breakdown & Data Triangulation
2.4 Research Assumptions & Limitations
2.4.1 Assumptions
2.4.2 Limitations
3 Executive Summary (Page No. - 27)
3.1 Introduction
3.1.1 Historical Backdrop
3.2 Current Scenario
3.3 Future Outlook
3.4 Conclusion
4 Premium Insights (Page No. - 32)
4.1 Attractive Market Opportunities
4.2 Stationary Direct Methanol Fuel Cells are Expected to Dominate in the Forecast Period
4.3 Asia-Pacific Held the Largest Market Share in Direct Methanol Fuel Cells Market in 2015
4.4 Asia-Pacific, the Largest Direct Methanol Fuel Cells Market in 2014
4.5 Direct Methanol Fuel Cells Market: By Application
4.6 Portable Direct Methanol Fuel Cells Market is Expected to Grow at the Fastest Pace During 2015-2020
5 Market Overview (Page No. - 38)
5.1 Introduction
5.2 Market Segmentation
5.2.1 By Application
5.2.1.1 Portable
5.2.1.2 Stationary
5.2.1.3 Transportation
5.2.2 By Component
5.2.2.1 Electrodes
5.2.2.2 Membranes
5.2.2.3 Balance of Stack
5.2.2.3.1 Gas Diffusion Layer
5.2.2.3.2 Bipolar Plate
5.2.2.4 Balance of System
5.2.2.4.1 Fuel System
5.3 Market Dynamics
5.3.1 Drivers
5.3.1.1 Increasing Demand for Clean Energy
5.3.1.2 High Investments in Fuel Cell Development
5.3.1.3 Ease of Transport & Storage
5.3.1.4 High Energy Density of Direct Methanol Fuel Cells
5.3.1.5 More Reliable Than Internal Combustion Engines
5.3.2 Restraints
5.3.2.1 Methanol Crossover & Low Efficiency
5.3.2.2 Low Oil Prices
5.3.2.3 Expensive Catalyst
5.3.3 Opportunities
5.3.3.1 Technological Innovation
5.3.3.2 Research Collaborations
5.3.3.3 Portable Applications
5.3.4 Challenges
5.3.4.1 Competition From Existing Technologies
5.3.4.2 Lack of Infrastructure for Dmfc Vehicles
5.4 Impact of Market Dynamics
5.5 Burning Issues
5.5.1 Low Durability
5.6 Supply Chain Analysis
5.7 Porter�s Five Forces Analysis
5.7.1 Threat of New Entrants
5.7.2 Threat of Substitutes
5.7.3 Bargaining Power of Buyers
5.7.4 Bargaining Power of Suppliers
5.7.5 Intentsity of Competitive Rivalry
6 Direct Methanol Fuel Cells Market, By Application (Page No. - 52)
6.1 Introduction
6.2 Portable Direct Methanol Fuel Cells Market
6.2.1 By Region
6.2.2 By Component
6.3 Stationary Direct Methanol Fuel Cells Market
6.3.1 By Region
6.3.2 By Component
6.4 Transportation Direct Methanol Fuel Cells Market
6.4.1 By Region
6.4.2 By Component
7 Direct Methanol Fuel Cells Market, By Component (Page No. - 62)
7.1 Introduction
7.2 Direct Methanol Fuel Cells Electrode Market
7.2.1 By Application
7.3 Direct Methanol Fuel Cells Membrane Market
7.3.1 By Application
7.4 Direct Methanol Fuel Cells Balance of System Market
7.4.1 By Application
7.5 Direct Methanol Fuel Cells Balance of Stack Market
7.5.1 By Application
8 Direct Methanol Fuel Cells Market, By Region (Page No. - 67)
8.1 Introduction
8.2 Asia-Pacific
8.3 North America
8.4 Europe
8.5 Rest of the World
9 Fuel Cell Technology Market, By Type (Page No. - 78)
9.1 Introduction
9.2 Polymer/Proton Exchange Membrane Fuel Cells (PEMFC)
9.3 Molten Carbonate Fuel Cells (MCFC)
9.4 Solid Oxide Fuel Cells (SOFC)
9.5 Phosphoric Acid Fuel Cells (PAFC)
9.6 Others
9.7 By Region
9.7.1 Introduction
9.7.2 Asia-Pacific
9.7.3 North America
9.7.4 Europe
9.7.5 Rest of the World
10 Competitive Landscape (Page No. - 99)
10.1 Overview
10.2 Competitive Situation & Trends
10.2.1 Contracts & Agreements
10.2.2 New Product/Technology Developments
10.2.3 Mergers & Acquisitions
10.2.4 Expansions
10.2.5 Other Developments
11 Company Profiles (Page No. - 107)
(Company at A Glance, Recent Financials, Products & Services, Strategies & Insights, & Recent Developments)*
11.1 Introduction
11.2 SFC Energy AG
11.3 Ballard Power Systems Inc.
11.4 Oorja Protonics Inc.
11.5 Horizon Fuel Cell Technologies
11.6 Meoh Power, Inc.
11.7 Bren-Tronics Incorporated
11.8 Treadstone Technologies Inc.
11.9 Viaspace Inc.
11.10 E. I. Du Pont De Nemours and Company
11.11 Ird Fuel Cell A/S
11.12 Johnson Matthey
11.13 Fujikura Limited
11.14 Antig Technology Co. Ltd.
11.15 Samsung SDI
*Details on Company at A Glance, Recent Financials, Products & Services, Strategies & Insights, & Recent Developments Might Not Be Captured in Case of Unlisted Companies.
12 Appendix (Page No. - 144)
12.1 Insights of Industry Experts
12.2 Discussion Guide
12.3 Introducing RT: Real Time Market Intelligence
12.4 Available Customizations
12.5 Related Reports
List of Tables (90 Tables)
Table 1 Comparison Between Operating Parameters of Different Fuel Cells
Table 2 Fuel Cells: Operating Parameters
Table 3 Direct Methanol Fuel Cell Market Size, By Application, 2013-2020 (USD Million)
Table 4 Direct Methanol Fuel Cells Market Size, By Application, 2013-2020 (Kw)
Table 5 Direct Methanol Fuel Cells Market Size, By Application, 2013-2020 (Units Shipped)
Table 6 Portable Direct Methanol Fuel Cell Market Size, By Region, 2013-2020 (USD Million)
Table 7 Portable By Market Size, By Region, 2013-2020 (Kw)
Table 8 Portable By Market Size, By Region, 2013-2020 (Units Shipped)
Table 9 Portable By Market Size, By Component, 2013-2020 (USD Million)
Table 10 Stationary Direct Methanol Fuel Cells Market Size, By Region, 2013-2020 (USD Million)
Table 11 Stationary By Market Size, By Region, 2013-2020 (Kw)
Table 12 Stationary By Market Size, By Region, 2013-2020 (Units Shipped)
Table 13 Stationary By Market Size, By Component, 2013-2020 (USD Million)
Table 14 Transportation Direct Methanol Fuel Cells Market Size, By Region, 2013-2020 (USD Million)
Table 15 Transportation By Market Size, By Region, 2013-2020 (Kw)
Table 16 Transportation By Market Size, By Region, 2013-2020 (Units Shipped)
Table 17 Transportation By Market Size, By Component, 2013-2020 (USD Million)
Table 18 Direct Methanol Fuel Cells Market Size, By Component, 2013-2020 (USD Million)
Table 19 Direct Methanol Fuel Cells Electrode Market Size, By Application, 2013-2020 (USD Million)
Table 20 Direct Methanol Fuel Cells Membrane Market Size, By Application, 2013-2020 (USD Million)
Table 21 Direct Methanol Fuel Cells Balance of System Market Size, By Application, 2013-2020 (USD Million)
Table 22 Direct Methanol Fuel Cells Balance of Stack Market Size, By Application, 2013-2020 (USD Million)
Table 23 Direct Methanol Fuel Cells Market, By Region, 2013�2020 (USD Million)
Table 24 Direct Methanol Fuel Cells Market, By Region, 2013�2020 (Kw)
Table 25 Direct Methanol Fuel Cell Market, By Region, 2013�2020 (Units Shipped)
Table 26 Asia-Pacific: Direct Methanol Fuel Cells Market, By Application, 2013�2020 (USD Million)
Table 27 Asia-Pacific: By Market, By Application, 2013�2020 (Kw)
Table 28 Asia-Pacific: By Market, By Application, 2013�2020 (Units Shipped)
Table 29 North America: Direct Methanol Fuel Cell Market, By Application, 2013�2020 (USD Million)
Table 30 North America: By Market, By Application, 2013�2020 (Kw)
Table 31 North America: By Market, By Application, 2013�2020 (Units Shipped)
Table 32 Europe: Direct Methanol Fuel Cells Market, By Application, 2013�2020 (USD Million)
Table 33 Europe: By Market, By Application, 2013�2020 (Kw)
Table 34 Europe: By Market, By Application, 2013�2020 (Units Shipped)
Table 35 Rest of the World: Direct Methanol Fuel Cells Market, By Application, 2013�2020 (USD Million)
Table 36 Rest of the World: By Market, By Application, 2013�2020 (Kw)
Table 37 Rest of the World: By Market, By Application, 2013�2020 (Units Shipped)
Table 38 Fuel Cell Type: Pros and Cons
Table 39 Fuel Cell Technology Market Size, By Type, 2013�2020 (USD Million)
Table 40 Fuel Cell Technology Market Size, By Type, 2013�2020 (MW)
Table 41 Fuel Cell Technology Market Size, By Type, 2013�2020 (Units Shipped)
Table 42 Polymer/Proton Exchange Membrane Fuel Cell Technology Market Size, By Region, 2013�2020 (USD Million)
Table 43 Polymer/Proton Exchange Membrane Fuel Cell Technology Market Size, By Region, 2013�2020 (MW)
Table 44 Polymer/Proton Exchange Membrane Fuel Cell Technology Market Size, By Region, 2013�2020 (Units Shipped)
Table 45 Molten Carbonate Fuel Cell Technology Market Size, By Region, 2013�2020 (USD Million)
Table 46 Molten Carbonate Fuel Cell Technology Market Size, By Region, 2013�2020 (MW)
Table 47 Molten Carbonate Fuel Cell Technology Market Size, By Region, 2013�2020 (Units Shipped)
Table 48 Solid Oxide Fuel Cell Technology Market Size, By Region, 2013�2020 (USD Million)
Table 49 Solid Oxide Fuel Cell Technology Market Size, By Region, 2013�2020 (MW)
Table 50 Solid Oxide Fuel Cell Technology Market Size, By Region, 2013�2020 (Units Shipped)
Table 51 Phosphoric Acid Fuel Cell Technology Market Size, By Region, 2013�2020 (USD Million)
Table 52 Phosphoric Acid Fuel Cell Technology Market Size, By Region, 2013�2020 (MW)
Table 53 Phosphoric Acid Fuel Cell Technology Market Size, By Region, 2013�2020 (Units Shipped)
Table 54 Other Fuel Cell Technology Market Size, By Region, 2013�2020 (USD Million)
Table 55 Other Fuel Cell Technology Market Size, By Region, 2013�2020 (MW)
Table 56 Other Fuel Cell Technology Market Size, By Region, 2013�2020 (Units Shipped)
Table 57 Fuel Cell Technology Market Size, By Region, 2013�2020 (USD Million)
Table 58 Fuel Cell Technology Market Size, By Region, 2013�2020 (MW)
Table 59 Fuel Cell Technology Market Size, By Region, 2013�2020 (Units Shipped)
Table 60 Asia-Pacific: Fuel Cell Technology Market Size, By Type, 2013�2020 (USD Million)
Table 61 Asia-Pacific: Fuel Cell Technology Market Size, By Type, 2013�2020 (MW)
Table 62 Asia-Pacific: Fuel Cell Technology Market Size, By Type, 2013�2020 (Units Shipped)
Table 63 North America: Fuel Cell Technology Market Size, By Type, 2013�2020 (USD Million)
Table 64 North America: Fuel Cell Technology Market Size, By Type, 2013�2020 (MW)
Table 65 North America: Fuel Cell Technology Market Size, By Type, 2013�2020 (Units Shipped)
Table 66 Europe: Fuel Cell Technology Market Size, By Type, 2013�2020 (USD Million)
Table 67 Europe: Fuel Cell Technology Market Size, By Type, 2013�2020 (MW)
Table 68 Europe: Fuel Cell Technology Market Size, By Type, 2013�2020 (Units Shipped)
Table 69 Rest of the World: Fuel Cell Technology Market Size, By Type, 2013�2020 (USD Million)
Table 70 Rest of the World: Fuel Cell Technology Market Size, By Type, 2013�2020 (MW)
Table 71 Rest of the World: Fuel Cell Technology Market Size, By Type, 2013�2020 (Units Shipped)
Table 72 Contracts & Agreements, 2015
Table 73 New Product Developments, 2014-2015
Table 74 Mergers & Acquisitions, 2013-2015
Table 75 Expansions, 2014-2015
Table 76 Other Developments, 2014-2015
Table 77 SFC Energy AG: Products Offered
Table 78 Ballard Power Systems Inc.: Products Offered
Table 79 Oorja Protonics Inc.: Products Offered
Table 80 Horizon Fuel Cell Technologies: Products Offered
Table 81 Meoh Power, Inc.: Products Offered
Table 82 Bren-Tronics Incorporated: Products Offered
Table 83 Treadstone Technologies Inc.: Products Offered
Table 84 Viaspace Inc.: Products Offered
Table 85 E. I. Du Pont De Nemours and Company: Products Offered
Table 86 Ird Fuel Cell A/S: Products & Services Offered
Table 87 Johnson Matthey: Products Offered
Table 88 Fujikura Limited.: Products Offered
Table 89 Antig Technology Co. Ltd.: Products Offered
Table 90 Samsung SDI: Products Offered
List of Figures (40 Figures)
Figure 1 Research Design: Direct Methanol Fuel Cells Market
Figure 2 Bottom-Up Approach
Figure 3 Top-Down Approach
Figure 4 Data Triangulation Methodology
Figure 5 Assumptions of the Research Study
Figure 6 Limitations of the Research Study
Figure 7 Asia-Pacific Dominated the Direct Methanol Fuel Cells Market, By Value, in 2014
Figure 8 Direct Methanol Fuel Cells Market: Application Snapshot (USD Million)
Figure 9 The Stationary Application Segment Generated the Highest Demand for Direct Methanol Fuel Cells in 2014
Figure 10 Top Regions in the Direct Methanol Fuel Cells Market (Value), By Application, 2014
Figure 11 Back-Up Power Requirement in Asia-Pacific is Expected to Drive the Direct Methanol Fuel Cell Market During the Forecast Period
Figure 12 The Segment is Projected to Occupy the Largest Market Size From 2015 to 2020
Figure 13 Asia-Pacific Held the Market Share of 48.5% in the Global Direct Methanol Fuel Cells Market, 2015
Figure 14 Asia-Pacific Held the Largest Market Share (By Value) in the Direct Methanol Fuel Cell Market in 2014
Figure 15 Stationary & Portable Direct Methanol Fuel Cells Applications are Expected to Account for Majority of the Market Share During the Forecast Period
Figure 16 The Portable Direct Methanol Fuel Cell Market is Expected to Grow at the Highest CAGR During the Forecast Period
Figure 17 Market Dynamics: Direct Methanol Fuel Cells
Figure 18 Fuel Cells, By Shipment (�000 Units), 2010 � 2015
Figure 19 Direct Methanol Fuel Cells Have the Highest Energy Density Supporting the Portable Applications
Figure 20 Impact of Market Dynamics
Figure 21 Direct Methanol Fuel Cells Market: Supply Chain Analysis
Figure 22 Porter�s Five Forces Analysis: Direct Methanol Fuel Cells Market
Figure 23 Market Share of the Direct Methanol Fuel Cell Market, By Application, 2015 & 2020 (Units Shipped)
Figure 24 Direct Methanol Fuel Cells Market Share (By Volume), By Region, 2014
Figure 25 Reaction Equations of A Typical Direct Methanol Fuel Cell
Figure 26 Regional Snapshot: Asia-Pacific to Be the Fastest-Growing Market, in Terms of Value (USD Million), for Direct Methanol Fuel Cells (2015-2020)
Figure 27 Asia-Pacific to Dominate the Direct Methanol Fuel Cells Market, By Value, During the Forecast Period
Figure 28 Regional Snapshot: Increasing Clean Energy Investment in Asia-Pacific Provides Attractive Market Opportunities
Figure 29 Regional Snapshot: Increasing Research and Development in North America Provides Attractive Market Opportunities
Figure 30 Companies Adopted Contracts & Agreements and New Product/Service/Technology Developments to Capture the Market During 2012-2015
Figure 31 Battle for Market Share: Contracts & Agreements Was the Key Strategy, 2012-2015
Figure 32 SFC Energy AG Accounted for the Maximum Share in the Direct Methanol Fuel Cells Market, 2014
Figure 33 Market Evaluation Framework: Contracts & Agreements, New Product Launches, and Mergers & Acquisitions Fueled the Growth of Companies From 2012 - 2015
Figure 34 Region-Wise Revenue of the Top Market Players
Figure 35 SFC Energy AG: Company Snapshot
Figure 36 Ballard Power Systems Inc.: Company Snapshot
Figure 37 Viaspace Inc.: Company Snapshot
Figure 38 E. I. Du Pont De Nemours and Company: Company Snapshot
Figure 39 Johnson Matthey: Company Snapshot
Figure 40 Fujikura Limited: Company Snapshot
Figure 41 Samsung SDI: Company Snapshot


Growth opportunities and latent adjacency in Direct Methanol Fuel Cells Market