North America Fuel Cell Technology Market By Applications (Portable, Stationary, Transport), Types (PEMFC, DMFC, PAFC, SOFC, MCFC), Fuel (Hydrogen, Natural Gas, Methanol, Anaerobic Digester Gas) & Geography- Trends And Forecast To 2018


The technology used in fuel cell is the conversion of chemical energy into electrical energy through electromechanical reaction. The difference between a battery and a fuel cell is that in battery, fuel is available inside the packaging and in fuel cell, fuel is supplied from outside. Fuel cells are an alternate to internal combustion which is a mechanical process occurring in engine. Fuel cells can be made of different types based on the electrolyte used for the reaction in the cell. Fuels such as hydrogen, methanol, biogas, natural gas, and hydrocarbons are suitable for fuel cells; however, the preference of primary fuel also depends on the electrolyte. North America fuel cell market is the second-largest market for fuel cells in the world after Asia. North America provides favorable government policies, appropriate research works, good public private collaboration, and a strong infrastructure for fuel cells.
This report segments the North America fuel cell market by their applications, types, primary fuel used, and countries. The report analyzes market trends, growth, and future prospective of the fuel cell market. The data has been analyzed over a period of 2011 to 2018 and has been quantified for above segments and presented in terms of their value ($million).
The North America fuel cell market is estimated at around $667.7 million by 2018 with unit shipments increasing from 3,569 units in 2012 to 331,611 units by 2018. The North American fuel cell market is very conducive to investments with various research projects getting commercialized. U.S. is one of the biggest markets for fuel cell and it is on the forefront of innovation with support from the U.S. Department of Energy. U.S. Navy and U.S. Army are very enthusiastic markets for fuel cell manufacturers in North America.
Major fuel cell manufacturers in North America such as Ballard (Canada), Plug Power (U.S.), Fuel Cell Energy (U.S.), Oorja Fuel Cells (U.S.), and Hydrogenics (U.S.) are leading the innovation and commercialization of fuel cells. These same companies are profiled in the report along with their growth strategies, financial details, and recent developments.
Customer Interested in this report also can view
-
Europe Fuel Cell Technology Market: By Applications (Portable, Stationary, Transport), Types (PEMFC, DMFC, PAFC, SOFC, MCFC), Fuel (Hydrogen, Natural Gas, Methanol, Anaerobic Digester Gas) & Geography- European Trends And Forecast To 2018
-
Fuel Cell Technology Market: By Applications (Portable, Stationary, Transport), Types (PEMFC, DMFC, PAFC, SOFC, MCFC), Fuel (Hydrogen, Natural Gas, Methanol, Anaerobic Digester Gas) & Geography- Global Trends and Forecast to 2018
Fuel Cell Technology is a clean energy source getting commercialized widely for its applications. The fuel cell industry has been growing at a promising growth rate in past few years. The technological developments and growing commercialization have fuelled the demand for fuel cells. This growing demand of fuel cells has been positively affecting the development of hydrogen infrastructure globally.
North American fuel cell market is witnessing high growth based on increased clean energy demand and large investments related to hydrogen infrastructure development, especially in U.S. and Canada. U.S. holds the major market share followed by Canada. In terms of applications of the fuel cell, the market is dominated by stationary applications due to the off grid applications and household applications.
NORTH AMERICA FUEL CELL MARKET SHARE, BY GEOGRAPHY, 2012
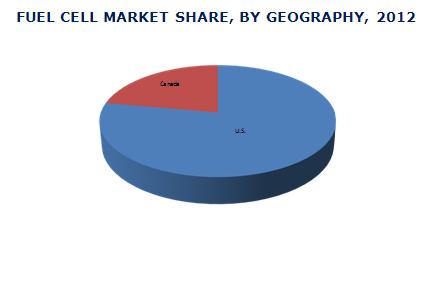
Source: MarketsandMarkets Analysis
Ballard (Canada), Plug Power (U.S.), FuelCell Energy (U.S.), Oorja Fuel Cells (U.S.), and Hydrogenics (U.S.) are the major players constituting majority of the market share in North America.
Most of these companies rely on growth strategies such as agreements and contracts, joint ventures and collaborations, mergers and acquisitions, and expansions in diversified geographic areas. The growing demand for technologically advanced clean energy solutions has prompted most of the companies to launch highly innovative and integrated fuel cell solutions.
Agreements, collaborations & partnerships are the key strategies that are helping the companies to penetrate the existing market, and expansion into the new and emerging markets.
Major fuel type/technologies include Polymer/Proton Exchange Membrane (PEM) Fuel Cell, Direct Methanol Fuel Cell, and Phosphoric Acid Fuel Cell, Solid Oxide Fuel Cell, Molten Carbonate Fuel Cell and others. Polymer/Proton Exchange Membrane (PEM) Fuel Cell is the largest type in terms of revenue generation.
 Exclusive indicates content/data unique to MarketsandMarkets and not available with any competitors.
Table Of Contents
1 Introduction (Page No. - 14)
1.1 Key Take-Aways
1.2 Report Description
1.3 Markets Covered
1.4 Stakeholders
1.5 Research Methodology
1.5.1 Market Size
1.5.2 Key Data Points Taken From Secondary Sources
1.5.3 Key Data Points Taken From Primary Sources
1.5.4 Assumptions Made For This Report
2 Executive Summary (Page No. - 18)
3 Premium Insights (Page No. - 20)
3.1 U.S. Dominating The North American Market
3.2 U.S. Leads The Market, By Capacity
3.3 U.S. Holding Major Share, By Unit Shipments
3.4 PEMFC & MCFC Dominate Market By Capacity While DMFC, PAFC, And SOFC Indicate Towering Growth
3.5 Stationary Fuel Cells Expected To Dominate North America
3.6 PEMFC Dominating The Fuel Cell Market
3.7 Hydrogen - Most Effective Fuel
4 Market Overview (Page No. - 33)
4.1 Introduction
4.2 Burning Issues
4.2.1 New Technologies In Hydrogen Storage
4.2.2 To Develop Low Carbon Economy
4.3 Winning Imperatives
4.3.1 Collaborations/Partnership For Research
4.3.2 Mergers & Acquisitions
4.4 Market Dynamics
4.4.1 Drivers
4.4.1.1 Partnerships
4.4.1.2 Surplus Raw Material For Hydrogen Generation
4.4.1.3 U.S. DOE And Canadian Government Funding
4.4.2 Restraints
4.4.2.1 Lack Of Uniform Policies For Fuel Cells In Various States
4.4.3 Opportunities
4.4.3.1 Advancement In Fuel Cell Electric Vehicles
4.4.3.2 High Demand In Materials Handling Vehicles Market
4.5 Investments In R&D
4.6 Value Chain Analysis
4.7 Porter�s Five Forces Analysis For Fuel Cells
4.8 Patent Analysis
5 North American Fuel Cell Market, By Applications (Page No. - 47)
5.1 Introduction
5.2 Fuel Cell Market - By Applications
5.3 Stationary Applications Market
5.4 Transportation Applications Market
5.5 Portable Applications Market
6 North American Fuel Cell Market, By Countries (Page No. - 65)
6.1 Market Overview
6.2 United States
6.3 Canada
7 North American Fuel Cell Market,By Types/Technologies (Page No. - 85)
7.1 Introduction
7.2 Market Overview
7.3 Polymer/Proton Exchange Membrane Fuel Cells (PEM)
7.4 Solid Oxide Fuel Cells (SOFC)
7.5 Molten Carbonate Fuel Cells (MCFC)
7.6 Phosphoric Acid Fuel Cells (PAFC)
7.7 Direct Methanol Fuel Cells (DMFC)
7.8 Alkaline Fuel Cells (AFC)
7.9 Direct Carbon Fuel Cells (DCFC)
7.10 Zinc Air Fuel Cells (ZAFC)
7.11 Protonic Ceramic Fuel Cells (PCFC)
7.12 Microbial Fuel Cells (MFC)
8 North American Fuel Cells Market, By Fuel (Page No. - 105)
8.1 Introduction
8.2 Hydrogen
8.3 Natural Gas/Methane
8.4 Methanol
8.5 Anaerobic Digester Gas
9 Competitive Landscape (Page No. - 116)
9.1 Introduction
9.2 Growth Strategies In The North American Fuel Cell Market, 2010 � 2013
9.3 Most Active Companies In The North American Fuel Cell Market (2011 - 2013)
9.4 Agreements, Collaborations & Partnerships
9.5 New Products Launch
9.6 Investments, Expansion & Other Developments
9.7 Mergers & Acquisition
10 Company Profiles (Page No. - 133)
(Overview, Financials, Products & Services, Strategy, And Developments)*
10.1 Ballard Power Systems Inc.
10.2 Bloom Energy Corp.
10.3 Clearedge Power
10.4 Fuelcell Energy
10.5 Hydrogenics Corporation
10.6 Nuvera Fuel Cells
10.7 Oorja Protonics
10.8 Plug Power Inc.
10.9 Protonex Technology Corporation
10.10 Relion Inc.
*Details On Overview, Financials, Product & Services, Strategy, And Developments Might Not Be Captured In Case Of Unlisted Companies..
List Of Tables (90 Tables)
Table 1 North America: Fuel Cell Market, By Units, 2011 � 2018
Table 2 Regional Dominance & Key Market Players
Table 3 Market Demand Variations
Table 4 Unit Shipments: Market Scenario
Table 5 Fuel Cell: Market Growth, By Types
Table 6 Fuel Cell: Applications & Key Insights
Table 7 Fuel Cell, By Types
Table 8 Fuel Cell Market, Fuel Types
Table 9 Porter�s Five Forces Analysis
Table 10 Fuel Cell Characteristics, By Applications
Table 11 Fuel Cell: Market Volume, By Applications,2011 � 2018 (Unit Shipments)
Table 12 Fuel Cell: Market Capacity, By Applications, 2011 � 2018 (MW)
Table 13 Fuel Cell: Market Revenue, By Applications,2011 � 2018 ($Million)
Table 14 Stationary Fuel Cells: Market Volume, By Countries,2011 � 2018 (Unit Shipments)
Table 15 Stationary Fuel Cells: Market Capacity, By Countries,2011 � 2018 (MW)
Table 16 Stationary Fuel Cells: Market Revenue, By Countries, 2011 � 2018 ($Million)
Table 17 Transportation Fuel Cells: Market Volume, By Countries, 2011 � 2018 (Unit Shipments)
Table 18 Transportation Fuel Cells: Market Capacity, By Countries, 2011 � 2018 (MW) 59
Table 19 Transportation Fuel Cells: Market Revenue, By Countries, 2011 � 2018 ($Million)
Table 20 Different Portable Applications
Table 21 Portable Fuel Cells: Market Volume, By Countries,2011 � 2018 (Unit Shipments)
Table 22 Portable Fuel Cells: Market Capacity, By Countries,2011 � 2018 (MW)
Table 23 Portable Fuel Cells: Market Revenue, By Countries,2011 � 2018 ($Million)
Table 24 North American Fuel Cell: Market Volume, By Geography,2011 � 2018 (Unit Shipments)
Table 25 North American Fuel Cell: Market Capacity, By Geography, 2011 � 2018 (MW)
Table 26 North American Fuel Cell: Market Revenue, By Geography, 2011 � 2018 ($Million)
Table 27 U.S.: Fuel Cell Developments, By States
Table 28 United States: Fuel Cell: Market Volume, By Applications, 2011 � 2018 (Unit Shipments)
Table 29 United States: Fuel Cells Market Capacity, By Applications, 2011 � 2018 (MW)
Table 30 United States: Fuel Cells Market Revenue, By Applications, 2011 � 2018 ($Million)
Table 31 Fuel Cells: Market Volume, By Fuel Cell Technology,2011 � 2018 (Units)
Table 32 U.S.: Fuel Cells Market Capacity, By Fuel Cell Technology, 2011 � 2018 (MW)
Table 33 United States: Fuel Cells Market Revenue, By Fuel Cell Technology, 2011 � 2018 ($Million)
Table 34 Canada: Fuel Cell Market Volume, By Applications,2011 � 2018 (Unit Shipments)
Table 35 Canada: Fuel Cell Market Capacity, By Applications,2011 � 2018 (MW)
Table 36 Canada: Fuel Cell Market Revenue, By Applications,2011 � 2018 ($Million)
Table 37 Canada: Fuel Cell Market Volume, By Fuel Cell Technology, 2011 � 2018 (Unit Shipments)
Table 38 Canada: Fuel Cell Market Capacity, By Fuel Cell Technology, 2011 � 2018 (MW)
Table 39 Canada: Fuel Cell Market Revenue, By Fuel Cell Technology, 2011 � 2018 ($Million)
Table 40 Fuel Cell: Characteristics, By Types
Table 41 Types Of Fuel Cell � Pros & Cons
Table 42 Fuel Cell: Market Volume, By Types,2011 � 2018 (Unit Shipments)
Table 43 North American Fuel Cell: Market Capacity, By Types,2011 � 2018 (MW)
Table 44 North American Fuel Cell: Market Revenue, By Types,2011 � 2018 ($Million)
Table 45 Proton Exchange Membrane (PEM) Fuel Cell: Market Volume, By Geography 2011 � 2018 (Units)
Table 46 Proton Exchange Membrane (PEM) Fuel Cell: Market Capacity, By Geography, 2011 � 2018 (MW)
Table 47 Proton Exchange Membrane (PEM) Fuel Cell: Market Revenue, By Geography 2011 � 2018 ($Million)
Table 48 Solid Oxide Fuel Cell (SOFC): Market Volume, By Geography, 2011 � 2018 (Unit Shipments)
Table 49 Solid Oxide Fuel Cell (SOFC): Market Capacity, By Geography, 2011 � 2018 (MW)
Table 50 Solid Oxide Fuel Cell (SOFC): Market Revenue, By Geography, 2011 � 2018 ($Million)
Table 51 Molten Carbonate Fuel Cell (MCFC): Market Volume, By Geography, 2011 � 2018 (Unit Shipments)
Table 52 Molten Carbonate Fuel Cell (MCFC): Market Capacity, By Geography, 2011 � 2018 (MW)
Table 53 Molten Carbonate Fuel Cell (MCFC): Market Revenue, By Region, 2011 � 2018 ($Million)
Table 54 Phosphoric Acid Fuel Cell (PAFC): Market Volume, By Geography, 2011 � 2018 (Unit Shipments)
Table 55 Phosphoric Acid Fuel Cell (PAFC) Market Capacity, By Geography 2011 � 2018 (MW)
Table 56 Phosphoric Acid Fuel Cell (PAFC): Market Revenues, By Geography 2011 � 2018 ($Million)
Table 57 Direct Methanol Fuel Cell (DMFC): Market Volume, By Geography 2011 � 2018 (Units)
Table 58 Direct Methanol Fuel Cell (DMFC): Market Capacity, By Geography 2011 � 2018 (MW)
Table 59 Direct Methanol Fuel Cell (DMFC): Market Revenues, By Geography 2011 � 2018 ($Million)
Table 60 Fuel Cell: Market Revenue, By Fuels, 2011 � 2018 ($Million)
Table 61 Hydrogen Fuel Cell: Market Volume, By Geography, 2011 � 2018 (Unit Shipments)
Table 62 Hydrogen Fuel Cell: Market Capacity, By Geography, 2011 � 2018 (MW)
Table 63 Hydrogen Fuel Cell: Market Revenue, By Geography, 2011 � 2018 ($Million)
Table 64 Natural Gas Fuel Cell: Market Volume, By Geography, 2011 � 2018 (Unit Shipments)
Table 65 Natural Gas Fuel Cell: Market Capacity, By Geography, 2011 � 2018 (MW)
Table 66 North American Natural Gas Fuel Cell: Market Revenue, By Geography, 2011 � 2018 ($Million)
Table 67 Methanol Fuel Cell: Market Volume, By Geography, 2011 � 2018 (Units)
Table 68 Methanol Fuel Cell: Market Capacity, By Geography, 2011 � 2018 (MW)
Table 69 Methanol Fuel Cell: Market Revenues, By Geography, 2011 � 2018 ($Million)
Table 70 Anaerobic Digester Gas Fuel Cell: Market Volume, By Geography, 2011 � 2018 (Units)
Table 71 Anaerobic Digester Gas Fuel Cell: Market Capacity, By Geography, 2011 � 2018 (MW)
Table 72 North American Anaerobic Digester Gas Fuel Cell: Market Revenues, By Regions, 2011 � 2018 ($Million)
Table 73 Agreements, Collaborations & Partnerships, 2010 � 2013
Table 74 New Products Launch, 2010 � 2013
Table 75 Investments, Expansion & Other Developments, 2010 � 2013
Table 76 Mergers & Acquisitions, 2010 � 2013
Table 77 Ballard: Financial Report, 2010 � 2011 ($Million)
Table 78 Ballard: Products & Its Applications
Table 79 Bloom Energy: Products & Its Applications
Table 80 Clearedge: Products & Its Applications
Table 81 Fuelcell: Annual Revenue, 2010 � 2012 ($Million)
Table 82 Fuelcell: Products & Its Applications
Table 83 Hydrogenics: Annual Revenue, By Segments, 2010 � 2012 ($Million)
Table 84 Hydrogenics: Annual Revenue, By Geography, 2010 � 2012 ($Million)
Table 85 Hydrogenics: Products & Its Applications
Table 86 Nuvera: Products & Its Applications
Table 87 Plug Power: Annual Revenue, 2011 � 2012 ($Million)
Table 88 Plug Power: Products & Its Applications
Table 89 Protonex: Products & Its Applications
Table 90 Relion: Products & Its Applications
List Of Figures (24 Figures)
Figure 1 Fuel Cell: Regional Market Scenario, 2012 � 2018 ($Million)
Figure 2 Fuel Cells: Regional Market, By Capacity, 2012 � 2018
Figure 3 North America: Market Volume, 2013 � 2018
Figure 4 North American Market Dynamics, By Types
Figure 5 Fuel Cell: Applications, By Countries
Figure 6 Fuel Cell: Market Share, By Revenue & Types, 2013 � 2018
Figure 7 Fuel Cell Market, By Fuels, 2013 � 2018
Figure 8 R&D Expenditure, By North American Govt. Organisations, 1995 � 2012 ($Million)
Figure 9 R&D Expenditure, By North American Private Sectors, 2012 ($Million)
Figure 10 R&D Expenditure, By Companies, 2011 � 2012 ($Million)
Figure 11 Value Chain For Fuel Cell Industry
Figure 12 Porter�s Five Forces Analysis
Figure 13 Fuel Cells: Number Of Patents Registered In North America, 2011 � 2013
Figure 14 Stationary Fuel Cells: Market Share, By Countries, 2011 � 2018
Figure 15 Transportation Fuel Cells: Market Share, By Countries, 2011 � 2018
Figure 16 Portable Fuel Cell: Market Share, By Countries, 2011 � 2018
Figure 17 Fuel Cell: Shift In Market Share, By Types, 2012 � 2018
Figure 18 Fuel Cell: Shift In Market Share, By Types, 2011 � 2018
Figure 19 Fuel Cell Market: Growth Strategies, 2010 � 2013
Figure 20 Fuel Cell Market: Most Active Companies, 2011 � 2013
Figure 21 Agreements, Collaborations & Partnerships, 2010 � 2013
Figure 22 New Products Launch, 2010 � 2013
Figure 23 Investments, Expansion & Other Developments, 2010 � 2013
Figure 24 Mergers & Acquisitions, 2010 � 2013


Growth opportunities and latent adjacency in North America Fuel Cell Technology Market