Distributed Temperature Sensing Market Size, Share & Industry Growth Analysis Report by Operating Principle (OTDR, OFDR), Fiber Type (Single-mode Fibers, Multimode Fibers), Scattering Method (Rayleigh Effect, Raman Effect, Brillouin Effect), Application, and Geography - Global Forecast to 2035


Distributed Temperature Sensing Market Summary
The Distributed Temperature Sensing Market is experiencing robust growth driven by increasing demand for real-time monitoring solutions across industries such as oil & gas, energy, and infrastructure. The market size in 2024 is estimated to be in the range of USD 0.7–0.9 billion, and it is projected to reach approximately USD 1.8–2.2 billion by 2035, expanding at a compound annual growth rate (CAGR) of 8%–10% during 2025–2035. Growth is largely fueled by the rapid integration of Artificial Intelligence (AI), Internet of Things (IoT), and industrial automation, enabling predictive maintenance and enhanced operational efficiency. Additionally, digital transformation initiatives and the increasing need for safety monitoring in critical infrastructure are accelerating market adoption globally.
Key Market Trends & Insights
The Distributed Temperature Sensing Market is characterized by strong regional and technological trends shaping its trajectory. North America continues to lead due to its mature energy and industrial sectors, while Asia Pacific is emerging as the fastest-growing region due to rapid industrialization and infrastructure development. Fiber optic-based sensing systems dominate the product segment owing to their high accuracy and reliability. AI-powered analytics and cloud-based monitoring platforms are transforming the industry, enabling real-time decision-making and predictive insights. Automation in industrial environments is also increasing the demand for DTS solutions, particularly in smart factories and energy grids.
Market Size & Forecast
- Base Year Market Size (2024): USD 0.7–0.9 billion
- Forecast Value by 2035: USD 1.8–2.2 billion
- CAGR (2025–2035): 8%–10%
Growth Factors: Rising adoption of IoT-enabled monitoring systems, increasing investments in smart infrastructure, and growing emphasis on safety and efficiency in industrial operations are driving market expansion.
Distributed Temperature Sensing Market Top 10 key takeaway
- The market is projected to more than double by 2035.
- Fiber optic sensing remains the dominant technology.
- Oil & gas sector continues to be the largest application segment.
- AI-driven predictive maintenance is a key growth driver.
- Asia Pacific is the fastest-growing regional market.
- Integration with IoT platforms enhances real-time monitoring capabilities.
- Increasing focus on infrastructure safety boosts demand.
- Automation in manufacturing is expanding application scope.
- Cloud-based analytics platforms are gaining traction.
- Strategic partnerships and innovation are shaping competitive dynamics.
Product Insights
The fiber optic Distributed Temperature Sensing systems segment dominates the market due to its superior performance, high sensitivity, and ability to monitor long distances with precision. These systems are widely used in industries such as oil & gas pipelines, power cables, and environmental monitoring. Their resilience in harsh environments and capability to provide continuous real-time data make them indispensable for critical operations.
Emerging product categories include hybrid sensing systems that combine temperature and strain sensing, offering multi-parameter monitoring capabilities. The integration of AI into DTS products is enhancing their functionality by enabling anomaly detection, predictive maintenance, and automated alerts. Companies are also focusing on miniaturization and improved durability to expand applications across new sectors such as smart cities and renewable energy.
Technology / Component Insights
The Distributed Temperature Sensing Market is heavily influenced by advancements in fiber optic technologies such as Raman scattering, Brillouin scattering, and Rayleigh scattering. These technologies form the backbone of DTS systems, enabling accurate temperature measurement over long distances.
AI and machine learning are playing a transformative role by enabling advanced data analytics and predictive capabilities. IoT integration allows DTS systems to connect seamlessly with industrial networks, facilitating real-time monitoring and control. Cloud computing further enhances scalability and accessibility, enabling remote monitoring and centralized data management.
Automation technologies are also driving adoption, particularly in industrial environments where continuous monitoring is essential. Future innovations are expected to focus on improving sensor accuracy, reducing costs, and enhancing interoperability with other smart systems.
Application Insights
The oil & gas sector remains the leading application segment for Distributed Temperature Sensing systems, driven by the need for pipeline monitoring, leak detection, and wellbore temperature profiling. The ability of DTS systems to operate in extreme conditions makes them ideal for upstream and downstream operations.
Power and utility applications are also witnessing significant growth, particularly in monitoring underground and submarine cables to prevent overheating and failures. Infrastructure applications, including tunnels, bridges, and railways, are emerging as key growth areas due to increasing investments in smart infrastructure.
Future opportunities lie in renewable energy, where DTS systems can be used to monitor wind turbines and solar installations. The growing emphasis on sustainability and energy efficiency is expected to further drive adoption across various industries.
Regional Insights
North America holds the largest share of the Distributed Temperature Sensing Market, supported by strong demand from the oil & gas and energy sectors, along with advanced technological infrastructure. Europe follows closely, driven by stringent safety regulations and increasing investments in renewable energy projects.
Asia Pacific is the fastest-growing region, fueled by rapid industrialization, urbanization, and infrastructure development in countries such as China and India. Government initiatives promoting smart cities and digital transformation are further accelerating market growth in this region.
- North America dominates due to established industrial base
- Europe benefits from regulatory support and sustainability focus
- Asia Pacific shows fastest growth due to infrastructure expansion
- Middle East driven by oil & gas investments
- Latin America witnessing gradual adoption
Country-Specific Market Trends
In Asia Pacific, China is leading the adoption of DTS systems due to large-scale infrastructure projects and energy demand, while Japan is focusing on advanced technology integration, growing at a CAGR of 9%–11%. In North America, the United States remains the dominant market with strong investments in oil & gas and smart grid technologies, while Canada and Mexico are witnessing steady growth at 7%–9% CAGR.
In Europe, Germany and France are key contributors, driven by industrial automation and renewable energy initiatives, with growth rates ranging from 8%–10% CAGR. Government policies supporting digitalization and energy efficiency are playing a crucial role in driving adoption across these regions.
- China leads APAC due to infrastructure investments
- Japan focuses on advanced sensing technologies
- United States dominates North America market
- Germany drives European industrial adoption
- France supports growth through renewable energy projects
Key Distributed Temperature Sensing Market Company Insights
The competitive landscape of the Distributed Temperature Sensing Market is characterized by innovation, strategic partnerships, and technological advancements. Major players are focusing on integrating AI and IoT capabilities into their products to enhance performance and expand application areas.
Companies such as Halliburton, Schlumberger, Baker Hughes, Yokogawa Electric Corporation, and AP Sensing GmbH are leading the market with strong product portfolios and global presence. These companies are investing heavily in research and development to introduce advanced sensing solutions and maintain a competitive edge.
Strategic collaborations with technology providers and end-users are also common, enabling companies to develop customized solutions and expand their market reach. The focus on sustainability and energy efficiency is further driving innovation in the industry.
- Companies prioritize AI-driven analytics integration
- Strong focus on R&D and product innovation
- Strategic partnerships enhance market reach
- Expansion into emerging markets is a key strategy
- Emphasis on sustainability and efficiency
Recent Developments
Recent developments in the Distributed Temperature Sensing Market highlight the increasing focus on innovation and collaboration. Several companies have launched advanced DTS systems with enhanced AI capabilities for predictive maintenance and real-time analytics.
Partnerships between technology providers and energy companies are becoming more common, aimed at developing integrated monitoring solutions. Additionally, there has been a rise in investments in cloud-based DTS platforms, enabling remote monitoring and improved data accessibility.
Market Segmentation
The Distributed Temperature Sensing Market is segmented based on product, technology, application, and region. By product, fiber optic sensing systems dominate, while hybrid systems are emerging. In terms of technology, Raman and Brillouin scattering technologies are widely used. Applications include oil & gas, power & utilities, infrastructure, and environmental monitoring. Regionally, North America leads, followed by Europe and Asia Pacific.
- Fiber optic systems dominate product segment
- Raman scattering is widely used technology
- Oil & gas is leading application segment
- Power & utilities show strong growth potential
- Asia Pacific is fastest-growing region
Conclusion
The Distributed Temperature Sensing Market is poised for significant growth through 2035, driven by advancements in AI, IoT, and automation technologies. As industries increasingly adopt digital transformation strategies, the demand for real-time monitoring and predictive analytics solutions is expected to rise. The integration of DTS systems with smart infrastructure and renewable energy projects will further enhance their importance in the global market. Businesses that invest in innovation and strategic partnerships will be well-positioned to capitalize on emerging opportunities and maintain a competitive advantage.
FAQs
1. What is the current market size of the Distributed Temperature Sensing Market?
The market size is estimated to be around USD 0.7–0.9 billion in 2024.
2. What is the expected growth rate of the market?
The market is expected to grow at a CAGR of 8%–10% from 2025 to 2035.
3. What are the key drivers of market growth?
Key drivers include AI integration, IoT adoption, automation, and increasing demand for real-time monitoring.
4. Which region leads the market?
North America currently leads the Distributed Temperature Sensing Market.
5. Who are the major players in the market?
Key companies include Halliburton, Schlumberger, Baker Hughes, Yokogawa Electric Corporation, and AP Sensing GmbH.
 Exclusive indicates content/data unique to MarketsandMarkets and not available with any competitors.
Table of Contents
1 Introduction (Page No. - 17)
1.1 Study Objectives
1.2 Market Definition and Scope
1.3 Study Scope
1.3.1 Market Covered
1.3.2 Geographic Scope
1.3.3 Years Considered
1.4 Currency
1.5 Limitations
1.6 Stakeholders
2 Research Methodology (Page No. - 21)
2.1 Research Data
2.1.1 Secondary Data
2.1.1.1 Major Secondary Sources
2.1.1.2 Secondary Sources
2.1.2 Primary Data
2.1.2.1 Primary Interviews With Experts
2.1.2.2 Key Data From Primary Sources
2.1.2.3 Key Industry Insights
2.1.2.4 Breakdown of Primaries
2.1.3 Secondary and Primary Research
2.2 Market Size Estimation
2.2.1 Bottom-Up Approach
2.2.1.1 Approach for Capturing Market Share By Bottom-Up Approach (Demand Side)
2.2.2 Top-Down Approach
2.2.2.1 Approach for Capturing Market Share By Top-Down Approach (Supply Side)
2.3 Market Breakdown and Data Triangulation
2.4 Research Assumptions
3 Executive Summary (Page No. - 30)
4 Premium Insights (Page No. - 34)
4.1 Attractive Opportunities in Distributed Temperature Sensing Market
4.2 Market, By Scattering Method
4.3 Market, By Application
4.4 Market in North America, By Application and Country
4.5 Market, By Country
5 Market Overview (Page No. - 37)
5.1 Introduction
5.2 Market Dynamics
5.2.1 Drivers
5.2.1.1 Increasing Demand for Labor Safety at Working Sites
5.2.1.2 Reliability of DTS Systems/Sensors for Sensing and Monitoring Applications in Harsh Environments
5.2.1.3 Increasing Applications in the Oil & Gas Industry
5.2.2 Restraints
5.2.2.1 Optical Cables are Prone to Physical Damage
5.2.3 Opportunities
5.2.3.1 Increasing Safety Norms and Supportive Government Policies Related to Leakage Detection
5.2.3.2 Increasing Adoption of Data-Based Analytics
5.2.4 Challenges
5.2.4.1 High Costs Associated With DTS Systems
5.3 Value Chain Analysis
5.4 Porter’s Five Forces Analysis
5.4.1 Threat of New Entrants
5.4.2 Threat of Substitutes
5.4.3 Bargaining Power of Suppliers
5.4.4 Bargaining Power of Buyers
5.4.5 Intensity of Competitive Rivalry
6 Distributed Temperature Sensing Market, By Operating Principle (Page No. - 49)
6.1 Introduction
6.2 Optical Time Domain Reflectometry (OTDR)
6.2.1 OTDR Principle Held Larger Market Share in 2019
6.3 Optical Frequency Domain Reflectometry (OFDR)
6.3.1 OFDR Principle to Hold Smaller Market Size During Forecast Period Due to Limited Characteristics of OFDR-Based DTS Systems
7 Distributed Temperature Sensing Market, By Fiber Type (Page No. - 53)
7.1 Introduction
7.2 Single-Mode Fiber
7.2.1 Single-Mode Fiber Held Smaller Size of DTS Market in 2019
7.3 Multimode Fiber
7.3.1 Multimode Fiber-Based DTS Systems are Used in Applications That Demand Shorter Distance Coverage
8 Distributed Temperature Sensing Market, By Scattering Method (Page No. - 57)
8.1 Introduction
8.2 Rayleigh Scattering Effect
8.2.1 Rayleigh Scattering Effect to Witness Highest Growth Rate During Forecast Period
8.3 Raman Scattering Effect
8.3.1 Raman Scattering Effect is Witnessing Increasing Demand for use in DTS Systems for Safety and Security Applications
8.4 Brillouin Scattering Effect
8.4.1 Increasing use in Downhole Oil Monitoring Would Drive Market for Brillouin Scattering During Forecast Period
9 Distributed Temperature Sensing Market, By Application (Page No. - 60)
9.1 Introduction
9.2 Oil & Gas
9.2.1 Upstream
9.2.1.1 Downhole Monitoring
9.2.1.1.1 Rising Demand for Downhole Monitoring in Oil & Gas Plants to Propel Growth of Market for Oil & Gas Application
9.2.1.2 Slickline and Wireline Interventions Monitoring
9.2.1.2.1 High Implementation of DTS Systems for Wellbore Monitoring in Oil and Gas Plants
9.2.2 Downstream
9.3 Power Cable Monitoring
9.3.1 DTS Sensors are Used for Detecting Hotspots in Power Cables to Prevent Untoward Incidents
9.4 Fire Detection
9.4.1 Industrial Conveyors Monitoring
9.4.1.1 Monitoring Heat Detection Through DTS Systems Propel Its Demand in Industrial Conveyors Monitoring
9.4.2 Special Hazard Environments Fire Monitoring
9.4.2.1 Increasing Awareness Regarding Fire Protection in Hazardous Environments to Drive DTS Market Growth for Fire Detection Application
9.5 Process & Pipeline Monitoring
9.5.1 Leakage Detection
9.5.1.1 DTS Market for Leakage Detection Application to Witness Steady Growth During Forecast Period
9.6 Environmental Monitoring
9.6.1 Growing Focus on Ecological and Sewer Monitoring to Propel use of DTS Systems
10 Geographic Analysis (Page No. - 78)
10.1 Introduction
10.2 North America
10.2.1 US
10.2.1.1 US to Remain Largest Market for DTS in North America During Forecast Period
10.2.2 Canada
10.2.2.1 Extensive Oil Production Activities Fuel Demand for DTS Systems in Canada
10.2.3 Mexico
10.2.3.1 Growing Need for Fire Detection in Warehouses in Mexico Drives Demand for DTS Systems
10.3 Europe
10.3.1 UK
10.3.1.1 Increasing Need for Fire Protection Measures in Infrastructures to Drive DTS Market in UK
10.3.2 Germany
10.3.2.1 DTS Market in Germany Expected to Witness Highest Growth Among All European Countries During Forecast Period
10.3.3 France
10.3.3.1 Growth of DTS Market in France Primarily Depends on Power Cable Monitoring and Fire Detection Applications
10.3.4 Russia
10.3.4.1 Russia Expected to Lead European DTS Market During Forecast Period
10.3.5 Rest of Europe
10.4 APAC
10.4.1 China
10.4.1.1 China Held Largest Share of DTS Market in APAC in 2019
10.4.2 Japan
10.4.2.1 Growing Need for Power Cable Monitoring to Boost DTS Market in Japan
10.4.3 India
10.4.3.1 Strong Oil & Gas Sector and Rapid Expansion of Power Transmission Network Drive DTS Market in India
10.4.4 South Korea
10.4.4.1 Need to Comply With Fire Safety Norms DTS Market in South Korea
10.4.5 Rest of APAC
10.5 RoW
10.5.1 Middle East
10.5.1.1 Middle East Expected to Lead RoW DTS Market Throughout Forecast Period
10.5.2 Africa
10.5.2.1 Government Initiatives to Enhance Industrial Sector are Likely to Drive DTS Market in Africa
10.6 South America
10.6.1 Brazil
10.6.1.1 Brazil Expected to Register Highest Growth Rate in South America During Forecast Period
10.6.2 Argentina
10.6.2.1 Economic and Regulatory Changes in Energy & Power Sector Will Boost DTS Market in Argentina
10.6.3 Venezuela
10.6.3.1 DTS Systems are Used for Safe Production and Transportation of Petrochemical Products in Venezuela
10.6.4 Rest of South America
11 Competitive Landscape (Page No. - 103)
11.1 Introduction
11.2 Market Player Ranking Analysis
11.3 Competitive Leadership Mapping
11.3.1 Visionary Leaders
11.3.2 Innovators
11.3.3 Dynamic Differentiators
11.3.4 Emerging Companies
11.4 Strength of Product Portfolio (25 Companies)
11.5 Business Strategy Excellence (25 Companies)
11.6 Competitive Scenario
11.7 Competitive Situations & Trends
11.7.1 Contracts/Collaborations/Agreements/Joint Ventures/Partnerships
11.7.2 Product Launches
11.7.3 Acquisitions
11.7.4 Expansions
12 Company Profiles (Page No. - 117)
12.1 Key Players
12.1.1 Schlumberger Limited
12.1.1.1 Business Overview
12.1.1.2 Products Offered
12.1.1.3 Recent Developments
12.1.1.4 SWOT Analysis
12.1.1.5 MnM View
12.1.2 Halliburton Company
12.1.2.1 Business Overview
12.1.2.2 Products Offered
12.1.2.3 Recent Developments
12.1.2.4 SWOT Analysis
12.1.2.5 MnM View
12.1.3 Yokogawa Electric Corporation
12.1.3.1 Business Overview
12.1.3.2 Products Offered
12.1.3.3 Recent Developments
12.1.3.4 SWOT Analysis
12.1.3.5 MnM View
12.1.4 Weatherford International PLC
12.1.4.1 Business Overview
12.1.4.2 Products Offered
12.1.4.3 Recent Developments
12.1.4.4 SWOT Analysis
12.1.4.5 MnM View
12.1.5 Sumitomo Electric Industries, Ltd.
12.1.5.1 Business Overview
12.1.5.2 Products Offered
12.1.5.3 Recent Developments
12.1.5.4 SWOT Analysis
12.1.5.5 MnM View
12.1.6 OFS Fitel, LLC
12.1.6.1 Business Overview
12.1.6.2 Products Offered
12.1.7 AP Sensing GmbH
12.1.7.1 Business Overview
12.1.7.2 Products Offered
12.1.7.3 Recent Developments
12.1.8 Bandweaver Technologies
12.1.8.1 Business Overview
12.1.8.2 Products Offered
12.1.8.3 Recent Developments
12.1.9 GESO GmbH & Co.
12.1.9.1 Business Overview
12.1.9.2 Products Offered
12.1.10 NKT Photonics
12.1.10.1 Business Overview
12.1.10.2 Products Offered
12.1.10.3 Recent Developments
12.2 Other Companies
12.2.1 Omicron Electronics GmbH
12.2.2 AFL
12.2.3 Micron Optics, Inc.
12.2.4 Avencom
12.2.5 Sensornet Limited
12.2.6 Omnisens SA
12.2.7 Optromix, Inc.
12.2.8 Ziebel As
12.2.9 Silixa Ltd.
12.2.10 Tendeka
13 Appendix (Page No. - 148)
13.1 Discussion Guide
13.2 Knowledge Store: Marketsandmarkets’ Subscription Portal
13.3 Available Customizations
13.4 Related Reports
13.5 Author Details
List of Tables (78 Tables)
Table 1 Porter’s Five Forces Analysis (2019): Bargaining Power of Suppliers Had a High Impact on Distributed Temperature Sensing Market
Table 2 DTS Market, By Operating Principle, 2017–2025 (USD Million)
Table 3 DTS Market for OTDR-Based Systems, By Application, 2017–2025 (USD Million)
Table 4 DTS Market for OFDR-Based Systems, By Application, 2017–2025 (USD Million)
Table 5 Distributed Temperature Sensing Market, By Fiber Type, 2017–2025 (USD Million)
Table 6 Market for Single-Mode Fiber, By Application, 2017–2025 (USD Million)
Table 7 Market for Multimode Fiber, By Application, 2017–2025 (USD Million)
Table 8 Market, By Scattering Method, 2017–2025 (USD Million)
Table 9 Market, By Application, 2017–2025 (USD Million)
Table 10 Market for Oil & Gas, By Fiber Type, 2017–2025 (USD Million)
Table 11 Market for Oil & Gas, By Operating Principle, 2017–2025 (USD Million)
Table 12 Market for Oil & Gas, By Region, 2017–2025 (USD Million)
Table 13 Market for Oil & Gas in North America, By Country, 2017–2025 (USD Million)
Table 14 Market for Oil & Gas in Europe, By Country, 2017–2025 (USD Thousand)
Table 15 Market for Oil & Gas in APAC, By Country, 2017–2025 (USD Million)
Table 16 Market for Oil & Gas in RoW, By Region, 2017–2025 (USD Million)
Table 17 Market for Power Cable Monitoring, By Fiber Type, 2017–2025 (USD Million)
Table 18 Market for Power Cable Monitoring, By Operating Principle, 2017–2025 (USD Million)
Table 19 Market for Power Cable Monitoring, By Region, 2017–2025 (USD Million)
Table 20 Market for Power Cable Monitoring in North America, By Country, 2017–2025 (USD Million)
Table 21 Market for Power Cable Monitoring in Europe, By Country, 2017–2025 (USD Million)
Table 22 Market for Power Cable Monitoring in APAC, By Country, 2017–2025 (USD Million)
Table 23 Market for Power Cable Monitoring in RoW, By Region, 2017–2025 (USD Million)
Table 24 Market for Fire Detection, By Fiber Type, 2017–2025 (USD Million)
Table 25 Market for Fire Detection, By Operating Principle, 2017–2025 (USD Million)
Table 26 Market for Fire Detection, By Region, 2017–2025 (USD Million)
Table 27 Market for Fire Detection in North America, By Country, 2017–2025 (USD Million)
Table 28 Market for Fire Detection in Europe, By Country, 2017–2025 (USD Million)
Table 29 Market for Fire Detection in APAC, By Country, 2017–2025 (USD Million)
Table 30 Market for Fire Detection in RoW, By Region, 2017–2025 (USD Thousand)
Table 31 Distributed Temperature Sensing Market for Process & Pipeline Monitoring, By Fiber Type, 2017–2025 (USD Million)
Table 32 Market for Process & Pipeline Monitoring, By Operating Principle, 2017–2025 (USD Million)
Table 33 Market for Process & Pipeline Monitoring, By Region, 2017–2025 (USD Million)
Table 34 Market for Process & Pipeline Monitoring in North America, By Country, 2017–2025 (USD Million)
Table 35 Market for Process & Pipeline Monitoring in Europe, By Country, 2017–2025 (USD Thousand)
Table 36 Market for Process & Pipeline Monitoring in APAC, By Country, 2017–2025 (USD Million)
Table 37 Market for Process & Pipeline Monitoring in RoW, By Region, 2017–2025 (USD Million)
Table 38 Market for Environmental Monitoring, By Fiber Type, 2017–2025 (USD Million)
Table 39 Market for Environmental Monitoring, By Operating Principle, 2017–2025 (USD Million)
Table 40 Market for Environmental Monitoring, By Region, 2017–2025 (USD Million)
Table 41 Market for Environmental Monitoring in North America, By Country, 2017–2025 (USD Thousand)
Table 42 Market for Environmental Monitoring in Europe, By Country, 2017–2025 (USD Thousand)
Table 43 Market for Environmental Monitoring in APAC, By Country, 2017–2025 (USD Thousand)
Table 44 Market for Environmental Monitoring in RoW, By Region, 2017–2025 (USD Thousand)
Table 45 Market, By Region, 2017–2025 (USD Million)
Table 46 Market in North America, By Application, 2017–2025 (USD Million)
Table 47 Market in North America, By Country, 2017–2025 (USD Million)
Table 48 Market in US, By Application, 2017–2025 (USD Million)
Table 49 Market in Canada, By Application, 2017–2025 (USD Million)
Table 50 Market in Mexico, By Application, 2017–2025 (USD Thousand)
Table 51 Market in Europe, By Application, 2017–2025 (USD Million)
Table 52 Market in Europe, By Country, 2017–2025 (USD Million)
Table 53 Market in UK, By Application, 2017–2025 (USD Thousand)
Table 54 Market in Germany, By Application, 2017–2025 (USD Thousand)
Table 55 Market in France, By Application, 2017–2025 (USD Thousand)
Table 56 Market in Russia, By Application, 2017–2025 (USD Million)
Table 57 Market in Rest of Europe, By Application, 2017–2025 (USD Million)
Table 58 Distributed Temperature Sensing Market in APAC, By Application, 2017–2025 (USD Million)
Table 59 Market in APAC, By Country, 2017–2025 (USD Million)
Table 60 Market in China, By Application, 2017–2025 (USD Million)
Table 61 Market in Japan, By Application, 2017–2025 (USD Thousand)
Table 62 Market in India, By Application, 2017–2025 (USD Million)
Table 63 Market in South Korea, By Application, 2017–2025 (USD Million)
Table 64 Sensing Market in Rest of APAC, By Application, 2017–2025 (USD Million)
Table 65 Market in RoW, By Application, 2017–2025 (USD Million)
Table 66 Sensing Market in RoW, By Region, 2017–2025 (USD Million)
Table 67 Market in Middle East, By Application, 2017–2025 (USD Million)
Table 68 Market in Africa, By Application, 2017–2025 (USD Million)
Table 69 Market in South America, By Application, 2017–2025 (USD Thousand)
Table 70 Market in South America, By Country, 2017–2025 (USD Million)
Table 71 Market in Brazil, By Application, 2017–2025 (USD Thousand)
Table 72 Market in Argentina, By Application, 2017–2025 (USD Thousand)
Table 73 Market in Venezuela, By Application, 2017–2025 (USD Thousand)
Table 74 Market in Rest of South America, By Application, 2017–2025 (USD Thousand)
Table 75 Contracts/Collaborations/Agreements/Joint Ventures/Partnerships (2017–2020)
Table 76 Product Launches (2017–2020)
Table 77 Acquisitions (2017–2020)
Table 78 Expansions (2017–2020)
List of Figures (48 Figures)
Figure 1 Distributed Temperature Sensing (DTS) Market Segmentation
Figure 2 Distributed Temperature Sensing Market: Research Design
Figure 3 Market Size Estimation Methodology: Bottom-Up Approach
Figure 4 Market Size Estimation Methodology: Top-Down Approach
Figure 5 Data Triangulation
Figure 6 Assumption for the Study
Figure 7 Distributed Temperature Sensing Market, 2017–2025 (USD Million)
Figure 8 Market, By Fiber Type (2020 Vs. 2025)
Figure 9 OTDR to Hold Largest Share of Market, By Operating Principle, in 2020
Figure 10 Market for Fire Detection to Grow at Highest CAGR From 2020 to 2025
Figure 11 Middle East & Africa to Hold Largest Share of Market in 2020
Figure 12 Increasing Applications in the Oil & Gas Industry to Boost DTS Market During Forecast Period
Figure 13 Market for Rayleigh Scattering Effect to Grow at Highest CAGR From 2020 to 2025
Figure 14 Oil & Gas to Hold Largest Size of Market Through to 2025
Figure 15 Oil & Gas and US Were Largest Shareholders of DTS Market in North America in 2019
Figure 16 Market in India to Grow at Highest CAGR From 2020 to 2025
Figure 17 Impact of Drivers and Opportunities on Market
Figure 18 Impact of Challenges and Restraints on Market
Figure 19 Total Recorded Incidence Rate From 2015 to 2018
Figure 20 Major Value Added During Implementation and Installation Phase
Figure 21 Overview of Porter’s Five Forces Analysis of Distributed Temperature Sensing Market (2019)
Figure 22 Market: Porter’s Five Forces Analysis (2019)
Figure 23 Threat of New Entrants Had a Medium Impact in 2019
Figure 24 Threat of Substitutes Had a Low Impact in 2019
Figure 25 Bargaining Power of Suppliers Had a High Impact in 2019
Figure 26 Bargaining Power of Buyers Had a Medium Impact in 2019
Figure 27 Intensity of Competitive Rivalry Had a Medium Impact in 2019
Figure 28 OTDR DTS Market Expected to Grow at a Higher CAGR From 2020 to 2025
Figure 29 Multimode Fiber Type Expected to Grow at a Higher Rate Than Single-Mode Fiber Type During Forecast Period
Figure 30 Distributed Temperature Sensing Market for Rayleigh Scattering Effect to Grow at Highest CAGR From 2020 to 2025
Figure 31 Market for Fire Detection to Grow at Highest CAGR From 2020 to 2025
Figure 32 DTS Market for Oil & Gas to Grow at Highest CAGR in Middle East Among Regions in RoW
Figure 33 Market for Fire Detection Expected to Grow at Highest Rate in APAC During Forecast Period
Figure 34 Market for Environmental Monitoring Expected to Grow at Highest Rate in APAC During Forecast Period
Figure 35 Geographic Snapshot: DTS Market in APAC to Witness Highest Growth From 2020 to 2025
Figure 36 APAC to Lead Distributed Temperature Sensing Market During Forecast Period
Figure 37 North America: Market Snapshot
Figure 38 Europe: Market Snapshot
Figure 39 APAC: Market Snapshot
Figure 40 Companies Adopted Contracts/Collaborations/Agreements/ Joint Ventures/Partnerships as Key Growth Strategies During 2017–2020
Figure 41 Schlumberger Limited (US) Led DTS Market in 2019
Figure 42 DTS Market (Global) Competitive Leadership Mapping, 2019
Figure 43 Evaluation Framework: DTS Market
Figure 44 Schlumberger Limited: Company Snapshot
Figure 45 Halliburton Company: Company Snapshot
Figure 46 Yokogawa Electric Corporation: Company Snapshot
Figure 47 Weatherford International PLC: Company Snapshot
Figure 48 Sumitomo Electric Industries, Ltd.: Company Snapshot
The study involved four major activities in estimating the current size of the distributed temperature sensing market. Exhaustive secondary research has been done to collect information on the market, the peer markets, and the parent market. The next step has been to validate these findings, assumptions, and sizing with industry experts from across the value chain through primary research. Both top-down and bottom-up approaches have been employed to estimate the complete market size. After that, market breakdown and data triangulation methods have been used to estimate the market size of segments and subsegments.
Secondary Research
The research methodology used to estimate and forecast the distributed temperature sensing market begins with capturing data on the revenues of key vendors in the market through secondary research. This study involves the use of extensive secondary sources, directories, and databases such as Hoovers, Bloomberg Businessweek, Factiva, and OneSource to identify and collect information useful for the technical, market-oriented, and commercial study of the distributed temperature sensing market. Vendor offerings have also been taken into consideration to determine the market segmentation. This entire research methodology includes studying annual and financial reports of top players, presentations, press releases, journals, paid databases, trade directories, regulatory bodies, and safety standard organizations.
Primary Research
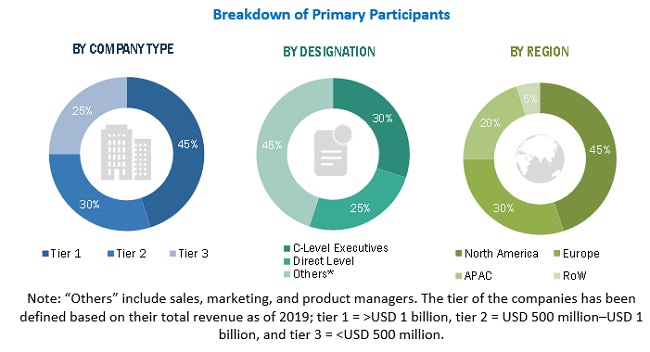
The distributed temperature sensing market’s supply chain comprises several stakeholders, such as suppliers of raw materials, original equipment manufacturers (OEMs), device manufacturers, and system integrators. The supply side is characterized by advancements in distributed temperature sensing solutions in diverse applications. Various primary sources from both the supply and demand sides of the market have been interviewed to obtain qualitative and quantitative information. The breakdown of primary respondents is as follows.
To know about the assumptions considered for the study, download the pdf brochure
Market Size Estimation
Both top-down and bottom-up approaches have been used to estimate and validate the size of the distributed temperature sensing market and its subsegments. The research methodology used to estimate the market sizes includes the following:
- Key players providing distributed temperature sensing solutions to different industries have been identified through extensive secondary research.
- The industry’s supply chain and market size, in terms of value, have been determined through primary and secondary research processes.
- All percentage shares, splits, and breakdowns have been determined using secondary sources and verified through primary sources.
Data Triangulation
After arriving at the overall market size—using the estimation processes as explained above—the market has been split into several segments and subsegments. To complete the overall market engineering process and arrive at the exact statistics of each market segment and subsegment, data triangulation and market breakdown procedures have been employed, wherever applicable. The data has been triangulated by studying various factors and trends from both the demand and supply sides of the distributed temperature sensing market.
Study Objectives
- To define, describe, and forecast the distributed temperature sensing (DTS) market segmented based on operating principle, fiber type, scattering method, application, and region, in terms of value
- To forecast the market size, in terms of value, for various segments with regard to four main regions: North America, Europe, Asia Pacific (APAC), and Rest of the World (RoW)
- To provide detailed information about the major factors influencing the growth of the DTS market (drivers, restraints, opportunities, and challenges)
- To analyze the micromarkets with respect to individual growth trends, prospects, and contributions to the total market
- To provide a detailed overview of the value chain of the DTS market and analyze the market trends with the help of Porter’s five forces analysis
- To analyze the opportunities in the market for various stakeholders by identifying the high-growth segments of the market
- To profile the key players and comprehensively analyze their market position in terms of the ranking and core competencies, along with detailing the competitive landscape of the market
- To analyze competitive developments such as partnerships and joint ventures, mergers and acquisitions, new product developments, expansions, and research and development (R&D) in the DTS market
Available Customizations
Along with the market data, MarketsandMarkets offers customizations according to a company’s specific needs. The following customization options are available for the report:
Company Information
- Detailed analysis and profiling of additional market players (Up to 5)
Critical Questions:
- What will be the new verticals in which distributed temperature sensing would be used?
- Who are the key players in the market, and how intense is the competition?


Growth opportunities and latent adjacency in Distributed Temperature Sensing Market
What are NEW applications for DTS rather than Oil/Gas/LNG, cables(subsea and underground) and environmental research? Which are the newest trends we can put our bets on? Does your scope include IoT or AI based sensing?
Distributed Temperature Sensing Market by Operating Principle (OTDR, OFDR), Fiber Type (Single-Mode, Multi-Mode), Application (Oil & Gas Production, Power Cable Monitoring, Fire Detection, Pipeline Leakage Detection) & Geography. Can you elaborate upon the operating principles and the scope of the same?
I am interested in when this report was prepared, and how markets are broken down geographically, e.g.. North America, Europe, Asia etc.? Also I could like to understand the future trends such as smart sensors, smart sensing devices, etc.
Which is the major application for DTS other than oil & gas? What are the latest trends in the market?
What the various sensing technologies that you have considered in your study?
Hi, I can see that you roll up by sector, and also roll up by geography. Does your report have a breakdown both by sector by geography or applications by region?