
Advanced Driver Assistance Systems Market Size, Share & Analysis

Advanced Driver Assistance Systems Market by Hardware Offering (Camera Units, LiDAR, Radar Sensors, Ultrasonic Sensors), Software Offering, System Type (ACC, AEB, LDW, IPA, BSD), Vehicle Class, Vehicle Type, EV Type, Level of Autonomy (L1, L2, L3, L4, L5), and Region - Global Forecast to 2032


OVERVIEW
Source: Secondary Research, Interviews with Experts, MarketsandMarkets Analysis
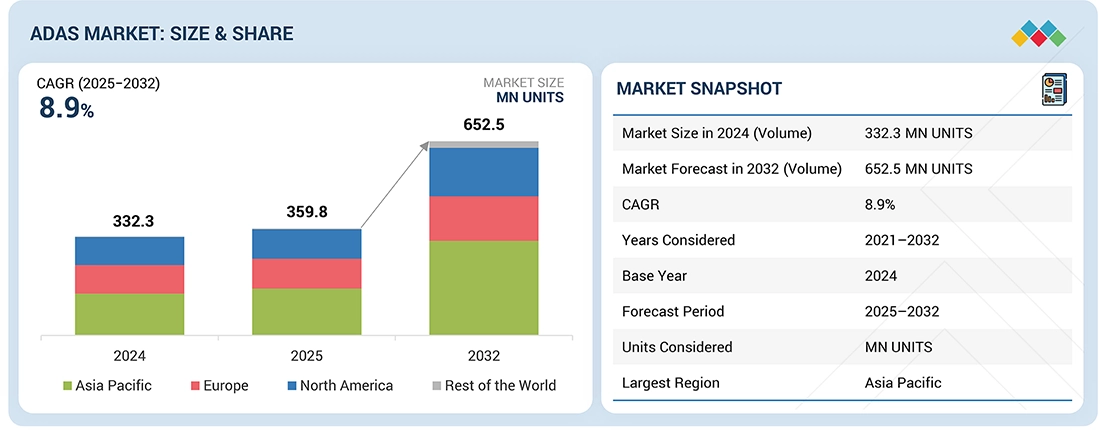
The ADAS market is expected to increase from 359.8 million units in 2025 to 652.5 million units by 2032, growing at a CAGR of 8.9%. Improvements in machine learning, AI algorithms, and sensor fusion have made ADAS software more advanced and affordable, reducing dependence on costly hardware like radar and lidar. Leading electric vehicle (EV) companies are switching to camera-based vision systems instead of relying solely on lidar. This shift from hardware to software-driven innovation in ADAS allows automakers to cut costs, enhance functionality, and offer more flexibility for future upgrades through over-the-air updates. By improving features like adaptive cruise control and emergency braking via over-the-air updates without additional hardware, software-driven ADAS solutions enhance sensor fusion and real-time data processing. This accelerates autonomous vehicle development, boosts safety and performance, and fuels the future growth of the automotive industry.
KEY TAKEAWAYS
-
BY VEHICLE TYPEThe ADAS market by vehicle type is divided into passenger cars, light commercial vehicles, and buses & trucks, with passenger cars holding a dominant share due to high consumer demand for safety and convenience features, increased adoption of luxury and tech-enabled vehicles, and growing integration of ADAS in mid- and high-end segments.
-
BY SYSTEM TYPEThe Lane Departure Warning (LDW) system segment is poised to lead the market. Its adoption is fueled by increasing highway traffic, stricter safety regulations, rising consumer demand for accident-prevention technologies, and OEMs incorporating advanced driver-assistance features to improve vehicle safety and qualify for insurance incentives. Well-maintained LDW systems can decrease lane departure crashes by 11% and injuries by 21% (IIHS).
-
BY LEVEL OF AUTONOMYMost passenger cars still depend on Level 1 or have no autonomous systems, while premium vehicles are adopting Level 2 and some luxury models are using Level 3, increasing demand for advanced ADAS features like lane keeping, adaptive cruise control, and emergency braking. Testing of Level 4 and Level 5 robotaxis shows technological progress, although regulatory, infrastructure, and traffic challenges restrict full autonomy.
-
BY HARDWARE OFFERINGOEMs are increasingly outfitting vehicles with ADAS hardware in response to rising traffic congestion, improved road infrastructure, and stricter government safety regulations. Progress in coherent LiDAR technology further enhances ADAS capabilities by allowing direct measurement of vehicle speed and better resistance to interference. These features are especially useful for ride-hailing and autonomous vehicles operating in busy urban settings.
-
BY REGIONAsia Pacific is expected to lead the ADAS market due to stricter road safety mandates, decreasing costs of basic systems, and increasing demand for premium, tech-equipped vehicles. Growing consumer preference for safety and convenience features, along with initiatives encouraging OEM participation and local technology adoption, further boost market growth.
ADAS feature adoption is becoming increasingly tiered across market segments. In cost-sensitive markets, adoption focuses on essential safety features such as AEB, FCW, and LDW/LKA. Mid-range and premium vehicles, however, increasingly deploy integrated feature packages combining ACC with Blind-Spot Detection, Cross-Traffic Alert, and other complementary systems, since bundled features provide improved functionality than stand-alone functions. OEMs and mobility fleets invest in advanced solutions such as Driver Monitoring Systems, Traffic-Jam Assist, and LiDAR-enabled urban autonomy.
TRENDS & DISRUPTIONS IMPACTING CUSTOMERS' CUSTOMERS
Trends and disruptions in the ADAS market reveal the current and future trends. As the market shifts from premium-only adoption to mainstream and mass-market integration, new revenue pockets are emerging in mid- and entry-level vehicles. Advancements in sensor fusion, AI, and software-driven features also open aftermarket, mobility-as-a-service, and data-driven service opportunities.
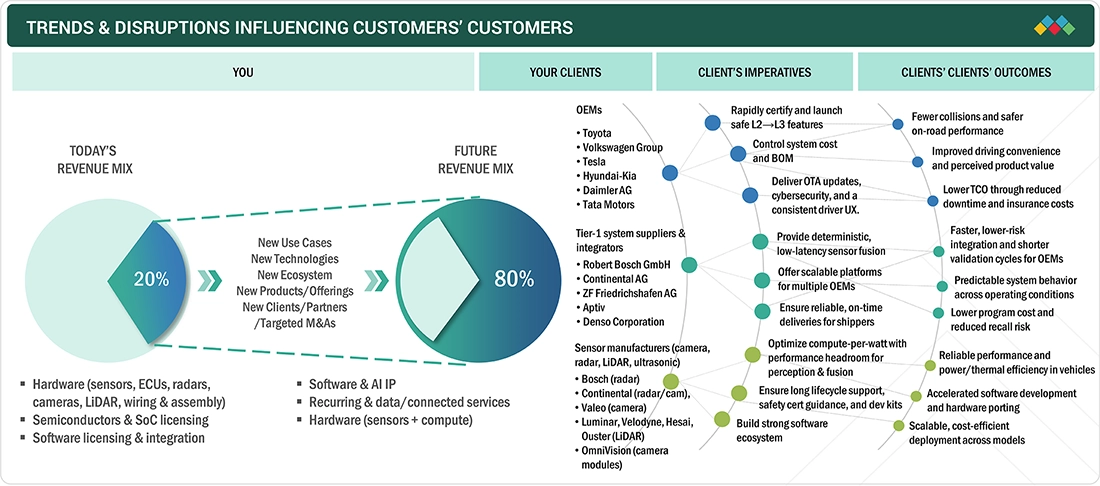
Source: Secondary Research, Interviews with Experts, MarketsandMarkets Analysis
MARKET DYNAMICS
Level
-
ADAS-driven comfort and safety enhancements

-
Government regulations and safety standards

Level
-
Lack of adequate infrastructure

-
Public reception of autonomous vehicles

Level
-
Advancements in autonomous vehicle technology

-
Future of autonomous ridesharing

Level
-
High cost of integration

-
Addressing reliability issues of sensors in ADAS

Source: Secondary Research, Interviews with Experts, MarketsandMarkets Analysis
Driver: ADAS-driven comfort and safety enhancements
Automakers are increasingly integrating ADAS features such as blind spot detection, lane keeping, and emergency braking to boost safety and convenience. Growing demand for systems such as adaptive cruise control, parking assist, and traffic-jam assist is driving broader adoption. These technologies help reduce accidents and enhance the overall driving experience.
Restraint: Lack of adequate infrastructure
ADAS effectiveness depends on supportive infrastructure, including well-marked roads, GPS, and reliable V2V/V2X connectivity. Limited network coverage, especially on highways and in emerging economies like India, Brazil, and Mexico, can restrict features such as real-time traffic updates and autonomous driving. Inconsistent infrastructure across regions poses integration challenges, affecting ADAS reliability, consumer adoption, and market growth.
Opportunity: Future of autonomous ridesharing
Autonomous vehicles, developed by companies such as Tesla, Waymo, Lyft, and WeRide, aim to reduce accidents and improve shared mobility. The rise of commercial autonomous ride-hailing and mobility-as-a-service models is driving ADAS adoption, offering automakers new revenue streams and transforming traditional vehicle ownership models.
Challenge: High cost of integration
ADAS systems use microcontrollers, ECUs, and sensors like radar, LiDAR, and cameras, with configurations and costs varying by vehicle segment. Features such as speed adjustment and driver alerts add complexity and cost, limiting availability in smaller vehicles. Growing demand for autonomy, regulatory compliance, and software-driven components drive innovation, while high costs push OEMs to offer efficient, competitively priced ADAS solutions.
Advanced Driver Assistance Systems Market: COMMERCIAL USE CASES ACROSS INDUSTRIES
| COMPANY | USE CASE DESCRIPTION | BENEFITS |
|---|---|---|
 |
DRIVE platform delivering high-performance SoCs and AI compute for perception & sensor fusion | High compute-per-watt for L2+ to L4 autonomy; flexible development for OEMs & Tier-1s |
 |
Advanced driver assistance solutions (ADAS ECUs, radar, camera, LiDAR integration) | Reliable safety performance; modular solutions adaptable to passenger and commercial vehicles |
 |
Provides ADAS vision-based SoCs and algorithms for OEMs (e.g., lane departure, pedestrian detection) | Scalable ADAS integration for multiple automakers; accelerated time-to-market |
 |
Radar and camera-based systems for AEB, lane assist, and adaptive cruise control | Proven safety technologies; compliance with global safety regulations |
 |
Snapdragon Ride platform for scalable ADAS and automated driving compute | Low-power, high-performance SoCs; cost-efficient deployment across vehicle segments |
Logos and trademarks shown above are the property of their respective owners. Their use here is for informational and illustrative purposes only.
MARKET ECOSYSTEM
The ADAS market ecosystem includes OEM, Tier 1 suppliers, autonomous vehicle developers, software and systems providers, processor (SoC) providers, and sensor providers. Some of the major system providers include Robert Bosch GmbH (Germany), Continental AG (Germany), Denso Corporation (Japan), ZF Friedrichshafen AG (Germany), and Magna International Inc. (Canada). Companies focus on developing advanced safety solutions, forming strategic partnerships with OEMs, and investing in sensor fusion, AI, and software platforms to strengthen their ADAS offerings and expand market presence.

Logos and trademarks shown above are the property of their respective owners. Their use here is for informational and illustrative purposes only.
MARKET SEGMENTS

Source: Secondary Research, Interviews with Experts, MarketsandMarkets Analysis
ADAS Market, By Vehicle Type
The passenger car is poised to lead the ADAS market, propelled by trends in autonomous driving and increasing demand for luxury vehicles. Premium models, like the 2025 Genesis G90, incorporate advanced features such as driver monitoring, smart parking, blind spot detection, and lane-keeping assist, fueling segment growth.
ADAS Market, By Electric Vehicle Type
The BEV is expected to dominate the market, fueled by government subsidies and rising EV adoption. ADAS features are easier to implement in electric vehicles compared to ICE vehicles because of their higher electronic content and centralized or zonal/domain ECU architectures, which make integration simpler. OEMs are including advanced ADAS functions like lane keeping, blind-spot warnings, adaptive cruise control, and automatic parking in new EV models to improve safety and convenience.
ADAS Market, By System Type
TPMS holds a significant share of the ADAS market, providing critical tire pressure information that affects safety and fuel efficiency. Underinflated tires cause thousands of accidents, hundreds of fatalities, and over a billion gallons of wasted fuel each year in the US. Increasing safety standards are encouraging OEMs to adopt TPMS, with Aptiv supplying Ford and Continental AG providing components for Hyundai's 2025 models.
ADAS Market, By Hardware Offering
Camera units hold a significant share of the ADAS market, powering applications such as adaptive cruise control, blind spot detection, and emergency braking. Advances in high-resolution and AI-enabled cameras, such as Bosch’s MPC3 multifunctional camera, improve object recognition and lane-keeping, fueling further growth in cameras.
ADAS Market, By Software Offering
ADAS software depends on real-time automotive operating systems like Linux, QNX, and Android to provide quick, safety-critical responses. Reliable application software guarantees dependability and responsiveness, creating the foundation for advanced vehicle features and a comprehensive user experience.
ADAS Market, By Level of Autonomy
The L3 autonomy is expected to experience the fastest growth, driven by decreasing ADAS costs and rapid technological advancements. Mercedes-Benz expanded its DRIVE PILOT in Germany to 95 km/h, while Stellantis launched STLA AutoDrive for low-speed traffic, highlighting the increasing adoption of “hands-free, eyes-off” systems.
ADAS Market, By Vehicle Class
Rising accidents and the emphasis on occupant safety are speeding up ADAS adoption, with features like automatic emergency braking and blind spot detection becoming standard. Rapid urbanization and smart city projects are also encouraging consumers to select safer vehicles, boosting the adoption of L2 and L3 systems across major markets..
REGION
Asia Pacific is projected to lead the ADAS market during the forecast period
The Asia Pacific ADAS market is expected to lead globally, driven by regulatory mandates, increasing vehicle demand, and technological advancements. Governments, such as India, are implementing safety features like advanced emergency braking and blind spot warnings starting in 2026. Large automotive markets like China and India, along with growing consumer safety awareness and declining sensor and software costs, are boosting ADAS adoption in both passenger and commercial vehicles.
Advanced Driver Assistance Systems Market: COMPANY EVALUATION MATRIX
In the ADAS market matrix, Robert Bosch GmbH (Star) dominates with a strong global presence and extensive ADAS offerings, driving market expansion and revenue growth through innovative sensor technologies, solid partnerships with OEMs, and comprehensive ADAS solutions. Mobileye (Emerging Leader) is gaining momentum with advanced camera-based perception systems, high-accuracy mapping solutions, and strategic collaborations with automotive manufacturers. The company demonstrates significant growth potential to move into the leaders' quadrant.
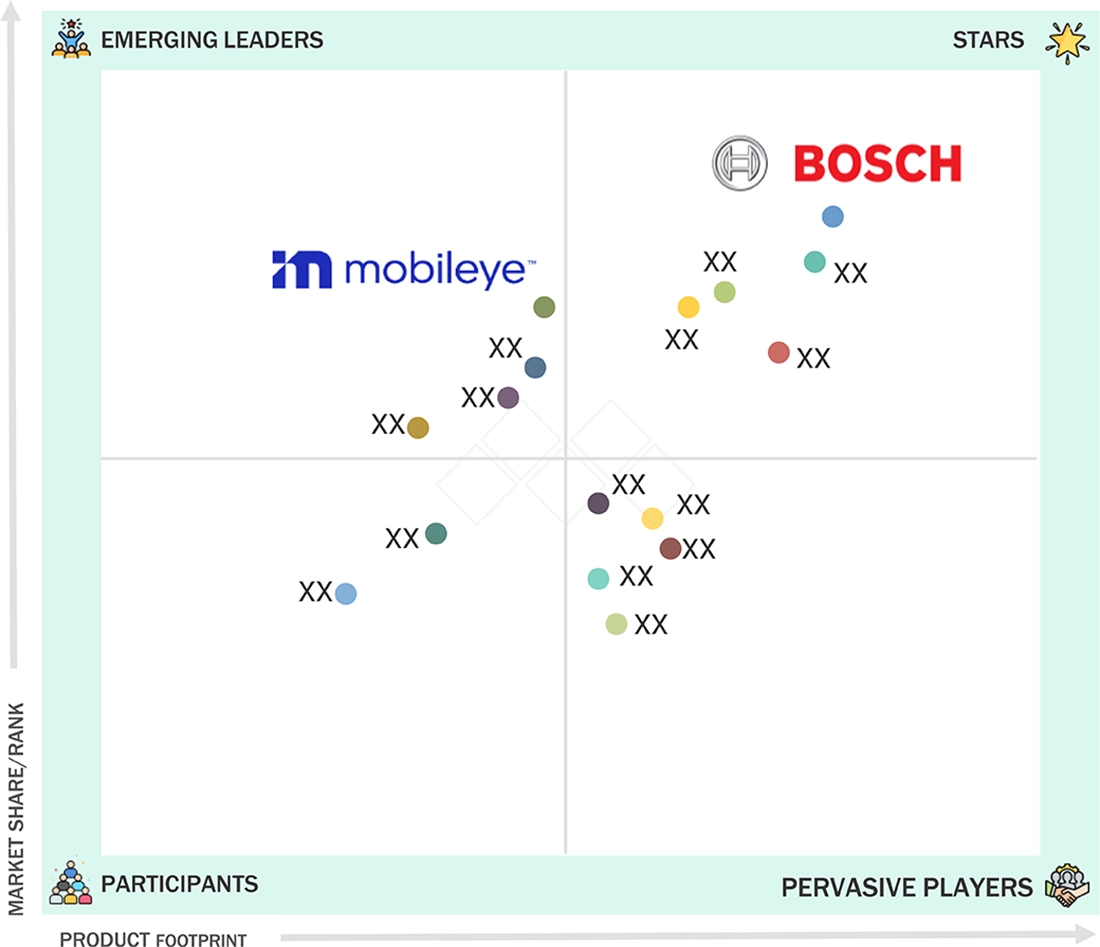
Source: Secondary Research, Interviews with Experts, MarketsandMarkets Analysis
KEY MARKET PLAYERS
MARKET SCOPE
| REPORT METRIC | DETAILS |
|---|---|
| Market Size in 2024 (Volume) | 332.3 Million Units |
| Market Forecast in 2032 (Volume) | 652.5 Million Units |
| Growth Rate | CAGR of 8.9% from 2025-2032 |
| Years Considered | 2021-2032 |
| Base Year | 2024 |
| Forecast Period | 2025-2032 |
| Units Considered | Volume (Thousand/Million Units) |
| Report Coverage | Revenue forecast, company ranking, competitive landscape, growth factors, and trends |
| Segments Covered |
|
| Regional Scope | Asia Pacific, Europe, North America, Rest of the World |
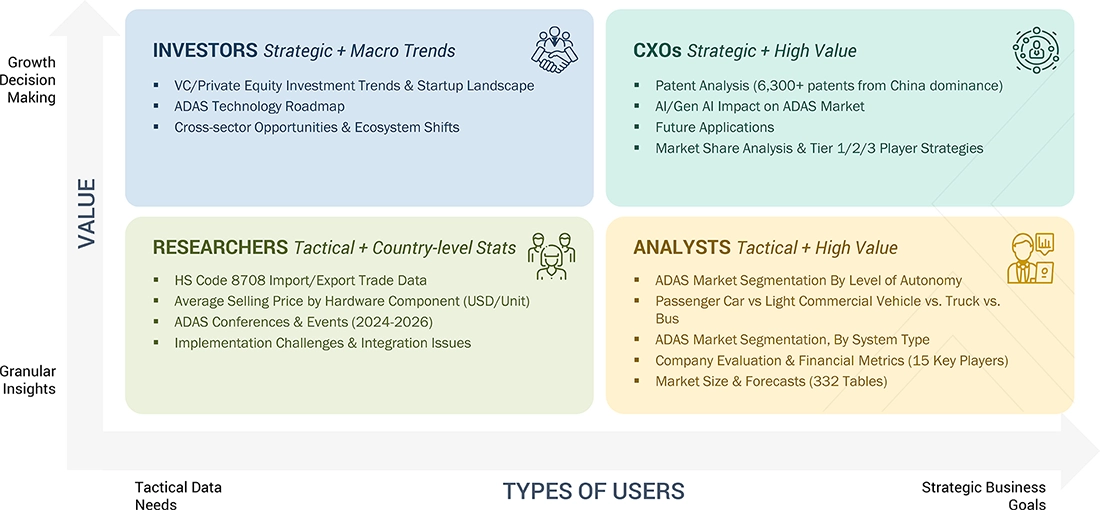
WHAT IS IN IT FOR YOU: Advanced Driver Assistance Systems Market REPORT CONTENT GUIDE
DELIVERED CUSTOMIZATIONS
We have successfully delivered the following deep-dive customizations:
| CLIENT REQUEST | CUSTOMIZATION DELIVERED | VALUE ADDS |
|---|---|---|
| Global Tier-1 Supplier (Europe) | Competitive benchmarking of Bosch, Continental, ZF, Valeo Technology roadmap tracking for radar, LiDAR, and camera modules |
|
| Automotive OEM (North America) | ADAS feature mapping across vehicle segments (luxury, mass-market, EVs) Cost-benefit analysis of Level 2+ vs. Level 3 adoption |
|
| Semiconductor Company (Asia Pacific) | Market sizing for ADAS-related chips (MCUs, SoCs, AI accelerators) Supply chain risk assessment for automotive semiconductors |
|
| Mobility-as-a-Service Operator (Global) | Evaluation of ADAS-enabled fleet safety improvements Case studies of driver monitoring & collision avoidance systems |
|
| Cloud/AI Provider (US) | Analysis of edge vs. cloud-based ADAS data processing Mapping partnerships with OEMs and Tier-1s for AI-driven perception |
|
RECENT DEVELOPMENTS
- April 2025 : Continental’s Automotive Group Sector was renamed ‘Aumovio’ after its planned spin-off and IPO in September 2025. As an independent company, Aumovio will focus on advanced electronic and mobility solutions to support safe, connected, and autonomous driving. Its offerings will include sensor systems, smart displays, braking and comfort technologies, as well as software platforms and assistance systems for software-defined and autonomous vehicles.
- April 2025 : Mobileye (Israel) partnered with Valens Semiconductor (Israel) for ADAS projects. Valens’ VA7000 chipsets, which follow the MIPI A-PHY standard, will be used to create the in-car connectivity system between sensors and computing units for Mobileye’s EyeQ6-based advanced and autonomous driving programs.
- April 2025 : Valeo (France) partnered with Renault Group (France) to equip the latest Renault Grand Koleos model with the Valeo Smart Safety 360 (VSS360) system. VSS360 is a new Turnkey L2/L2+ driver assistance system (ADAS) that provides driving safety and parking assistance functions. It includes a smart front camera, radar, detection algorithms, and advanced features.
- March 2025 : Mobileye introduced Surround ADAS, a software-defined system that enables hands-off, eyes-on driving at a lower cost. It uses Mobileye’s advanced software developed for autonomous vehicles and runs on a single EyeQ6 High SoC. The system uses up to 11 sensors, including multiple cameras and radars, and combines technologies like AI, computer vision, REM crowdsourced mapping, driving policy, and over-the-air updates. Key features include hands-off driving on highways and selected roads at speeds up to 130 km/h, surround collision avoidance, lane support, low-speed acceleration control, automatic lane changes, smart parking, and driver monitoring.
- March 2025 : Volkswagen Group (Germany) partnered with Valeo (France) and Mobileye (Israel) to enhance driver assistance systems in its vehicles. The partnership will integrate Mobileye’s EyeQ6 technology and Valeo’s advanced sensors to improve ADAS capabilities. This aims to bring more advanced safety and automation features to future Volkswagen models. The partnership focuses on developing high-performance assistance and automated driving systems.
Table of Contents
 Exclusive indicates content/data unique to MarketsandMarkets and not available with any competitors.
Methodology
The study encompassed four primary tasks to determine the present and future scope of the ADAS market. Initially, extensive secondary research was conducted to gather data on the market, its related sectors, and overarching industries. Subsequently, primary research involving industry experts across the value chain corroborated and validated these findings and assumptions. The complete adas market size was estimated by using both top-down and bottom-up methodologies. Following this, a market breakdown and data triangulation approach were utilized to determine the size of specific segments and subsegments within the market.
Secondary Research
In the secondary research process, various secondary sources such as company annual reports/presentations, press releases, industry association publications [for example, International Organization of Motor Vehicle Manufacturers (OICA), National Highway Traffic Safety Administration (NHTSA), International Energy Association (IEA)], articles, directories, technical handbooks, trade websites, technical articles, and databases (for example, Marklines, and Factiva) were used to identify and collect information useful for an extensive commercial study of the global ADAS market.
Primary Research
In the primary research process, various primary sources from both the supply and demand sides were interviewed to obtain qualitative and quantitative information on the market. The primary sources from the supply side included various industry experts, such as CXOs, vice presidents, directors from business development, marketing, product development/innovation teams, and related key executives from various key companies. Various system integrators, industry associations, independent consultants/industry veterans, and key opinion leaders were also interviewed.
Primary interviews were conducted to gather insights such as sizing estimates on the ADAS market and forecast, future technology trends, and upcoming technologies in the market. Data triangulation of all these points was done using the information gathered from secondary research and model mapping. Stakeholders from the demand and supply sides were interviewed to understand their views on the abovementioned points.

Source: Secondary Research, Primary Interviews, and MarketsandMarkets Analysis
To know about the assumptions considered for the study, download the pdf brochure
Market Size Estimation
Both top-down and bottom-up approaches were used to estimate and validate the total size of the ADAS market. These methods were also used extensively to estimate the size of various subsegments in the market. The research methodology used to estimate the market size includes the following:
ADAS Market : Top-Down and Bottom-Up Approach

Data Triangulation
After arriving at the overall market size—using the market size estimation processes as explained above—the market was split into several segments and subsegments. To complete the overall market engineering process and arrive at the exact statistics of each market segment and subsegment, data triangulation and market breakdown procedures were employed, wherever applicable. The data was triangulated by studying various factors and trends from both the demand and supply sides.
Market Definition
ADAS monitors a vehicle’s surroundings and driving behavior to pre-emptively detect potential hazards. This technology uses vehicle-based intelligent safety systems to enhance driving experience and vehicle & pedestrian safety by preventing crashes and mitigating crash severity.
Stakeholders
- ADAS Integrators
- ADAS/Occupant Safety Solution Suppliers
- American Automobile Association (AAA)
- Automobile Original Equipment Manufacturers (OEMs)
- Automotive Camera Manufacturers
- Automotive Component Manufacturers
- Automotive Radar and Ultrasonic Sensor Manufacturers
- Automotive SoC and ECU Manufacturers
- Automotive Software and Platform Providers
- Autonomous Driving Platform Providers
- Brazilian Association of Automotive Vehicle Manufacturers
- Comité des Constructeurs Français d'Automobiles (CCFA)
- China Association of Automobile Manufacturers (CAAM)
- Canadian Automobile Association
- Canadian Automobile Dealers Association (CADA)
- EV and EV Component Manufacturers
- Government & Research Organizations
- Japan Automobile Manufacturers Association (JAMA)
- Korea Automobile Manufacturers Association (KAMA)
- LiDAR Manufacturers
- National Highway Traffic Safety Administration (NHTSA)
- Society of Motor Manufacturers and Traders (SMMT)
- Vehicle Safety Regulatory Bodies
- Verband der Automobilindustrie (VDA)
Report Objectives
- To segment and forecast the size of the ADAS market in terms of volume (thousand units) and value (USD million)
- To define, describe, and forecast the market based on system type, hardware offering, software offering, electric vehicle (EV) type, level of autonomy, vehicle type, vehicle class, and region
-
To analyze regional markets for growth trends, prospects, and their contribution to the overall market
- To segment and forecast the market size by system type [adaptive cruise control (ACC), adaptive front light (AFL), automatic emergency braking (AEB), blind spot detection (BSD), cross traffic alert (CTA), driver monitoring system (DMS), forward collision warning (FCW), intelligent park assist (IPA), lane departure warning (LDW), night vision system (NVS), pedestrian detection system (PDS), road sign recognition (RSR), tire pressure monitoring system (TPMS), and traffic jam assist (TJA)]
- To segment and forecast the market size by hardware offering (camera units, LiDARs, radar sensors, and ultrasonic sensors)
- To provide qualitative insight into the market based on hardware offering (electronic control units (ECUs), and others )
- To provide qualitative insight into the market based on software offering (middleware, application software, operating systems)
- To provide qualitative insight into the market based on the vehicle class (North America, Europe, Asia Pacific, and the Rest of the World (RoW))
- To segment and forecast the market size by EV type [battery electric vehicle (BEV), hybrid electric vehicle (HEV), plug-in hybrid electric vehicle (PHEV), and fuel cell electric vehicle (FCEV)]
- To segment and forecast the market size by level of autonomy (L1, L2, and L3)
- To provide qualitative insight into the market based on level of autonomy (L4 and L5)
- To segment and forecast the market size by vehicle type (passenger car, light commercial vehicle, truck, and bus)
- To forecast the market size by region [North America, Europe, Asia Pacific, and the Rest of the World (RoW)]
- To analyze technological developments impacting the market
- To provide detailed information about the major factors influencing market growth (drivers, challenges, restraints, and opportunities)
- To strategically analyze the market, considering individual growth trends, prospects, and contributions to the total market
-
To study the following concerning the market
- Value Chain Analysis
- Ecosystem Analysis
- Technology Analysis
- Trade Analysis
- Case Study Analysis
- Patent Analysis
- Regulatory Landscape
- Average Selling Price Analysis
- Impact of AI/Gen AI
- Trend and Disruption Impact
- Key Stakeholders and Buying Criteria
- Key Conferences and Events
- To strategically profile key players and comprehensively analyze their market shares and core competencies
- To analyze the impact of the recession on the market
- o track and analyze competitive developments such as deals (joint ventures, mergers & acquisitions, partnerships, collaborations), product developments and launches, and other activities carried out by key industry participants
Available Customizations
With the given market data, MarketsandMarkets offers customizations in accordance with company-specific needs.
- ADAS market, for electric vehicles, by the system type
- ADAS market, by vehicle type at the country level
- Additional countries (Up to 5)
Company Information
- Profiling of additional market players (Up to 5)
Key Questions Addressed by the Report
What is the current size of the global ADAS market?
The global advanced driver assistance systems market size is valued at 359.8 million units in 2025
Who are the key players in the global ADAS market?
The ADAS market is dominated by major players, including Robert Bosch GmbH (Germany), Continental AG (Germany), ZF Friedrichshafen AG (Germany), Denso Corporation (Japan), and Magna International Inc. (Canada).
Which region will have the largest ADAS market?
The Asia Pacific region will lead the ADAS market, driven by a combination of regulatory mandates, growing automobile demand, and technological advancements.
Which country will significantly demand ADAS in the APAC region?
China will hold the largest share of the ADAS market due to high vehicle production from domestic and international OEMs, government support for manufacturing, and rising premium vehicle demand, which increases the need for advanced safety systems.
What are the key trends impacting the growth of the ADAS market?
Stricter government mandates for vehicle safety and the rapid adoption of electric and autonomous vehicles are driving higher ADAS integration across new models.
Need a Tailored Report?
Customize this report to your needs
Get 10% FREE Customization
Customize This ReportPersonalize This Research
- Triangulate with your Own Data
- Get Data as per your Format and Definition
- Gain a Deeper Dive on a Specific Application, Geography, Customer or Competitor
- Any level of Personalization
Let Us Help You
- What are the Known and Unknown Adjacencies Impacting the Advanced Driver Assistance Systems Market
- What will your New Revenue Sources be?
- Who will be your Top Customer; what will make them switch?
- Defend your Market Share or Win Competitors
- Get a Scorecard for Target Partners

Custom Market Research Services
We Will Customise The Research For You, In Case The Report Listed Above Does Not Meet With Your Requirements
Get 10% Free CustomisationGrowth opportunities and latent adjacency in Advanced Driver Assistance Systems Market


User
Nov, 2019
Surround camera systems for blind spot detection -Buses Surround camera systems for blind spot detection on Cars.
User
Nov, 2019
I am student from UniKL MFI, Malaysia, requesting for the sample report in order to make a research and analysis on the ADAS as required for my Final Year Project..
User
Nov, 2019
night vision sensor. Radar sensensors lidar , ultrasonic , pressure sensors markets in india for next five year .
User
Nov, 2019
Front assist system, Adaptive Cruise Control (ACC,)Lane Departure Warning (LDWS), Drowsiness Monitor, Blind Spot Detection (BSD), By Technology [Ultrasonic, Image, RADAR, LIDAR, Infrared (IR)], vehicle collision avoidance.