Semi-Autonomous & Autonomous Trucks and Buses Market

Semi-Autonomous & Autonomous Trucks and Buses Market by LoA (L1, L2/ L3, L4 & L5), Vehicle Type, Propulsion (Diesel, Electric, Hybrid), ADAS Features, Vehicle Class, Application, Sensor Type, and Region - Global Forecast to 2035

Report Code: AT 7660 Jul, 2024, by marketsandmarkets.com

[346 Pages Report] The global Semi-autonomous & autonomous Trucks and Buses market size is projected to grow from USD 40.7 billion in 2024 to USD 179.9 billion by 2035, at a CAGR of 14.4%. The Semi-autonomous & autonomous Trucks and Buses market is witnessing robust growth driven by increasing demand for autonomous vehicles  and innovation around advance driving technologies may drive the market for Semi-autonomous & autonomous Trucks and Buses.

Semi-Autonomous & Autonomous Trucks and Buses Market  Opportunities

To know about the assumptions considered for the study, Request for Free Sample Report

Top Companies in Semi-Autonomous & Autonomous Trucks and Buses Market

To know about the assumptions considered for the study, download the pdf brochure

SEMI-AUTONOMOUS & AUTONOMOUS TRUCKS AND BUSES MARKET:

Driver: Rising adoption of automation technology

Automation is another major driver in the industry. The automotive industry is transitioning to provide higher levels of automation, with self-driving technologies enabling vehicles to function safely and effectively. Key components of semi-autonomous driving technology include adaptive cruise control, lane keep assistance, and automatic emergency braking. These features enhance vehicle safety and help move it closer to full autonomy. Furthermore, the more investment car companies put into developing self-driving technologies, the more sophisticated sensors, cameras, radars, and software become in buses and trucks to perceive and react to their environment. Investments, partnerships, and technological progress that foster innovation have, therefore, been spurred on by increasing demand for the manufacture of autonomous vehicles. OEMs are working with many Tier 1 suppliers to design and integrate ADAS. For instance, Magna International in Canada and Robert Bosch GmbH in Germany are working on such a mission. Magna International last month launched its ClearView vision system on the Ram 2500 and 3500 heavy-duty pickup trucks, systems it said improved parking and maneuvering features.

Restraint: Lack of infrastructure in developing countries

The insufficient infrastructure is a major obstacle for the widespread use of advanced driver features in semi-autonomous and autonomous buses and trucks. Although these technologies show potential progress in automotive safety and efficiency, their success greatly depends on complementary infrastructure, specifically communication networks and road infrastructure. Semi-autonomous and autonomous buses and trucks require essential infrastructure such as clearly labeled roads, lane markers, and GPS connectivity in order to operate efficiently. Good connectivity infrastructure is essential for efficient functioning of vehicle-to-vehicle (V2V) and vehicle-to-infrastructure (V2X) communications. Information such as lane changes, object detection, vehicle distances, traffic updates, and navigation and connectivity services are essential for advanced vehicles on highways. Nevertheless, due to the restricted network connections on highways, semi-autonomous and autonomous buses and trucks may not always be able to access cloud data.

In developing nations like Mexico, Brazil, and India, the progress of IT infrastructure on highways is lagging behind that of more advanced countries. Insufficient infrastructure could restrict the capabilities of semi-autonomous and autonomous buses and trucks, like V2I communication and real-time traffic data integration, making them less effective.

Opportunity: Surge in demand for truck platooning

Truck platooning is a convoy of commercial vehicles that are closely controlled to travel in coordination with the help of connectivity technologies, autonomous driving systems, and artificial intelligence. The first vehicle is a leader for the entire platoon; all subsequent vehicles can move at varying speeds and change lanes according to the leader's behavior, requiring minimal driver intervention. The design of autonomous and semi-autonomous truck platooning is coming along with an increasing demand for fuel efficiency and the need to solve traffic congestion. Adaptive cruise control between platooning trucks enhances fuel economy by allowing the trucks to travel at a constant speed while maintaining close following distances. Other benefits of platooning include reducing traffic congestion by allowing other vehicles on the road and providing a smooth traffic flow on busy routes.

Challenge: Regulatory hurdles

There is a massive influence from the evolving regulatory framework on the semi-autonomous & autonomous trucks and buses market. The governments of most countries in the world have been developing regulations dealing with the safety standards in commercial vehicles, which shall be the key driver for the transformation of this market. For instance, the accident of a self-driving car in the US (August 2023) that resulted in a fatality can be an excellent example to understand these problems. A series of lawsuits and court proceedings will follow as autonomous trucks gain traction in the market. New safety and infrastructural regulations are being developed concerning new technologies in shuttles, buses, and last-mile delivery trucks. Buses are another area where OEMs, software providers, and Tier I suppliers focus on developing automated driving systems. However, there are still several issues at large in terms of how successfully a self-driving bus and truck can be introduced into it, among them the legislative environment. What defines an adequate functioning level for autonomous and semi-autonomous buses and trucks is a legal framework that specifies accident liability, insurance premiums, technology failure responsibility, driver training, and others.

SEMI-AUTONOMOUS & AUTONOMOUS TRUCKS AND BUSES MARKET: ECOSYSTEM

In the semi-autonomous & autonomous trucks and buses market ecosystem, component providers supply crucial elements such as semiconductors, sensors, software, processors, and controllers used in vehicle radar and sensing systems, alongside control modules and power electronics for automated driving and safety systems. Leading Tier 1 providers such as Robert Bosch GmbH (Germany), Denso Corporation (Japan), Continental AG (Germany), ZF Friedrichshafen AG (Germany), and Valeo (France) play pivotal roles in integrating autonomous features into bus and truck models through partnerships and agreements with component manufacturers and technology providers. Software companies within the ecosystem collaborate with these providers or develop their systems to enhance ADAS functionalities.


Top Companies in Semi-Autonomous & Autonomous Trucks and Buses Market

LiDAR segment is estimated to exhibit the fastest growth in semi-autonomous & autonomous trucks and buses market

Laser imaging detection and ranging (LiDAR) technology employs laser beams to measure the distance from an object, operating on a principle similar to radar sensors. LiDAR sensors find application in systems such as adaptive cruise control, collision avoidance, and night vision. Unlike radar, LiDAR utilizes shorter wavelengths, enabling effective detection of nonmetallic objects and those with weaker reflections. Its angular resolution is precise, achieving sub-degree accuracy both horizontally and vertically, owing to its utilization of short wavelengths and pulses. This characteristic renders LiDAR well-suited for high-resolution 3D environment mapping, facilitating accurate detection of free spaces, boundaries, and vehicle localization. Consequently, LiDAR plays a pivotal role in achieving L3 and higher autonomy levels. Innovative LiDAR technologies such as solid-state LIDAR, MEMS LIDAR, and electronically scanning LIDAR have emerged in recent years. These advancements aim to enhance the suitability of LIDAR for automotive applications in terms of size, cost, and robustness. While these technologies present improvements over traditional mechanical rotating LiDAR, further maturation is required to align with the maturity level of other ADAS sensors. The increasing traffic congestion, growing demand for roadways and vehicle safety systems, and the rising preference for semi-autonomous and autonomous vehicles drive the demand for LiDAR system sensors.

Last-mile Delivery Truck segment is expected to have significant growth in Semi-autonomous & autonomous Trucks and Buses market during the forecast period

The growth of e-commerce has significantly increased the demand for efficient and reliable last-mile delivery solutions. Last-mile delivery trucks play a crucial role in logistics, transporting goods from distribution centers or facilities to end-users. To meet this rising demand, autonomous trucks are being increasingly adopted. These vehicles can operate longer hours without fatigue and help reduce operational costs, making them an attractive option for the logistics industry. Autonomous trucks are witnessing high demand due to the expansion of the e-commerce sector. The primary goal is to deliver goods to consumers on time and reduce delivery costs for companies. In the US, continuous efforts are underway to develop next-generation drone and ground delivery vehicle technologies. These innovations are expected to expand last-mile delivery options in rural and urban areas, enhancing the efficiency and reach of delivery services. Companies are investing heavily in advanced sensor systems, machine learning algorithms, and real-time data analytics to improve the safety and efficiency of autonomous delivery trucks. For instance, the integration of AI-driven route optimization tools helps in planning the most efficient delivery paths, reducing fuel consumption and delivery times.

L2 and L3 segment is expected to see largest growth in Semi-autonomous & autonomous Trucks and Buses market during the forecast period

Level 2 automation is called partial automation. In Level 2 semi-autonomous trucks, the system can take control or assist in acceleration, steering, and braking in certain circumstances. The driver needs to monitor the driving environment, perform safety-critical functions, perform dynamic driving tasks, and always be ready to take control of the truck. In addition to the ADAS features integrated into level 1 autonomous trucks, level 2 automation offers additional features such as TJA, automated platooning, and Intelligent Park Assist (IPA). Level 3 automation is called conditional automation. The major difference between level 2 and level 3 semi-autonomous trucks is that the system monitors the driving environment and executes acceleration and steering. However, the driver still needs to perform dynamic driving tasks. The driving environment is monitored with the help of sensors such as LIDAR and radar. The data from LIDAR is used to create localization and mapping. About 1 or 2 LIDARs can be used in a level 3 semi-autonomous truck. The 3D LIDARs manufactured by Velodyne have a 360-degree field of view (FoV). Hence, one LIDAR is sufficient to monitor the surroundings. In addition to some of the features offered in level 1 and level 2, level 3 semi-autonomous trucks are integrated with ADAS features such as highway pilot, co-pilot, and highly automated truck platooning. The production of level 3 semi-autonomous trucks is currently in the development phase. However, speedy R&D activities and increasing investments from the industry are expected to boost the segment.

“The Europe Semi-autonomous & autonomous Trucks and Buses market is projected to become fastest by 2035.”

The automotive sector in Europe boasts 322 automobile assembly and production plants across the region. Among these, 71 focus on buses and 56 on trucks, as of August 2023. Despite the recent global automotive slowdown, the European automotive market has demonstrated consistent growth over the past six years. In January 2024, the European Union's new vehicle market rebounded with a robust 12.1% year-on-year increase in registrations, totaling 851,690 units, following a slowdown in December 2023. Leading European automobile manufacturers have been offering high-performance engines and advanced safety features to maintain competitiveness, which are crucial for the development of semi-autonomous and autonomous trucks and buses.

Sales of commercial vehicles by major automakers such as the Volkswagen Group (Germany), Mercedes-Benz Group AG (Germany), Renault Group (France), Hyundai Motor Company (South Korea), and Stellantis NV (Netherlands) have fueled demand for semi-autonomous and autonomous buses and trucks in the region. Strict emission regulations and zero-emission objectives in Europe are expected to significantly impact manufacturers of both passenger cars and commercial vehicles.

Semi-Autonomous & Autonomous Trucks and Buses Market  Size, and Share

Key Market Players

The Semi-autonomous & autonomous Trucks and Buses market is dominated by major players such as Daimler Truck AG (Geremany), AB Volvo (Sweden), Scania (Sweden), Robert Bosch GmbH (Germany), Continental AG (Germany), Denso Corporation (Japan), Aurora Innovation, Inc. (US) among others.

Get online access to the report on the World's First Market Intelligence Cloud

  • Easy to Download Historical Data & Forecast Numbers
  • Company Analysis Dashboard for high growth potential opportunities
  • Research Analyst Access for customization & queries
  • Competitor Analysis with Interactive dashboard
  • Latest News, Updates & Trend analysis
Request Sample

Scope of the Report

Report Metric

Details

Market size available for years

2019 - 2035

Base year considered

2024

Forecast period

2024-2035

Forecast units

Value (USD Million)

Segments covered

By Vehicle type, By Vehicle class, Propulsion Type, By ADAS features, By Application, By Sensor type, By Level of autonomy, and Region

Geographies covered

Asia Pacific, Europe, North America, and Rest Of The World

Companies Covered

Daimler Truck AG (Germany), AB Volvo (Sweden), NVIDIA Corporation (US), Robert Bosch GmbH (Germany), PlusAI, Inc. (US) Continental AG (Germany), Denso Corporation (Japan),
More than 25 major players are covered under the report.

This research report categorizes the Semi-autonomous & autonomous Trucks and Buses market based on By Vehicle type, By Vehicle class, Propulsion Type, By ADAS features, By Application, By Sensor type, By Level of autonomy, and Region

Semi-autonomous & Autonomous Trucks and Buses Market, By Vehicle Type:
  • Buses
  • Trucks
Semi-autonomous & Autonomous Trucks and Buses Market, By Vehicle Class:
  • Class 1- Class 3
  • Class 4- Class 6
  • Class 7- Class 9
Semi-autonomous & Autonomous Trucks and Buses Market, By Propulsion Type:
  • Diesel
  • Electric
  • Hybrid
Semi-autonomous & Autonomous Trucks and Buses Market, By Application:
  • Last-mile Delivery Trucks
  • Mining Trucks
  • Shuttles
  • Intercity/Intracity Buses
Semi-autonomous & Autonomous Trucks and Buses Market, By ADAS features:
  • Adaptive Cruise Control (ACC)
  • Automatic Emergency Braking (AEB)
  • Blind Spot Detection (BSD)
  • Lane Keep Assist (LKA)
  • Intelligent Park Assist (IPA)
  • Traffic Jam Assist (TJA)
  • Highway Pilot (HP)
Semi-autonomous & Autonomous Trucks and Buses Market, By Region
  • Asia Pacific
  • Europe
  • North America
  • Rest Of The World
Semi-autonomous & Autonomous Trucks and Buses Market, By Level of autonomy
  • L1
  • L2 and L3
  • L4
  • L5
Semi-autonomous & Autonomous Trucks and Buses Market, By Sensor type
  • Cameras
  • LiDAR
  • Radar Sensors
  • Ultrasonic Sensors

Recent Developments

  • In March 2024, MAN Truck & Bus SE partnered with TRATON GROUP, Scania, Navistar International Inc., and PlusAI, Inc. for autonomous driving for trucks.
  • In February 2024, MAN Truck & Bus SE expanded its logistics center in Salzgitter, Germany, strengthening its global service parts network.
  • In January 2024, Daimler Truck AG partnered with Aeva Inc. and Torc Robotics to commercialize self-driving vehicle technology to equip its series-produced autonomous trucks with Aeva Inc.'s advanced 4D LiDAR sensors.
  • In December 2023, Demy Schandeler and AB Volvo entered into a contract for fifteen e-buses to upgrade the present Volvo 7900 Electric, which are scheduled for delivery in the first half of 2025.
  • In October 2023, Hyundai Motor Company and Iveco S.p.A collaborated to develop and deploy electric heavy-duty trucks in Europe, focusing on autonomous driving technologies.
  • In September 2023, AB Volvo partnered with Boliden to integrate autonomous transport solutions into mining operations.
  • In July 2023, IVECO S.p.A and PlusAI, Inc. announced that the IVECO S-Way truck, equipped with PlusDrive, is operational on public roads in Germany.
  • In June 2023, Aurora Innovation Inc. launched the Aurora Multi-Sensor Dataset, a large-scale multi-sensor dataset in collaboration with the University of Toronto.
  • In May 2023, Daimler Truck AG, Mitsubishi Fuso Truck and Bus Corporation, Hino Motors Ltd., and Toyota Motor Corporation signed an MoU.
  • In April 2023, Continental AG and Aurora Innovation Inc. have entered an exclusive partnership to manufacture future generations of Aurora’s flagship integrated hardware and software systems, such as Aurora Driving, aiming for commercial scalability.
  • In February 2023, AB Volvo Venture Capital AB invested in Waabi Innovation Inc. to transform the freight transportation sector by accelerating the development and deployment of cutting-edge autonomous trucking solutions.

Frequently Asked Questions (FAQ):

To speak to our analyst for a discussion on the above findings, click Speak to Analyst

TABLE OF CONTENT
 
1 INTRODUCTION (Page No. - 30)
    1.1 STUDY OBJECTIVES 
    1.2 MARKET DEFINITION 
           TABLE 1 SEMI-AUTONOMOUS & AUTONOMOUS TRUCKS AND BUSES MARKET DEFINITION
           TABLE 2 SEMI-AUTONOMOUS & AUTONOMOUS TRUCKS AND BUSES MARKET DEFINITION, BY ADAS FEATURES
           TABLE 3 SEMI-AUTONOMOUS & AUTONOMOUS TRUCKS AND BUSES MARKET DEFINITION, BY LEVEL OF AUTONOMY
           TABLE 4 SEMI-AUTONOMOUS & AUTONOMOUS TRUCKS AND BUSES MARKET DEFINITION, BY PROPULSION TYPE
           TABLE 5 SEMI-AUTONOMOUS & AUTONOMOUS TRUCKS AND BUSES MARKET DEFINITION, BY VEHICLE TYPE
           TABLE 6 SEMI-AUTONOMOUS & AUTONOMOUS TRUCKS AND BUSES MARKET DEFINITION, BY APPLICATION
           TABLE 7 SEMI-AUTONOMOUS & AUTONOMOUS TRUCKS AND BUSES MARKET DEFINITION, BY SENSOR TYPE
           TABLE 8 SEMI-AUTONOMOUS & AUTONOMOUS TRUCKS AND BUSES MARKET DEFINITION, BY VEHICLE CLASS
    1.3 STUDY SCOPE 
           1.3.1 MARKETS COVERED
                    FIGURE 1 SEMI-AUTONOMOUS & AUTONOMOUS TRUCKS AND BUSES MARKET SEGMENTATION
           1.3.2 REGIONS COVERED
           1.3.3 YEARS CONSIDERED
    1.4 INCLUSIONS AND EXCLUSIONS 
           TABLE 9 INCLUSIONS AND EXCLUSIONS
    1.5 CURRENCY CONSIDERED 
           TABLE 10 USD EXCHANGE RATES, 2018–2023
    1.6 UNIT CONSIDERED 
    1.7 STAKEHOLDERS 
    1.8 SUMMARY OF CHANGES 
 
2 RESEARCH METHODOLOGY (Page No. - 40)
    2.1 RESEARCH DATA 
           FIGURE 2 RESEARCH DESIGN
           FIGURE 3 RESEARCH PROCESS FLOW
           2.1.1 SECONDARY DATA
                    2.1.1.1 Key secondary sources
                    2.1.1.2 Key data from secondary sources
           2.1.2 PRIMARY DATA
                    TABLE 11 PRIMARY INTERVIEW PARTICIPANTS
                    FIGURE 4 BREAKDOWN OF PRIMARY INTERVIEWS
                    2.1.2.1 Primary participants
    2.2 MARKET SIZE ESTIMATION 
           FIGURE 5 HYPOTHESIS BUILDING
           2.2.1 BOTTOM-UP APPROACH
                    FIGURE 6 BOTTOM-UP APPROACH: SEMI-AUTONOMOUS TRUCKS AND BUSES MARKET
                    FIGURE 7 BOTTOM-UP APPROACH: AUTONOMOUS TRUCKS AND BUSES MARKET
           2.2.2 TOP-DOWN APPROACH
                    FIGURE 8 TOP-DOWN APPROACH: SEMI-AUTONOMOUS TRUCKS AND BUSES MARKET
                    FIGURE 9 TOP-DOWN APPROACH: AUTONOMOUS TRUCKS AND BUSES MARKET
           2.2.3 RECESSION IMPACT ANALYSIS
    2.3 DATA TRIANGULATION 
           FIGURE 10 DATA TRIANGULATION
           FIGURE 11 MARKET GROWTH PROJECTIONS FROM DEMAND-SIDE DRIVERS
    2.4 FACTOR ANALYSIS 
           FIGURE 12 FACTOR ANALYSIS FROM DEMAND AND SUPPLY SIDES
           FIGURE 13 REGIONAL ECONOMY IMPACT ANALYSIS
    2.5 RESEARCH ASSUMPTIONS 
    2.6 RESEARCH LIMITATIONS 
    2.7 RISK ANALYSIS 
           TABLE 12 RISK ANALYSIS
 
3 EXECUTIVE SUMMARY (Page No. - 58)
    FIGURE 14 SEMI-AUTONOMOUS & AUTONOMOUS TRUCKS AND BUSES MARKET OVERVIEW 
    FIGURE 15 EUROPE TO ACCOUNT FOR HIGHEST CAGR DURING FORECAST PERIOD 
    FIGURE 16 SHUTTLES SEGMENT TO BE FASTEST-GROWING MARKET DURING FORECAST PERIOD 
 
4 PREMIUM INSIGHTS (Page No. - 62)
    4.1 ATTRACTIVE OPPORTUNITIES FOR PLAYERS IN SEMI-AUTONOMOUS & AUTONOMOUS TRUCKS AND BUSES MARKET 
           FIGURE 17 INCREASING DEMAND FOR AUTONOMOUS VEHICLES TO DRIVE MARKET
    4.2 SEMI-AUTONOMOUS & AUTONOMOUS TRUCKS AND BUSES MARKET, BY REGION 
           FIGURE 18 ASIA PACIFIC TO ACCOUNT FOR LARGEST MARKET SHARE IN 2024
    4.3 SEMI-AUTONOMOUS & AUTONOMOUS TRUCKS AND BUSES MARKET, BY PROPULSION TYPE 
           FIGURE 19 ELECTRIC SEGMENT TO HAVE HIGHER CAGR DURING FORECAST PERIOD
    4.4 SEMI-AUTONOMOUS & AUTONOMOUS TRUCKS AND BUSES MARKET, BY VEHICLE TYPE 
           FIGURE 20 TRUCKS SEGMENT TO DOMINATE MARKET DURING FORECAST PERIOD
    4.5 SEMI-AUTONOMOUS & AUTONOMOUS TRUCKS AND BUSES MARKET, BY LEVEL OF AUTONOMY 
           FIGURE 21 L1 SEGMENT TO HOLD LARGEST MARKET SHARE DURING FORECAST PERIOD
    4.6 SEMI-AUTONOMOUS & AUTONOMOUS TRUCKS AND BUSES MARKET, BY SENSOR TYPE 
           FIGURE 22 LIDAR SEGMENT TO HAVE LARGEST MARKET SHARE DURING FORECAST PERIOD
    4.7 SEMI-AUTONOMOUS & AUTONOMOUS TRUCKS AND BUSES MARKET, BY APPLICATION 
           FIGURE 23 LAST-MILE DELIVERY TRUCKS SEGMENT TO LEAD MARKET DURING FORECAST PERIOD
    4.8 SEMI-AUTONOMOUS & AUTONOMOUS TRUCKS AND BUSES MARKET, BY VEHICLE CLASS 
           FIGURE 24 CLASS 1–3 SEGMENT TO REGISTER HIGHEST CAGR DURING FORECAST PERIOD
 
5 MARKET OVERVIEW (Page No. - 67)
    5.1 INTRODUCTION 
    5.2 TRENDS AND DISRUPTIONS IMPACTING CUSTOMER BUSINESS 
           FIGURE 25 TRENDS AND DISRUPTIONS IMPACTING CUSTOMER BUSINESS
    5.3 MARKET DYNAMICS 
           FIGURE 26 SEMI-AUTONOMOUS & AUTONOMOUS TRUCKS AND BUSES MARKET: DRIVERS, RESTRAINTS, OPPORTUNITIES, AND CHALLENGES
           5.3.1 DRIVERS
                    5.3.1.1 Increasing emphasis on road safety and traffic control
                               FIGURE 27 EVOLUTION OF AUTOMATED SAFETY TECHNOLOGIES
                    5.3.1.2 Growing need to address driver shortage
                               FIGURE 28 TRUCK DRIVER SHORTAGE WORLDWIDE, 2023
                    5.3.1.3 Rising adoption of automation technology
                               FIGURE 29 MULTI-SENSOR SYSTEMS IN SELF-DRIVING TRUCKS
                    5.3.1.4 Favorable government regulations and safety standards
                               FIGURE 30 NEW VEHICLE SAFETY STANDARDS BY EUROPEAN COMMISSION, 2022–2029
           5.3.2 RESTRAINTS
                    5.3.2.1 Cybersecurity and data security concerns
                               FIGURE 31 VEHICLE COMMUNICATION VIA WLAN
                    5.3.2.2 Limited public reception
                               FIGURE 32 DRIVER PERCEPTION LEVELS FOR AUTONOMOUS VEHICLES IN US, 2021–2023
                    5.3.2.3 Lack of infrastructure in developing countries
           5.3.3 OPPORTUNITIES
                    5.3.3.1 Growing integration of 5G technology
                               FIGURE 33 SK TELECOM–SEOUL CITY AUTONOMOUS DRIVING INFRASTRUCTURE
                    5.3.3.2 Increasing utilization of advanced technologies
                               FIGURE 34 EVOLUTION OF AUTOMATED SAFETY TECHNOLOGIES
                    5.3.3.3 Surge in demand for truck platooning
                               FIGURE 35 PLATOONING WITH WIRELESS COMMUNICATION TECHNOLOGY AND COMMUNICATION METHODS
                    5.3.3.4 Rising focus on automotive IoT
                               FIGURE 36 BENEFITS OF IOT IN AUTOMOTIVE SECTOR
           5.3.4 CHALLENGES
                    5.3.4.1 High cost of development and integration
                    5.3.4.2 Regulatory hurdles
                               TABLE 13 IMPACT ANALYSIS OF MARKET DYNAMICS
    5.4 ECOSYSTEM ANALYSIS 
           FIGURE 37 ECOSYSTEM ANALYSIS
           TABLE 14 ROLE OF COMPANIES IN ECOSYSTEM
    5.5 VALUE CHAIN ANALYSIS 
           FIGURE 38 VALUE CHAIN ANALYSIS
    5.6 TOTAL COST OF OWNERSHIP 
           TABLE 15 PRICES OF EV AND ICE TRUCK MODELS, 2023
           FIGURE 39 TOTAL COST OF OWNERSHIP BREAKDOWN FOR TRUCKS
           TABLE 16 PRICES OF EV AND ICE BUS MODELS, 2023
           FIGURE 40 TOTAL COST OF OWNERSHIP BREAKDOWN FOR BUSES
    5.7 BILL OF MATERIALS ANALYSIS 
           5.7.1 BILL OF MATERIALS ANALYSIS FOR SEMI-AUTONOMOUS & AUTONOMOUS BUSES
                    TABLE 17 BILL OF MATERIALS ANALYSIS FOR SEMI-AUTONOMOUS & AUTONOMOUS BUSES
           5.7.2 BILL OF MATERIALS ANALYSIS FOR SEMI-AUTONOMOUS & AUTONOMOUS TRUCKS
                    TABLE 18 BILL OF MATERIALS ANALYSIS FOR SEMI-AUTONOMOUS & AUTONOMOUS TRUCKS
    5.8 PRICING ANALYSIS 
           5.8.1 AVERAGE SELLING PRICE, BY SENSOR TYPE
                    TABLE 19 AVERAGE SELLING PRICE, BY SENSOR TYPE, 2022–2024 (USD)
                    FIGURE 41 AVERAGE SELLING PRICE, BY SENSOR TYPE, 2022–2024 (USD)
           5.8.2 AVERAGE SELLING PRICE FOR VEHICLE TYPE, BY REGION
                    TABLE 20 AVERAGE SELLING PRICE OF SEMI-AUTONOMOUS & AUTONOMOUS TRUCKS, BY REGION, 2022–2024 (USD)
                    FIGURE 42 AVERAGE SELLING PRICE OF SEMI-AUTONOMOUS & AUTONOMOUS BUSES, BY REGION, 2022–2024 (USD)
                    TABLE 21 AVERAGE SELLING PRICE OF SEMI-AUTONOMOUS & AUTONOMOUS TRUCKS, BY REGION, 2022–2024 (USD)
                    FIGURE 43 AVERAGE SELLING PRICE OF SEMI-AUTONOMOUS & AUTONOMOUS TRUCKS, BY REGION, 2022–2024 (USD)
    5.9 INVESTMENT SCENARIO 
           FIGURE 44 INVESTMENT SCENARIO, 2021–2024
    5.10 PATENT ANALYSIS 
           FIGURE 45 PATENT ANALYSIS, 2014–2023
           TABLE 22 INNOVATIONS AND PATENT REGISTRATIONS, 2022–2024
    5.11 TECHNOLOGY ANALYSIS 
           5.11.1 INTRODUCTION
           5.11.2 KEY TECHNOLOGIES
                    5.11.2.1 Artificial intelligence
                    5.11.2.2 Sensor fusion
                               FIGURE 46 SENSOR FUSION TECHNOLOGY
           5.11.3 COMPLIMENTARY TECHNOLOGIES
                    5.11.3.1 Vehicle-to-everything
                               FIGURE 47 V2X COMMUNICATION
                               5.11.3.1.1 Vehicle-to-cloud
                               5.11.3.1.2 Vehicle-to-pedestrian
                               5.11.3.1.3 Vehicle-to-infrastructure
                               5.11.3.1.4 Vehicle-to-vehicle
                    5.11.3.2 Automotive IoT
                    5.11.3.3 Cooperative adaptive cruise control
                               FIGURE 48 COOPERATIVE ADAPTIVE CRUISE CONTROL BASED ON 5G CONNECTIVITY
           5.11.4 ADJACENT TECHNOLOGIES
                    5.11.4.1 Simultaneous localization and mapping
                               FIGURE 49 SIMULTANEOUS LOCALIZATION AND MAPPING
    5.12 REGULATORY LANDSCAPE 
                    TABLE 23 REGULATIONS AND INITIATIVES
           5.12.1 REGULATORY BODIES, GOVERNMENT AGENCIES, AND OTHER ORGANIZATIONS
                    TABLE 24 NORTH AMERICA: REGULATORY BODIES, GOVERNMENT AGENCIES, AND OTHER ORGANIZATIONS
                    TABLE 25 EUROPE: REGULATORY BODIES, GOVERNMENT AGENCIES, AND OTHER ORGANIZATIONS
                    TABLE 26 ASIA PACIFIC: REGULATORY BODIES, GOVERNMENT AGENCIES, AND OTHER ORGANIZATIONS
    5.13 TRADE DATA ANALYSIS 
                    TABLE 27 IMPORT DATA FOR HS CODE 8708, BY COUNTRY, 2021–2023 (USD MILLION)
                    TABLE 28 EXPORT DATA FOR HS CODE 8708, BY COUNTRY, 2021–2023 (USD MILLION)
    5.14 KEY CONFERENCES AND EVENTS 
                    TABLE 29 KEY CONFERENCES AND EVENTS, 2024–2025
    5.15 KEY STAKEHOLDERS AND BUYING CRITERIA 
           5.15.1 KEY STAKEHOLDERS IN BUYING PROCESS
                    FIGURE 50 INFLUENCE OF STAKEHOLDERS ON BUYING PROCESS, BY VEHICLE TYPE
                    TABLE 30 INFLUENCE OF STAKEHOLDERS ON BUYING PROCESS, BY VEHICLE TYPE (%)
           5.15.2 BUYING CRITERIA
                    FIGURE 51 KEY BUYING CRITERIA, BY VEHICLE TYPE
                    TABLE 31 KEY BUYING CRITERIA, BY VEHICLE TYPE
    5.16 CASE STUDY ANALYSIS 
           5.16.1 IMPLEMENTATION OF SHARED AUTOMATED ELECTRIC VEHICLES WITH AVENUE PROJECT
           5.16.2 INSTALLATION OF CAVSTAR AUTONOMOUS DRIVE SYSTEM FOR SAFE AND EFFICIENT PUBLIC TRANSPORT
           5.16.3 ENHANCED DEVELOPMENT OF AUTONOMOUS DRIVING TECHNOLOGY WITH DIGITAL PLATFORM
           5.16.4 IMPROVED AUTONOMOUS VEHICLES USING TELEOPERATED DRIVERLESS PROCESS
 
6 SEMI-AUTONOMOUS & AUTONOMOUS TRUCKS AND BUSES MARKET, BY APPLICATION (Page No. - 121)
    6.1 INTRODUCTION 
           FIGURE 52 SEMI-AUTONOMOUS & AUTONOMOUS TRUCKS AND BUSES MARKET, BY APPLICATION, 2024–2035 (THOUSAND UNITS)
           TABLE 32 SEMI-AUTONOMOUS & AUTONOMOUS TRUCKS AND BUSES MARKET, BY APPLICATION, 2019–2023 (THOUSAND UNITS)
           TABLE 33 SEMI-AUTONOMOUS & AUTONOMOUS TRUCKS AND BUSES MARKET, BY APPLICATION, 2024–2030 (THOUSAND UNITS)
           TABLE 34 SEMI-AUTONOMOUS & AUTONOMOUS TRUCKS AND BUSES MARKET, BY APPLICATION, 2031–2035 (THOUSAND UNITS)
    6.2 SHUTTLES 
           6.2.1 GROWING NEED FOR REDUCED COMPLEXITY IN OPERATIONS TO DRIVE MARKET
                    TABLE 35 SHUTTLES: SEMI-AUTONOMOUS & AUTONOMOUS TRUCKS AND BUSES MARKET, BY REGION, 2019–2023 (THOUSAND UNITS)
                    TABLE 36 SHUTTLES: SEMI-AUTONOMOUS & AUTONOMOUS TRUCKS AND BUSES MARKET, BY REGION, 2024–2030 (THOUSAND UNITS)
                    TABLE 37 SHUTTLES: SEMI-AUTONOMOUS & AUTONOMOUS TRUCKS AND BUSES MARKET, BY REGION, 2031–2035 (THOUSAND UNITS)
    6.3 INTERCITY/INTRACITY BUSES 
           6.3.1 NEED FOR EFFICIENT, RELIABLE, AND SAFE TRANSPORTATION IN DENSELY POPULATED AREAS TO DRIVE MARKET
                    TABLE 38 INTERCITY/INTRACITY BUSES: SEMI-AUTONOMOUS & AUTONOMOUS TRUCKS AND BUSES MARKET, BY REGION, 2019–2023 (THOUSAND UNITS)
                    TABLE 39 INTERCITY/INTRACITY BUSES: SEMI-AUTONOMOUS & AUTONOMOUS TRUCKS AND BUSES MARKET, BY REGION, 2024–2030 (THOUSAND UNITS)
                    TABLE 40 INTERCITY/INTRACITY BUSES: SEMI-AUTONOMOUS & AUTONOMOUS TRUCKS AND BUSES MARKET, BY REGION, 2031–2035 (THOUSAND UNITS)
    6.4 LAST-MILE DELIVERY TRUCKS 
           6.4.1 BOOMING E-COMMERCE MARKET TO DRIVE MARKET
                    TABLE 41 LAST-MILE DELIVERY TRUCKS: SEMI-AUTONOMOUS & AUTONOMOUS TRUCKS AND BUSES MARKET, BY REGION, 2019–2023 (THOUSAND UNITS)
                    TABLE 42 LAST-MILE DELIVERY TRUCKS: SEMI-AUTONOMOUS & AUTONOMOUS TRUCKS AND BUSES MARKET, BY REGION, 2024–2030 (THOUSAND UNITS)
                    TABLE 43 LAST-MILE DELIVERY TRUCKS: SEMI-AUTONOMOUS & AUTONOMOUS TRUCKS AND BUSES MARKETS, BY REGION, 2031–2035 (THOUSAND UNITS)
    6.5 MINING TRUCKS 
           6.5.1 INCREASING INCLINATION TOWARD AUTOMATION TO DRIVE MARKET
                    TABLE 44 MINING TRUCKS: SEMI-AUTONOMOUS & AUTONOMOUS TRUCKS AND BUSES MARKET, BY REGION, 2019–2023 (THOUSAND UNITS)
                    TABLE 45 MINING TRUCKS: SEMI-AUTONOMOUS & AUTONOMOUS TRUCKS AND BUSES MARKET, BY REGION, 2024–2030 (THOUSAND UNITS)
                    TABLE 46 MINING TRUCKS: SEMI-AUTONOMOUS & AUTONOMOUS TRUCKS AND BUSES MARKET, BY REGION, 2031–2035 (THOUSAND UNITS)
    6.6 KEY INDUSTRY INSIGHTS 
 
7 SEMI-AUTONOMOUS & AUTONOMOUS TRUCKS AND BUSES MARKET, BY ADAS FEATURES (Page No. - 131)
    7.1 INTRODUCTION 
    7.2 ADAPTIVE CRUISE CONTROL 
           7.2.1 RISING INTEGRATION INTO VEHICLE MODELS BY AUTOMOBILE MANUFACTURERS TO DRIVE MARKET
    7.3 AUTOMATIC EMERGENCY BRAKING 
           7.3.1 SURGE IN IMPLEMENTATION OF AUTOMOTIVE SAFETY STANDARDS AND REGULATORY MEASURES TO DRIVE MARKET
    7.4 BLIND SPOT DETECTION 
           7.4.1 INCREASING FOCUS ON PREVENTING ACCIDENTS TO DRIVE MARKET
    7.5 INTELLIGENT PARK ASSIST 
           7.5.1 SURGE IN DEMAND FOR CONVENIENT PARKING IN LIMITED SPACES TO DRIVE MARKET
    7.6 TRAFFIC JAM ASSIST 
           7.6.1 GROWING TREND TOWARD VEHICLE AUTOMATION TO DRIVE MARKET
    7.7 LANE KEEP ASSIST 
           7.7.1 RISING NEED TO MAINTAIN LANE DISCIPLINE TO DRIVE MARKET
    7.8 HIGHWAY PILOT 
           7.8.1 GROWING ADOPTION IN COMMERCIAL VEHICLE INDUSTRY TO DRIVE MARKET
 
8 SEMI-AUTONOMOUS & AUTONOMOUS TRUCKS AND BUSES MARKET, BY LEVEL OF AUTONOMY (Page No. - 137)
    8.1 INTRODUCTION 
           FIGURE 53 SEMI-AUTONOMOUS & AUTONOMOUS TRUCKS AND BUSES MARKET, BY LEVEL OF AUTONOMY, 2024–2035 (THOUSAND UNITS)
           TABLE 47 SEMI-AUTONOMOUS & AUTONOMOUS TRUCKS AND BUSES MARKET, BY LEVEL OF AUTONOMY, 2019–2023 (THOUSAND UNITS)
           TABLE 48 SEMI-AUTONOMOUS & AUTONOMOUS TRUCKS AND BUSES MARKET, BY LEVEL OF AUTONOMY, 2024–2030 (THOUSAND UNITS)
           TABLE 49 S SEMI-AUTONOMOUS & AUTONOMOUS TRUCKS AND BUSES MARKET, BY LEVEL OF AUTONOMY, 2031–2035 (THOUSAND UNITS)
    8.2 L1 
           8.2.1 RISE IN SAFETY REGULATIONS FROM GOVERNMENTS WORLDWIDE TO DRIVE MARKET
                    TABLE 50 L1: SEMI-AUTONOMOUS & AUTONOMOUS TRUCKS AND BUSES MARKET, BY REGION, 2019–2023 (THOUSAND UNITS)
                    TABLE 51 L1: SEMI-AUTONOMOUS & AUTONOMOUS TRUCKS AND BUSES MARKET, BY REGION, 2024–2030 (THOUSAND UNITS)
                    TABLE 52 L1: SEMI-AUTONOMOUS & AUTONOMOUS TRUCKS AND BUSES MARKET, BY REGION, 2031–2035 (THOUSAND UNITS)
    8.3 L2 AND L3 
           8.3.1 SURGE IN R&D INVESTMENTS TO DRIVE MARKET
                    TABLE 53 L2 AND L3: SEMI-AUTONOMOUS & AUTONOMOUS TRUCKS AND BUSES MARKET, BY REGION, 2019–2023 (THOUSAND UNITS)
                    TABLE 54 L2 AND L3: SEMI-AUTONOMOUS & AUTONOMOUS TRUCKS AND BUSES MARKET, BY REGION, 2024–2030 (THOUSAND UNITS)
                    TABLE 55 L2 AND L3: SEMI-AUTONOMOUS & AUTONOMOUS TRUCKS AND BUSES MARKET, BY REGION, 2031–2035 (THOUSAND UNITS)
    8.4 L4 
           8.4.1 INCREASING NEED TO OPERATE VEHICLES WITHOUT HUMAN INTERVENTION TO DRIVE MARKET
                    TABLE 56 L4: SEMI-AUTONOMOUS & AUTONOMOUS TRUCKS AND BUSES MARKET, BY REGION, 2019–2023 (THOUSAND UNITS)
                    TABLE 57 L4: SEMI-AUTONOMOUS & AUTONOMOUS TRUCKS AND BUSES MARKET, BY REGION, 2024–2030 (THOUSAND UNITS)
                    TABLE 58 L4: SEMI-AUTONOMOUS & AUTONOMOUS TRUCKS AND BUSES MARKET, BY REGION, 2031–2035 (THOUSAND UNITS)
    8.5 L5 
           8.5.1 GROWING ADVANCEMENTS IN SENSOR TECHNOLOGY TO DRIVE MARKET
                    TABLE 59 L5: SEMI-AUTONOMOUS & AUTONOMOUS TRUCKS AND BUSES MARKET, BY REGION, 2024–2030 (UNITS)
                    TABLE 60 L5: SEMI-AUTONOMOUS & AUTONOMOUS TRUCKS AND BUSES MARKET, BY REGION, 2031–2035 (UNITS)
    8.6 KEY PRIMARY INSIGHTS 
 
9 SEMI-AUTONOMOUS & AUTONOMOUS TRUCKS AND BUSES MARKET, BY PROPULSION TYPE (Page No. - 146)
    9.1 INTRODUCTION 
           FIGURE 54 SEMI-AUTONOMOUS & AUTONOMOUS TRUCKS AND BUSES MARKET, BY PROPULSION TYPE, 2024–2035 (USD MILLION)
           TABLE 61 SEMI-AUTONOMOUS & AUTONOMOUS TRUCKS AND BUSES MARKET, BY PROPULSION TYPE, 2019–2023 (THOUSAND UNITS)
           TABLE 62 SEMI-AUTONOMOUS & AUTONOMOUS TRUCKS AND BUSES MARKET, BY PROPULSION TYPE, 2024–2030 (THOUSAND UNITS)
           TABLE 63 SEMI-AUTONOMOUS & AUTONOMOUS TRUCKS AND BUSES MARKET, BY PROPULSION TYPE, 2031–2035 (THOUSAND UNITS)
           TABLE 64 SEMI-AUTONOMOUS & AUTONOMOUS TRUCKS AND BUSES MARKET, BY PROPULSION TYPE, 2019–2023 (USD MILLION)
           TABLE 65 SEMI-AUTONOMOUS & AUTONOMOUS TRUCKS AND BUSES MARKET, BY PROPULSION TYPE, 2024–2030 (USD MILLION)
           TABLE 66 SEMI-AUTONOMOUS & AUTONOMOUS TRUCKS AND BUSES MARKET, BY PROPULSION TYPE, 2031–2035 (USD MILLION)
    9.2 DIESEL 
           9.2.1 INCREASING USE OF LONG-HAUL TRUCKING AND LARGE PUBLIC TRANSPORT BUSES TO DRIVE MARKET
                    TABLE 67 DIESEL: SEMI-AUTONOMOUS & AUTONOMOUS TRUCKS AND BUSES MARKET, BY REGION, 2019–2023 (THOUSAND UNITS)
                    TABLE 68 DIESEL: SEMI-AUTONOMOUS & AUTONOMOUS TRUCKS AND BUSES MARKET, BY REGION, 2024–2030 (THOUSAND UNITS)
                    TABLE 69 DIESEL: SEMI-AUTONOMOUS & AUTONOMOUS TRUCKS AND BUSES MARKET, BY REGION, 2031–2035 (THOUSAND UNITS)
                    TABLE 70 DIESEL: SEMI-AUTONOMOUS & AUTONOMOUS TRUCKS AND BUSES MARKET, BY REGION, 2019–2023 (USD MILLION)
                    TABLE 71 DIESEL: SEMI-AUTONOMOUS & AUTONOMOUS TRUCKS AND BUSES MARKET, BY REGION, 2024–2030 (USD MILLION)
                    TABLE 72 DIESEL: SEMI-AUTONOMOUS & AUTONOMOUS TRUCKS AND BUSES MARKET, BY REGION, 2031–2035 (USD MILLION)
    9.3 ELECTRIC 
           9.3.1 RISING NEED FOR REDUCED NOISE POLLUTION AND GREENHOUSE GAS EMISSIONS TO DRIVE MARKET
                    TABLE 73 ELECTRIC: SEMI-AUTONOMOUS & AUTONOMOUS TRUCKS AND BUSES MARKET, BY REGION, 2019–2023 (THOUSAND UNITS)
                    TABLE 74 ELECTRIC: SEMI-AUTONOMOUS & AUTONOMOUS TRUCKS AND BUSES MARKET, BY REGION, 2024–2030 (THOUSAND UNITS)
                    TABLE 75 ELECTRIC: SEMI-AUTONOMOUS & AUTONOMOUS TRUCKS AND BUSES MARKET, BY REGION, 2031–2035 (THOUSAND UNITS)
                    TABLE 76 ELECTRIC: SEMI-AUTONOMOUS & AUTONOMOUS TRUCKS AND BUSES MARKET, BY REGION, 2019–2023 (USD MILLION)
                    TABLE 77 ELECTRIC: SEMI-AUTONOMOUS & AUTONOMOUS TRUCKS AND BUSES MARKET, BY REGION, 2024–2030 (USD MILLION)
                    TABLE 78 ELECTRIC: SEMI-AUTONOMOUS & AUTONOMOUS TRUCKS AND BUSES MARKET, BY REGION, 2031–2035 (USD MILLION)
    9.4 HYBRID 
           9.4.1 GROWING CONCERNS ABOUT VEHICLE EFFICIENCY AND EMISSIONS TO DRIVE MARKET
    9.5 KEY INDUSTRY INSIGHTS 
 
10 SEMI-AUTONOMOUS & AUTONOMOUS TRUCKS AND BUSES MARKET, BY SENSOR TYPE (Page No. - 157)
     10.1 INTRODUCTION 
               FIGURE 55 SEMI-AUTONOMOUS & AUTONOMOUS TRUCKS AND BUSES MARKET, BY SENSOR TYPE, 2024–2035 (USD MILLION)
               TABLE 79 SEMI-AUTONOMOUS & AUTONOMOUS TRUCKS AND BUSES MARKET, BY SENSOR TYPE, 2019–2023 (THOUSAND UNITS)
               TABLE 80 SEMI-AUTONOMOUS & AUTONOMOUS TRUCKS AND BUSES MARKET, BY SENSOR TYPE, 2024–2030 (THOUSAND UNITS)
               TABLE 81 SEMI-AUTONOMOUS & AUTONOMOUS TRUCKS AND BUSES MARKET BY SENSOR TYPE, 2031–2035 (THOUSAND UNITS)
               TABLE 82 SEMI-AUTONOMOUS & AUTONOMOUS TRUCKS AND BUSES MARKET, BY SENSOR TYPE, 2019–2023 (USD MILLION)
               TABLE 83 SEMI-AUTONOMOUS & AUTONOMOUS TRUCKS AND BUSES MARKET, BY SENSOR TYPE, 2024–2030 (USD MILLION)
               TABLE 84 SEMI-AUTONOMOUS & AUTONOMOUS TRUCKS AND BUSES MARKET, BY SENSOR TYPE, 2031–2035 (USD MILLION)
     10.2 CAMERAS 
             10.2.1 RISING AWARENESS OF SAFETY AMONG CONSUMERS TO DRIVE MARKET
                       FIGURE 56 CAMERA UNITS IN SEMI-AUTONOMOUS AND AUTONOMOUS VEHICLES
                       TABLE 85 CAMERAS: SEMI-AUTONOMOUS & AUTONOMOUS TRUCKS AND BUSES MARKET, BY REGION, 2019–2023 (THOUSAND UNITS)
                       TABLE 86 CAMERAS: SEMI-AUTONOMOUS & AUTONOMOUS TRUCKS AND BUSES MARKET, BY REGION, 2024–2030 (THOUSAND UNITS)
                       TABLE 87 CAMERAS: SEMI-AUTONOMOUS & AUTONOMOUS TRUCKS AND BUSES MARKET, BY REGION, 2031–2035 (THOUSAND UNITS)
                       TABLE 88 CAMERAS: SEMI-AUTONOMOUS & AUTONOMOUS TRUCKS AND BUSES MARKET, BY REGION, 2019–2023 (USD MILLION)
                       TABLE 89 CAMERAS: SEMI-AUTONOMOUS & AUTONOMOUS TRUCKS AND BUSES MARKET, BY REGION, 2024–2030 (USD MILLION)
                       TABLE 90 CAMERAS: SEMI-AUTONOMOUS & AUTONOMOUS TRUCKS AND BUSES MARKET, BY REGION, 2031–2035 (USD MILLION)
     10.3 LIDAR 
             10.3.1 GROWING FOCUS ON IMPROVED PERCEPTION AND NIGHT CONTROL FEATURES TO DRIVE MARKET
                       TABLE 91 LIDAR: SEMI-AUTONOMOUS & AUTONOMOUS TRUCKS AND BUSES MARKET, BY REGION, 2019–2023 (THOUSAND UNITS)
                       TABLE 92 LIDAR: SEMI-AUTONOMOUS & AUTONOMOUS TRUCKS AND BUSES MARKET, BY REGION, 2024–2030 (THOUSAND UNITS)
                       TABLE 93 LIDAR: SEMI-AUTONOMOUS & AUTONOMOUS TRUCKS AND BUSES MARKET, BY REGION, 2031–2035 (THOUSAND UNITS)
                       TABLE 94 LIDAR: SEMI-AUTONOMOUS & AUTONOMOUS TRUCKS AND BUSES MARKET, BY REGION, 2019–2023 (USD MILLION)
                       TABLE 95 LIDAR: SEMI-AUTONOMOUS & AUTONOMOUS TRUCKS AND BUSES MARKET, BY REGION, 2024–2030 (USD MILLION)
                       TABLE 96 LIDAR: SEMI-AUTONOMOUS & AUTONOMOUS TRUCKS AND BUSES MARKET, BY REGION, 2031–2035 (USD MILLION)
     10.4 RADAR SENSORS 
             10.4.1 ADVANCEMENTS IN 4D IMAGING RADAR TECHNOLOGY TO DRIVE MARKET
                       TABLE 97 RADAR SENSORS: SEMI-AUTONOMOUS & AUTONOMOUS TRUCKS AND BUSES MARKET, BY REGION, 2019–2023 (THOUSAND UNITS)
                       TABLE 98 RADAR SENSORS: SEMI-AUTONOMOUS & AUTONOMOUS TRUCKS AND BUSES MARKET, BY REGION, 2024–2030 (THOUSAND UNITS)
                       TABLE 99 RADAR SENSORS: SEMI-AUTONOMOUS & AUTONOMOUS TRUCKS AND BUSES MARKET, BY REGION, 2031–2035 (THOUSAND UNITS)
                       TABLE 100 RADAR SENSORS: SEMI-AUTONOMOUS & AUTONOMOUS TRUCKS AND BUSES MARKET, BY REGION, 2019–2023 (USD MILLION)
                       TABLE 101 RADAR SENSORS: SEMI-AUTONOMOUS & AUTONOMOUS TRUCKS AND BUSES MARKET, BY REGION, 2024–2030 (USD MILLION)
                       TABLE 102 RADAR SENSORS: SEMI-AUTONOMOUS & AUTONOMOUS TRUCKS AND BUSES MARKET, BY REGION, 2031–2035 (USD MILLION)
     10.5 ULTRASONIC SENSORS 
             10.5.1 INCREASING ADOPTION OF INTELLIGENT PARKING ASSISTANCE, BLIND SPOT DETECTION, AND LANE DEPARTURE FUNCTIONS TO DRIVE MARKET
                       TABLE 103 ULTRASONIC SENSORS: SEMI-AUTONOMOUS & AUTONOMOUS TRUCKS AND BUSES MARKET, BY REGION, 2019–2023 (THOUSAND UNITS)
                       TABLE 104 ULTRASONIC SENSORS: SEMI-AUTONOMOUS & AUTONOMOUS TRUCKS AND BUSES MARKET, BY REGION, 2024–2030 (THOUSAND UNITS)
                       TABLE 105 ULTRASONIC SENSORS: SEMI-AUTONOMOUS & AUTONOMOUS TRUCKS AND BUSES MARKET, BY REGION, 2031–2035 (THOUSAND UNITS)
                       TABLE 106 ULTRASONIC SENSORS: SEMI-AUTONOMOUS & AUTONOMOUS TRUCKS AND BUSES MARKET, BY REGION, 2019–2023 (USD MILLION)
                       TABLE 107 ULTRASONIC SENSORS: SEMI-AUTONOMOUS & AUTONOMOUS TRUCKS AND BUSES MARKET, BY REGION, 2024–2030 (USD MILLION)
                       TABLE 108 ULTRASONIC SENSORS: SEMI-AUTONOMOUS & AUTONOMOUS TRUCKS AND BUSES MARKET, BY REGION, 2031–2035 (USD MILLION)
     10.6 KEY PRIMARY INSIGHTS 
 
11 SEMI-AUTONOMOUS & AUTONOMOUS TRUCKS AND BUSES MARKET, BY VEHICLE CLASS (Page No. - 173)
     11.1 INTRODUCTION 
               FIGURE 57 SEMI-AUTONOMOUS & AUTONOMOUS TRUCKS AND BUSES MARKET, BY VEHICLE CLASS, 2024–2035 (THOUSAND UNITS)
               TABLE 109 SEMI-AUTONOMOUS & AUTONOMOUS TRUCKS AND BUSES MARKET, BY VEHICLE CLASS, 2019–2023 (THOUSAND UNITS)
               TABLE 110 SEMI-AUTONOMOUS & AUTONOMOUS TRUCKS AND BUSES MARKET, BY VEHICLE CLASS, 2024–2030 (THOUSAND UNITS)
               TABLE 111 SEMI-AUTONOMOUS & AUTONOMOUS TRUCKS AND BUSES MARKET, BY VEHICLE CLASS, 2031–2035 (THOUSAND UNITS)
     11.2 CLASS 1–3 
             11.2.1 SURGE IN URBANIZATION TO DRIVE MARKET
                       TABLE 112 CLASS 1–3: SEMI-AUTONOMOUS & AUTONOMOUS TRUCKS AND BUSES MARKET, BY REGION, 2019–2023 (THOUSAND UNITS)
                       TABLE 113 CLASS 1–3: SEMI-AUTONOMOUS & AUTONOMOUS TRUCKS AND BUSES MARKET, BY REGION, 2024–2030 (THOUSAND UNITS)
                       TABLE 114 CLASS 1–3: SEMI-AUTONOMOUS & AUTONOMOUS TRUCKS AND BUSES MARKET, BY REGION, 2031–2035 (THOUSAND UNITS)
     11.3 CLASS 4–6 
             11.3.1 GROWING FOCUS ON IMPROVED DRIVER COMFORT AND FLEET MANAGEMENT TO DRIVE MARKET
                       TABLE 115 CLASS 4–6: SEMI-AUTONOMOUS & AUTONOMOUS TRUCKS AND BUSES MARKET, BY REGION, 2019–2023 (THOUSAND UNITS)
                       TABLE 116 CLASS 4–6: SEMI-AUTONOMOUS & AUTONOMOUS TRUCKS AND BUSES MARKET, BY REGION, 2024–2030 (THOUSAND UNITS)
                       TABLE 117 CLASS 4–6: SEMI-AUTONOMOUS & AUTONOMOUS TRUCKS AND BUSES MARKET, BY REGION, 2031–2035 (THOUSAND UNITS)
     11.4 CLASS 7–8 
             11.4.1 INCREASING NEED FOR HIGHER LOAD-CARRYING CAPACITY IN LONG HAUL TRANSPORTATION TO DRIVE MARKET
                       TABLE 118 CLASS 7–8: SEMI-AUTONOMOUS & AUTONOMOUS TRUCKS AND BUSES MARKET, BY REGION, 2019–2023 (THOUSAND UNITS)
                       TABLE 119 CLASS 7–8: SEMI-AUTONOMOUS & AUTONOMOUS TRUCKS AND BUSES MARKET, BY REGION, 2024–2030 (THOUSAND UNITS)
                       TABLE 120 CLASS 7–8: SEMI-AUTONOMOUS & AUTONOMOUS TRUCKS AND BUSES MARKET, BY REGION, 2031–2035 (USD MILLION)
     11.5 KEY INDUSTRY INSIGHTS 
 
12 SEMI-AUTONOMOUS & AUTONOMOUS TRUCKS AND BUSES MARKET, BY VEHICLE TYPE (Page No. - 182)
     12.1 INTRODUCTION 
               FIGURE 58 SEMI-AUTONOMOUS & AUTONOMOUS TRUCKS AND BUSES MARKET, BY VEHICLE TYPE, 2024–2035 (USD MILLION)
               TABLE 121 SEMI-AUTONOMOUS & AUTONOMOUS TRUCKS AND BUSES MARKET, BY VEHICLE TYPE, 2019–2023 (THOUSAND UNITS)
               TABLE 122 SEMI-AUTONOMOUS & AUTONOMOUS TRUCKS AND BUSES MARKET, BY VEHICLE TYPE, 2024–2030 (THOUSAND UNITS)
               TABLE 123 SEMI-AUTONOMOUS & AUTONOMOUS TRUCKS AND BUSES MARKET, BY VEHICLE TYPE, 2031–2035 (THOUSAND UNITS)
               TABLE 124 SEMI-AUTONOMOUS & AUTONOMOUS TRUCKS AND BUSES MARKET, BY VEHICLE TYPE, 2019–2023 (USD MILLION)
               TABLE 125 SEMI-AUTONOMOUS & AUTONOMOUS TRUCKS AND BUSES MARKET, BY VEHICLE TYPE, 2024–2030 (USD MILLION)
               TABLE 126 SEMI-AUTONOMOUS & AUTONOMOUS TRUCKS AND BUSES MARKET, BY VEHICLE TYPE, 2031–2035 (USD MILLION)
     12.2 BUSES 
             12.2.1 GROWING CONCERNS ABOUT TRAFFIC CONGESTION AND AIR POLLUTION TO DRIVE MARKET
                       TABLE 127 BUSES: SEMI-AUTONOMOUS & AUTONOMOUS TRUCKS AND BUSES MARKET, BY REGION, 2019–2023 (THOUSAND UNITS)
                       TABLE 128 BUSES: SEMI-AUTONOMOUS & AUTONOMOUS TRUCKS AND BUSES MARKET, BY REGION, 2024–2030 (THOUSAND UNITS)
                       TABLE 129 BUSES: SEMI-AUTONOMOUS & AUTONOMOUS TRUCKS AND BUSES MARKET, BY REGION, 2031–2035 (THOUSAND UNITS)
                       TABLE 130 BUSES: SEMI-AUTONOMOUS & AUTONOMOUS TRUCKS AND BUSES MARKET, BY REGION, 2019–2023 (USD MILLION)
                       TABLE 131 BUSES: SEMI-AUTONOMOUS & AUTONOMOUS TRUCKS AND BUSES MARKET, BY REGION, 2024–2030 (USD MILLION)
                       TABLE 132 BUSES: SEMI-AUTONOMOUS & AUTONOMOUS TRUCKS AND BUSES MARKET, BY REGION, 2031–2035 (USD MILLION)
     12.3 TRUCKS 
             12.3.1 RISING FOCUS ON EFFICIENCY AND SAFETY IN LOGISTICS SECTOR TO DRIVE MARKET
                       TABLE 133 TRUCKS: SEMI-AUTONOMOUS & AUTONOMOUS TRUCKS AND BUSES MARKET, BY REGION, 2019–2023 (THOUSAND UNITS)
                       TABLE 134 TRUCKS: SEMI-AUTONOMOUS AND AUTONOMOUS TRUCKS AND BUSES MARKET, BY REGION, 2024–2030 (THOUSAND UNITS)
                       TABLE 135 TRUCKS: SEMI-AUTONOMOUS & AUTONOMOUS TRUCKS AND BUSES MARKET, BY REGION, 2031–2035 (THOUSAND UNITS)
                       TABLE 136 TRUCKS: SEMI-AUTONOMOUS & AUTONOMOUS TRUCKS AND BUSES MARKET, BY REGION, 2019–2023 (USD MILLION)
                       TABLE 137 TRUCKS: SEMI-AUTONOMOUS & AUTONOMOUS TRUCKS AND BUSES MARKET, BY REGION, 2024–2030 (USD MILLION)
                       TABLE 138 TRUCKS: SEMI-AUTONOMOUS & AUTONOMOUS TRUCKS AND BUSES MARKET, BY REGION, 2031–2035 (USD MILLION)
     12.4 KEY INDUSTRY INSIGHTS 
 
13 SEMI-AUTONOMOUS & AUTONOMOUS TRUCKS AND BUSES MARKET, BY REGION (Page No. - 191)
     13.1 INTRODUCTION 
               FIGURE 59 SEMI-AUTONOMOUS & AUTONOMOUS TRUCKS AND BUSES MARKET, BY REGION, 2024–2035 (USD MILLION)
               TABLE 139 SEMI-AUTONOMOUS & AUTONOMOUS TRUCKS AND BUSES MARKET, BY REGION, 2019–2023 (THOUSAND UNITS)
               TABLE 140 SEMI-AUTONOMOUS & AUTONOMOUS TRUCKS AND BUSES MARKET, BY REGION, 2024–2030 (THOUSAND UNITS)
               TABLE 141 SEMI-AUTONOMOUS & AUTONOMOUS TRUCKS AND BUSES MARKET, BY REGION, 2031–2035 (THOUSAND UNITS)
               TABLE 142 SEMI-AUTONOMOUS & AUTONOMOUS TRUCKS AND BUSES MARKET, BY REGION, 2019–2023 (USD MILLION)
               TABLE 143 SEMI-AUTONOMOUS & AUTONOMOUS TRUCKS AND BUSES MARKET, BY REGION, 2024–2030 (USD MILLION)
               TABLE 144 SEMI-AUTONOMOUS & AUTONOMOUS TRUCKS AND BUSES MARKET, BY REGION, 2031–2035 (USD MILLION)
     13.2 ASIA PACIFIC 
             13.2.1 RECESSION IMPACT ANALYSIS
                       FIGURE 60 ASIA PACIFIC: SEMI-AUTONOMOUS & AUTONOMOUS TRUCKS AND BUSES MARKET SNAPSHOT
                       TABLE 145 ASIA PACIFIC: SEMI-AUTONOMOUS & AUTONOMOUS TRUCKS AND BUSES MARKET, BY COUNTRY, 2019–2023 (THOUSAND UNITS)
                       TABLE 146 ASIA PACIFIC: SEMI-AUTONOMOUS & AUTONOMOUS TRUCKS AND BUSES MARKET, BY COUNTRY, 2024–2030 (THOUSAND UNITS)
                       TABLE 147 ASIA PACIFIC: SEMI-AUTONOMOUS & AUTONOMOUS TRUCKS AND BUSES MARKET, BY COUNTRY, 2031–2035 (THOUSAND UNITS)
                       TABLE 148 ASIA PACIFIC: SEMI-AUTONOMOUS & AUTONOMOUS TRUCKS AND BUSES MARKET, BY COUNTRY, 2019–2023 (USD MILLION)
                       TABLE 149 ASIA PACIFIC: SEMI-AUTONOMOUS & AUTONOMOUS TRUCKS AND BUSES MARKET, BY COUNTRY, 2024–2030 (USD MILLION)
                       TABLE 150 ASIA PACIFIC: SEMI-AUTONOMOUS & AUTONOMOUS TRUCKS AND BUSES MARKET, BY COUNTRY, 2031–2035 (USD MILLION)
             13.2.2 CHINA
                       13.2.2.1 Increasing focus on vehicle safety norms to drive market
                                   TABLE 151 CHINA: SEMI-AUTONOMOUS & AUTONOMOUS BUSES AND TRUCK MARKET, BY VEHICLE TYPE, 2019–2023 (THOUSAND UNITS)
                                   TABLE 152 CHINA: SEMI-AUTONOMOUS & AUTONOMOUS TRUCKS AND BUSES MARKET, BY VEHICLE TYPE, 2024–2030 (THOUSAND UNITS)
                                   TABLE 153 CHINA: SEMI-AUTONOMOUS & AUTONOMOUS TRUCKS AND BUSES MARKET, BY VEHICLE TYPE, 2031–2035 (THOUSAND UNITS)
                                   TABLE 154 CHINA: SEMI-AUTONOMOUS & AUTONOMOUS TRUCKS AND BUSES MARKET, BY VEHICLE TYPE, 2019–2023 (USD MILLION)
                                   TABLE 155 CHINA: SEMI-AUTONOMOUS & AUTONOMOUS TRUCKS AND BUSES MARKET, BY VEHICLE TYPE, 2024–2030 (USD MILLION)
                                   TABLE 156 CHINA: SEMI-AUTONOMOUS & AUTONOMOUS TRUCKS AND BUSES MARKET, BY VEHICLE TYPE, 2031–2035 (USD MILLION)
             13.2.3 JAPAN
                       13.2.3.1 Favorable government policies to drive market
                                   TABLE 157 JAPAN: SEMI-AUTONOMOUS & AUTONOMOUS TRUCKS AND BUSES MARKET, BY VEHICLE TYPE, 2019–2023 (THOUSAND UNITS)
                                   TABLE 158 JAPAN: SEMI-AUTONOMOUS & AUTONOMOUS TRUCKS AND BUSES MARKET, BY VEHICLE TYPE, 2024–2030 (THOUSAND UNITS)
                                   TABLE 159 JAPAN: SEMI-AUTONOMOUS & AUTONOMOUS TRUCKS AND BUSES MARKET, BY VEHICLE TYPE, 2031–2035 (THOUSAND UNITS)
                                   TABLE 160 JAPAN: SEMI-AUTONOMOUS & AUTONOMOUS TRUCKS AND BUSES MARKET, BY VEHICLE TYPE, 2019–2023 (USD MILLION)
                                   TABLE 161 JAPAN: SEMI-AUTONOMOUS & AUTONOMOUS TRUCKS AND BUSES MARKET, BY VEHICLE TYPE, 2024–2030 (USD MILLION)
                                   TABLE 162 JAPAN: SEMI-AUTONOMOUS & AUTONOMOUS TRUCKS AND BUSES MARKET, BY VEHICLE TYPE, 2031–2035 (USD MILLION)
             13.2.4 INDIA
                       13.2.4.1 Growing urbanization and infrastructure development to drive market
                                   TABLE 163 INDIA: SEMI-AUTONOMOUS & AUTONOMOUS TRUCKS AND BUSES MARKET, BY VEHICLE TYPE, 2019–2023 (THOUSAND UNITS)
                                   TABLE 164 INDIA: SEMI-AUTONOMOUS & AUTONOMOUS TRUCKS AND BUSES MARKET, BY VEHICLE TYPE, 2024–2030 (THOUSAND UNITS)
                                   TABLE 165 INDIA: SEMI-AUTONOMOUS & AUTONOMOUS TRUCKS AND BUSES MARKET, BY VEHICLE TYPE, 2031–2035 (THOUSAND UNITS)
                                   TABLE 166 INDIA: SEMI-AUTONOMOUS & AUTONOMOUS TRUCKS AND BUSES MARKET, BY VEHICLE TYPE, 2019–2023 (USD MILLION)
                                   TABLE 167 INDIA: SEMI-AUTONOMOUS & AUTONOMOUS TRUCKS AND BUSES MARKET, BY VEHICLE TYPE, 2024–2030 (USD MILLION)
                                   TABLE 168 INDIA: SEMI-AUTONOMOUS & AUTONOMOUS TRUCKS AND BUSES MARKET, BY VEHICLE TYPE, 2031–2035 (USD MILLION)
             13.2.5 SOUTH KOREA
                       13.2.5.1 Booming smart city initiatives to drive market
                                   TABLE 169 SOUTH KOREA: SEMI-AUTONOMOUS & AUTONOMOUS TRUCKS AND BUSES MARKET, BY VEHICLE TYPE, 2019–2023 (THOUSAND UNITS)
                                   TABLE 170 SOUTH KOREA: SEMI-AUTONOMOUS & AUTONOMOUS TRUCKS AND BUSES MARKET, BY VEHICLE TYPE, 2024–2030 (THOUSAND UNITS)
                                   TABLE 171 SOUTH KOREA: SEMI-AUTONOMOUS & AUTONOMOUS TRUCKS AND BUSES MARKET, BY VEHICLE TYPE, 2031–2035 (THOUSAND UNITS)
                                   TABLE 172 SOUTH KOREA: SEMI-AUTONOMOUS & AUTONOMOUS TRUCKS AND BUSES MARKET, BY VEHICLE TYPE, 2019–2023 (USD MILLION)
                                   TABLE 173 SOUTH KOREA: SEMI-AUTONOMOUS & AUTONOMOUS TRUCKS AND BUSES MARKET, BY VEHICLE TYPE, 2024–2030 (USD MILLION)
                                   TABLE 174 SOUTH KOREA: SEMI-AUTONOMOUS & AUTONOMOUS TRUCKS AND BUSES MARKET, BY VEHICLE TYPE, 2031–2035 (USD MILLION)
     13.3 EUROPE 
             13.3.1 RECESSION IMPACT ANALYSIS
                       FIGURE 61 EUROPE: SEMI-AUTONOMOUS & AUTONOMOUS TRUCKS AND BUSES MARKET, BY COUNTRY, 2024–2035 (USD MILLION)
                       TABLE 175 EUROPE: SEMI-AUTONOMOUS & AUTONOMOUS TRUCKS AND BUSES MARKET, BY COUNTRY, 2019–2023 (THOUSAND UNITS)
                       TABLE 176 EUROPE: SEMI-AUTONOMOUS & AUTONOMOUS TRUCKS AND BUSES MARKET, BY COUNTRY, 2024–2030 (THOUSAND UNITS)
                       TABLE 177 EUROPE: SEMI-AUTONOMOUS & AUTONOMOUS TRUCKS AND BUSES MARKET, BY COUNTRY, 2031–2035 (THOUSAND UNITS)
                       TABLE 178 EUROPE: SEMI-AUTONOMOUS & AUTONOMOUS TRUCKS AND BUSES MARKET, BY COUNTRY, 2019–2023 (USD MILLION)
                       TABLE 179 EUROPE: SEMI-AUTONOMOUS & AUTONOMOUS TRUCKS AND BUSES MARKET, BY COUNTRY, 2024–2030 (USD MILLION)
                       TABLE 180 EUROPE: SEMI-AUTONOMOUS & AUTONOMOUS TRUCKS AND BUSES MARKET, BY COUNTRY, 2031–2035 (USD MILLION)
             13.3.2 FRANCE
                       13.3.2.1 Surge in adoption of autonomous shuttles to drive market
                                   TABLE 181 FRANCE: SEMI-AUTONOMOUS & AUTONOMOUS TRUCKS AND BUSES MARKET, BY VEHICLE TYPE, 2019–2023 (THOUSAND UNITS)
                                   TABLE 182 FRANCE: SEMI-AUTONOMOUS & AUTONOMOUS TRUCKS AND BUSES MARKET, BY VEHICLE TYPE, 2024–2030 (THOUSAND UNITS)
                                   TABLE 183 FRANCE: SEMI-AUTONOMOUS & AUTONOMOUS TRUCKS AND BUSES MARKET, BY VEHICLE TYPE, 2031–2035 (THOUSAND UNITS)
                                   TABLE 184 FRANCE: SEMI-AUTONOMOUS & AUTONOMOUS TRUCKS AND BUSES MARKET, BY VEHICLE TYPE, 2019–2023 (USD MILLION)
                                   TABLE 185 FRANCE: SEMI-AUTONOMOUS & AUTONOMOUS TRUCKS AND BUSES MARKET, BY VEHICLE TYPE, 2024–2030 (USD MILLION)
                                   TABLE 186 FRANCE: SEMI-AUTONOMOUS & AUTONOMOUS TRUCKS AND BUSES MARKET, BY VEHICLE TYPE, 2031–2035 (USD MILLION)
             13.3.3 GERMANY
                       13.3.3.1 Presence of leading OEMs to drive market
                                   TABLE 187 GERMANY: SEMI-AUTONOMOUS & AUTONOMOUS TRUCKS AND BUSES MARKET, BY VEHICLE TYPE, 2019–2023 (THOUSAND UNITS)
                                   TABLE 188 GERMANY: SEMI-AUTONOMOUS & AUTONOMOUS TRUCKS AND BUSES MARKET, BY VEHICLE TYPE, 2024–2030 (THOUSAND UNITS)
                                   TABLE 189 GERMANY: SEMI-AUTONOMOUS & AUTONOMOUS TRUCKS AND BUSES MARKET, BY VEHICLE TYPE, 2031–2035 (THOUSAND UNITS)
                                   TABLE 190 GERMANY: SEMI-AUTONOMOUS & AUTONOMOUS TRUCKS AND BUSES MARKET, BY VEHICLE TYPE, 2019–2023 (USD MILLION)
                                   TABLE 191 GERMANY: SEMI-AUTONOMOUS & AUTONOMOUS TRUCKS AND BUSES MARKET, BY VEHICLE TYPE, 2024–2030 (USD MILLION)
                                   TABLE 192 GERMANY: SEMI-AUTONOMOUS & AUTONOMOUS TRUCKS AND BUSES MARKET, BY VEHICLE TYPE, 2031–2035 (USD MILLION)
             13.3.4 ITALY
                       13.3.4.1 Rising adoption of smart mobility solutions to drive market
                                   TABLE 193 ITALY: SEMI-AUTONOMOUS & AUTONOMOUS TRUCKS AND BUSES MARKET, BY VEHICLE TYPE, 2019–2023 (THOUSAND UNITS)
                                   TABLE 194 ITALY: SEMI-AUTONOMOUS & AUTONOMOUS TRUCKS AND BUSES MARKET, BY VEHICLE TYPE, 2024–2030 (THOUSAND UNITS)
                                   TABLE 195 ITALY: SEMI-AUTONOMOUS & AUTONOMOUS TRUCKS AND BUSES MARKET, BY VEHICLE TYPE, 2031–2035 (THOUSAND UNITS)
                                   TABLE 196 ITALY: SEMI-AUTONOMOUS & AUTONOMOUS TRUCKS AND BUSES MARKET, BY VEHICLE TYPE, 2019–2023 (USD MILLION)
                                   TABLE 197 ITALY: SEMI-AUTONOMOUS & AUTONOMOUS TRUCKS AND BUSES MARKET, BY VEHICLE TYPE, 2024–2030 (USD MILLION)
                                   TABLE 198 ITALY: SEMI-AUTONOMOUS & AUTONOMOUS TRUCKS AND BUSES MARKET, BY VEHICLE TYPE, 2031–2035 (USD MILLION)
             13.3.5 SPAIN
                       13.3.5.1 Growing focus on L4 autonomy to drive market
                                   TABLE 199 SPAIN: SEMI-AUTONOMOUS & AUTONOMOUS TRUCKS AND BUSES MARKET, BY VEHICLE TYPE, 2019–2023 (THOUSAND UNITS)
                                   TABLE 200 SPAIN: SEMI-AUTONOMOUS & AUTONOMOUS TRUCKS AND BUSES MARKET, BY VEHICLE TYPE, 2024–2030 (THOUSAND UNITS)
                                   TABLE 201 SPAIN: SEMI-AUTONOMOUS & AUTONOMOUS TRUCKS AND BUSES MARKET, BY VEHICLE TYPE, 2031–2035 (THOUSAND UNITS)
                                   TABLE 202 SPAIN: SEMI-AUTONOMOUS & AUTONOMOUS TRUCKS AND BUSES MARKET, BY VEHICLE TYPE, 2019–2023 (USD MILLION)
                                   TABLE 203 SPAIN: SEMI-AUTONOMOUS & AUTONOMOUS TRUCKS AND BUSES MARKET, BY VEHICLE TYPE, 2024–2030 (USD MILLION)
                                   TABLE 204 SPAIN: SEMI-AUTONOMOUS & AUTONOMOUS TRUCKS AND BUSES MARKET, BY VEHICLE TYPE, 2031–2035 (USD MILLION)
             13.3.6 UK
                       13.3.6.1 Surge in production of autonomous buses and trucks to drive market
                                   TABLE 205 UK: SEMI-AUTONOMOUS & AUTONOMOUS TRUCKS AND BUSES MARKET, BY VEHICLE TYPE, 2019–2023 (THOUSAND UNITS)
                                   TABLE 206 UK: SEMI-AUTONOMOUS & AUTONOMOUS TRUCKS AND BUSES MARKET, BY VEHICLE TYPE, 2024–2030 (THOUSAND UNITS)
                                   TABLE 207 UK: SEMI-AUTONOMOUS & AUTONOMOUS TRUCKS AND BUSES MARKET, BY VEHICLE TYPE, 2031–2035 (THOUSAND UNITS)
                                   TABLE 208 UK: SEMI-AUTONOMOUS & AUTONOMOUS TRUCKS AND BUSES MARKET, BY VEHICLE TYPE, 2019–2023 (USD MILLION)
                                   TABLE 209 UK: SEMI-AUTONOMOUS & AUTONOMOUS TRUCKS AND BUSES MARKET, BY VEHICLE TYPE, 2024–2030 (USD MILLION)
                                   TABLE 210 UK: SEMI-AUTONOMOUS & AUTONOMOUS TRUCKS AND BUSES MARKET, BY VEHICLE TYPE, 2031–2035 (USD MILLION)
     13.4 NORTH AMERICA 
             13.4.1 RECESSION IMPACT ANALYSIS
                       FIGURE 62 NORTH AMERICA: SEMI-AUTONOMOUS & AUTONOMOUS TRUCKS AND BUSES MARKET SNAPSHOT
                       TABLE 211 NORTH AMERICA: SEMI-AUTONOMOUS & AUTONOMOUS TRUCKS AND BUSES MARKET, BY COUNTRY, 2019–2023 (THOUSAND UNITS)
                       TABLE 212 NORTH AMERICA: SEMI-AUTONOMOUS & AUTONOMOUS TRUCKS AND BUSES MARKET, BY COUNTRY, 2024–2030 (THOUSAND UNITS)
                       TABLE 213 NORTH AMERICA: SEMI-AUTONOMOUS & AUTONOMOUS TRUCKS AND BUSES MARKET, BY COUNTRY, 2031–2035 (THOUSAND UNITS)
                       TABLE 214 NORTH AMERICA: SEMI-AUTONOMOUS & AUTONOMOUS TRUCKS AND BUSES MARKET, BY COUNTRY, 2019–2023 (USD MILLION)
                       TABLE 215 NORTH AMERICA: SEMI-AUTONOMOUS & AUTONOMOUS TRUCKS AND BUSES MARKET, BY COUNTRY, 2024–2030 (USD MILLION)
                       TABLE 216 NORTH AMERICA: SEMI-AUTONOMOUS & AUTONOMOUS TRUCKS AND BUSES MARKET, BY COUNTRY, 2031–2035 (USD MILLION)
             13.4.2 US
                       13.4.2.1 Growing R&D efforts by leading technology companies to drive market
                                   TABLE 217 US: SEMI-AUTONOMOUS & AUTONOMOUS TRUCKS AND BUSES MARKET, BY VEHICLE TYPE, 2019–2023 (THOUSAND UNITS)
                                   TABLE 218 US: SEMI-AUTONOMOUS & AUTONOMOUS TRUCKS AND BUSES MARKET, BY VEHICLE TYPE, 2024–2030 (THOUSAND UNITS)
                                   TABLE 219 US: SEMI-AUTONOMOUS & AUTONOMOUS TRUCKS AND BUSES MARKET, BY VEHICLE TYPE, 2031–2035 (THOUSAND UNITS)
                                   TABLE 220 US: SEMI-AUTONOMOUS & AUTONOMOUS TRUCKS AND BUSES MARKET, BY VEHICLE TYPE, 2019–2023 (USD MILLION)
                                   TABLE 221 US: SEMI-AUTONOMOUS & AUTONOMOUS TRUCKS AND BUSES MARKET, BY VEHICLE TYPE, 2024–2030 (USD MILLION)
                                   TABLE 222 US: SEMI-AUTONOMOUS & AUTONOMOUS TRUCKS AND BUSES MARKET, BY VEHICLE TYPE, 2031–2035 (USD MILLION)
             13.4.3 CANADA
                       13.4.3.1 Surge in testing of autonomous driving assistant systems to drive market
                                   TABLE 223 CANADA: SEMI-AUTONOMOUS & AUTONOMOUS TRUCKS AND BUSES MARKET, BY VEHICLE TYPE, 2019–2023 (THOUSAND UNITS)
                                   TABLE 224 CANADA: SEMI-AUTONOMOUS & AUTONOMOUS TRUCKS AND BUSES MARKET, BY VEHICLE TYPE, 2024–2030 (THOUSAND UNITS)
                                   TABLE 225 CANADA: SEMI-AUTONOMOUS & AUTONOMOUS TRUCKS AND BUSES MARKET, BY VEHICLE TYPE, 2031–2035 (THOUSAND UNITS)
                                   TABLE 226 CANADA: SEMI-AUTONOMOUS & AUTONOMOUS TRUCKS AND BUSES MARKET, BY VEHICLE TYPE, 2019–2023 (USD MILLION)
                                   TABLE 227 CANADA: SEMI-AUTONOMOUS & AUTONOMOUS TRUCKS AND BUSES MARKET, BY VEHICLE TYPE, 2024–2030 (USD MILLION)
                                   TABLE 228 CANADA: SEMI-AUTONOMOUS & AUTONOMOUS TRUCKS AND BUSES MARKET, BY VEHICLE TYPE, 2031–2035 (USD MILLION)
             13.4.4 MEXICO
                       13.4.4.1 Growing focus on integrating advanced automotive technologies to drive market
     13.5 REST OF THE WORLD 
             13.5.1 RECESSION IMPACT ANALYSIS
                       FIGURE 63 REST OF THE WORLD: SEMI-AUTONOMOUS & AUTONOMOUS TRUCKS AND BUSES MARKET, BY COUNTRY, 2024–2035 (USD MILLION)
                       TABLE 229 REST OF THE WORLD: SEMI-AUTONOMOUS & AUTONOMOUS TRUCKS AND BUSES MARKET, BY COUNTRY, 2019–2023 (THOUSAND UNITS)
                       TABLE 230 REST OF THE WORLD: SEMI-AUTONOMOUS & AUTONOMOUS TRUCKS AND BUSES MARKET, BY COUNTRY, 2024–2030 (THOUSAND UNITS)
                       TABLE 231 REST OF THE WORLD: SEMI-AUTONOMOUS & AUTONOMOUS TRUCKS AND BUSES MARKET, BY COUNTRY, 2031–2035 (THOUSAND UNITS)
                       TABLE 232 REST OF THE WORLD: SEMI-AUTONOMOUS & AUTONOMOUS TRUCKS AND BUSES MARKET, BY COUNTRY, 2019–2023 (USD MILLION)
                       TABLE 233 REST OF THE WORLD: SEMI-AUTONOMOUS & AUTONOMOUS TRUCKS AND BUSES MARKET, BY COUNTRY, 2024–2030 (USD MILLION)
                       TABLE 234 REST OF THE WORLD: SEMI-AUTONOMOUS & AUTONOMOUS TRUCKS AND BUSES MARKET, BY COUNTRY, 2031–2035 (USD MILLION)
             13.5.2 BRAZIL
                       13.5.2.1 Growing integration of semi-autonomous and autonomous technologies in vehicles to drive market
                                   TABLE 235 BRAZIL: SEMI-AUTONOMOUS & AUTONOMOUS TRUCKS AND BUSES MARKET, BY VEHICLE TYPE, 2019–2023 (THOUSAND UNITS)
                                   TABLE 236 BRAZIL: SEMI-AUTONOMOUS & AUTONOMOUS TRUCKS AND BUSES MARKET, BY VEHICLE TYPE, 2024–2030 (THOUSAND UNITS)
                                   TABLE 237 BRAZIL: SEMI-AUTONOMOUS & AUTONOMOUS TRUCKS AND BUSES MARKET, BY VEHICLE TYPE, 2031–2035 (THOUSAND UNITS)
                                   TABLE 238 BRAZIL: SEMI-AUTONOMOUS & AUTONOMOUS BUS AND TRUCK MARKET, BY VEHICLE TYPE, 2019–2023 (USD MILLION)
                                   TABLE 239 BRAZIL: SEMI-AUTONOMOUS & AUTONOMOUS TRUCKS AND BUSES MARKET, BY VEHICLE TYPE, 2024–2030 (USD MILLION)
                                   TABLE 240 BRAZIL: SEMI-AUTONOMOUS & AUTONOMOUS TRUCKS AND BUSES MARKET, BY VEHICLE TYPE, 2031–2035 (USD MILLION)
             13.5.3 RUSSIA
                       13.5.3.1 Increasing construction of manufacturing facilities to drive market
                                   TABLE 241 RUSSIA: SEMI-AUTONOMOUS & AUTONOMOUS TRUCKS AND BUSES MARKET, BY VEHICLE TYPE, 2019–2023 (THOUSAND UNITS)
                                   TABLE 242 RUSSIA: SEMI-AUTONOMOUS & AUTONOMOUS TRUCKS AND BUSES MARKET, BY VEHICLE TYPE, 2024–2030 (THOUSAND UNITS)
                                   TABLE 243 RUSSIA: SEMI-AUTONOMOUS & AUTONOMOUS TRUCKS AND BUSES MARKET, BY VEHICLE TYPE, 2031–2035 (THOUSAND UNITS)
                                   TABLE 244 RUSSIA: SEMI-AUTONOMOUS & AUTONOMOUS TRUCKS AND BUSES MARKET, BY VEHICLE TYPE, 2019–2023 (USD MILLION)
                                   TABLE 245 RUSSIA: SEMI-AUTONOMOUS & AUTONOMOUS TRUCKS AND BUSES MARKET, BY VEHICLE TYPE, 2024–2030 (USD MILLION)
                                   TABLE 246 RUSSIA: SEMI-AUTONOMOUS & AUTONOMOUS TRUCKS AND BUSES MARKET, BY VEHICLE TYPE, 2031–2035 (USD MILLION)
 
14 COMPETITIVE LANDSCAPE (Page No. - 238)
     14.1 INTRODUCTION 
     14.2 KEY PLAYER STRATEGIES 
               TABLE 247 KEY PLAYER STRATEGIES, 2021–2024
     14.3 REVENUE ANALYSIS 
               FIGURE 64 REVENUE ANALYSIS OF OEMS, 2019–2023
               FIGURE 65 REVENUE ANALYSIS OF SOFTWARE PROVIDERS, 2019–2023
     14.4 MARKET RANKING ANALYSIS 
               FIGURE 66 MARKET RANKING OF OEMS, 2024
               FIGURE 67 MARKET RANKING OF SOFTWARE PROVIDERS, 2024
     14.5 COMPANY EVALUATION MATRIX: KEY PLAYERS 
             14.5.1 STARS
             14.5.2 EMERGING LEADERS
             14.5.3 PERVASIVE PLAYERS
             14.5.4 PARTICIPANTS
                       FIGURE 68 SEMI-AUTONOMOUS & AUTONOMOUS TRUCKS AND BUSES MARKET: COMPANY EVALUATION MATRIX (OEMS), 2024
             14.5.5 COMPANY FOOTPRINT
                       FIGURE 69 SEMI-AUTONOMOUS & AUTONOMOUS TRUCKS AND BUSES MARKET: COMPANY FOOTPRINT, 2024
                       TABLE 248 SEMI-AUTONOMOUS & AUTONOMOUS TRUCKS AND BUSES MARKET: VEHICLE TYPE FOOTPRINT, 2024
                       TABLE 249 SEMI-AUTONOMOUS & AUTONOMOUS TRUCKS AND BUSES MARKET: LEVEL OF AUTONOMY FOOTPRINT, 2024
                       TABLE 250 SEMI-AUTONOMOUS & AUTONOMOUS TRUCKS AND BUSES MARKET: REGION FOOTPRINT, 2024
     14.6 COMPANY EVALUATION MATRIX: STARTUPS/SMES 
             14.6.1 PROGRESSIVE COMPANIES
             14.6.2 RESPONSIVE COMPANIES
             14.6.3 DYNAMIC COMPANIES
             14.6.4 STARTING BLOCKS
                       FIGURE 70 SEMI-AUTONOMOUS & AUTONOMOUS TRUCKS AND BUSES MARKET: COMPANY EVALUATION MATRIX (STARTUPS/SMES), 2024
             14.6.5 COMPETITIVE BENCHMARKING
                       TABLE 251 SEMI-AUTONOMOUS & AUTONOMOUS TRUCKS AND BUSES MARKET: KEY STARTUPS/SMES
                       TABLE 252 SEMI-AUTONOMOUS & AUTONOMOUS TRUCKS AND BUSES MARKET: COMPETITIVE BENCHMARKING
     14.7 COMPANY VALUATION AND FINANCIAL METRICS 
               FIGURE 71 COMPANY VALUATION OF OEMS, 2024
               FIGURE 72 COMPANY VALUATION OF SOFTWARE PROVIDERS, 2024
               FIGURE 73 FINANCIAL METRICS OF OEMS, 2024
               FIGURE 74 FINANCIAL METRICS OF SOFTWARE PROVIDERS, 2024
     14.8 BRAND/PRODUCT COMPARISON 
               FIGURE 75 BRAND/PRODUCT COMPARISON
     14.9 COMPETITIVE SCENARIOS AND TRENDS 
             14.9.1 PRODUCT LAUNCHES/DEVELOPMENTS
                       TABLE 253 SEMI-AUTONOMOUS & AUTONOMOUS TRUCKS AND BUSES MARKET: PRODUCT LAUNCHES/DEVELOPMENTS, SEPTEMBER 2021–MAY 2024
             14.9.2 DEALS
                       TABLE 254 SEMI-AUTONOMOUS & AUTONOMOUS TRUCKS AND BUSES MARKET: DEALS, SEPTEMBER 2021–MAY 2024
             14.9.3 EXPANSIONS
                       TABLE 255 SEMI-AUTONOMOUS & AUTONOMOUS TRUCKS AND BUSES MARKET: EXPANSIONS, SEPTEMBER 2021–MAY 2024
             14.9.4 OTHER DEVELOPMENTS
                       TABLE 256 SEMI-AUTONOMOUS & AUTONOMOUS TRUCKS AND BUSES MARKET: OTHER DEVELOPMENTS, SEPTEMBER 2021–MAY 2024
 
15 COMPANY PROFILES (Page No. - 262)
     15.1 ORIGINAL EQUIPMENT MANUFACTURERS 
             15.1.1 AB VOLVO
                       TABLE 257 AB VOLVO: COMPANY OVERVIEW
                       FIGURE 76 AB VOLVO: COMPANY SNAPSHOT
                       TABLE 258 AB VOLVO: PRODUCTS/SOLUTIONS/SERVICES OFFERED
                       TABLE 259 AB VOLVO: PRODUCT LAUNCHES/DEVELOPMENTS
                       TABLE 260 AB VOLVO: DEALS
                       TABLE 261 AB VOLVO: EXPANSIONS
                       TABLE 262 AB VOLVO: OTHER DEVELOPMENTS
             15.1.2 DAIMLER TRUCK AG
                       TABLE 263 DAIMLER TRUCK AG: COMPANY OVERVIEW
                       FIGURE 77 DAIMLER TRUCK AG: COMPANY SNAPSHOT
                       TABLE 264 DAIMLER TRUCK AG: PRODUCTS/SOLUTIONS/SERVICES OFFERED
                       TABLE 265 DAIMLER TRUCK AG: PRODUCT LAUNCHES/DEVELOPMENTS
                       TABLE 266 DAIMLER TRUCK AG: DEALS
                       TABLE 267 DAIMLER TRUCK AG: EXPANSIONS
             15.1.3 MAN TRUCK & BUS SE
                       TABLE 268 MAN TRUCK & BUS SE: COMPANY OVERVIEW
                       FIGURE 78 MAN TRUCK & BUS SE: COMPANY SNAPSHOT
                       FIGURE 79 MAN ROADMAP FOR AUTONOMOUS DRIVING, 2018–2030
                       TABLE 269 MAN TRUCK & BUS SE: PRODUCTS/SOLUTIONS/SERVICES OFFERED
                       TABLE 270 MAN TRUCK & BUS SE: DEALS
                       TABLE 271 MAN TRUCK & BUS SE: EXPANSIONS
                       TABLE 272 MAN TRUCK & BUS SE: OTHER DEVELOPMENTS
             15.1.4 IVECO S.P.A.
                       TABLE 273 IVECO S.P.A.: COMPANY OVERVIEW
                       FIGURE 80 IVECO S.P.A.: COMPANY SNAPSHOT
                       TABLE 274 IVECO S.P.A.: PRODUCTS/SOLUTIONS/SERVICES OFFERED
                       TABLE 275 IVECO S.P.A.: DEALS
                       TABLE 276 IVECO S.P.A.: OTHER DEVELOPMENTS
             15.1.5 PACCAR INC.
                       TABLE 277 PACCAR INC.: COMPANY OVERVIEW
                       FIGURE 81 PACCAR INC.: COMPANY SNAPSHOT
                       TABLE 278 PACCAR INC.: PRODUCTS/SOLUTIONS/SERVICES OFFERED
                       TABLE 279 PACCAR INC.: PRODUCT LAUNCHES/DEVELOPMENTS
                       TABLE 280 PACCAR INC.: DEALS
             15.1.6 HYUNDAI MOTOR CORPORATION
                       TABLE 281 HYUNDAI MOTOR CORPORATION: COMPANY OVERVIEW
                       FIGURE 82 HYUNDAI MOTOR CORPORATION: COMPANY SNAPSHOT
                       TABLE 282 HYUNDAI MOTOR CORPORATION: PRODUCT LAUNCHES/DEVELOPMENTS
     15.2 SOFTWARE PROVIDERS 
             15.2.1 AURORA INNOVATION INC.
                       TABLE 283 AURORA INNOVATION INC.: COMPANY OVERVIEW
                       FIGURE 83 AURORA INNOVATION INC.: COMPANY SNAPSHOT
                       FIGURE 84 AURORA HORIZON ROADMAP
                       TABLE 284 AURORA INNOVATION INC.: PRODUCT LAUNCHES/DEVELOPMENTS
                       TABLE 285 AURORA INNOVATION INC.: DEALS
                       TABLE 286 AURORA INNOVATION INC.: EXPANSIONS
                       TABLE 287 AURORA INNOVATION INC.: OTHER DEVELOPMENTS
             15.2.2 NVIDIA CORPORATION
                       TABLE 288 NVIDIA CORPORATION: COMPANY OVERVIEW
                       FIGURE 85 NVIDIA CORPORATION: COMPANY SNAPSHOT
                       TABLE 289 NVIDIA CORPORATION: PRODUCT LAUNCHES/DEVELOPMENTS
                       TABLE 290 NVIDIA CORPORATION: DEALS
                       TABLE 291 NVIDIA CORPORATION: OTHER DEVELOPMENTS
             15.2.3 PLUSAI, INC.
                       TABLE 292 PLUSAI, INC.: COMPANY OVERVIEW
                       TABLE 293 PLUSAI, INC.: PRODUCT LAUNCHES/DEVELOPMENTS
                       TABLE 294 PLUSAI, INC.: DEALS
                       TABLE 295 PLUSAI, INC.: OTHER DEVELOPMENTS
             15.2.4 CONTINENTAL AG
                       TABLE 296 CONTINENTAL AG: COMPANY OVERVIEW
                       FIGURE 86 CONTINENTAL AG: COMPANY SNAPSHOT
                       TABLE 297 CONTINENTAL AG: PRODUCT LAUNCHES/DEVELOPMENTS
                       TABLE 298 CONTINENTAL AG: DEALS
                       TABLE 299 CONTINENTAL AG: EXPANSIONS
                       TABLE 300 CONTINENTAL AG: OTHER DEVELOPMENTS
             15.2.5 KODIAK ROBOTICS INC.
                       TABLE 301 KODIAK ROBOTICS INC.: COMPANY OVERVIEW
                       TABLE 302 KODIAK ROBOTICS INC.: PRODUCT LAUNCHES/DEVELOPMENTS
                       TABLE 303 KODIAK ROBOTICS INC.: DEALS
                       TABLE 304 KODIAK ROBOTICS INC.: OTHER DEVELOPMENTS
             15.2.6 NAVYA
                       TABLE 305 NAVYA: COMPANY OVERVIEW
                       TABLE 306 NAVYA: PRODUCT LAUNCHES/DEVELOPMENTS
                       TABLE 307 NAVYA: DEALS
                       TABLE 308 NAVYA: OTHER DEVELOPMENTS
     15.3 OTHER PLAYERS 
             15.3.1 YUTONG BUS CO., LTD.
                       TABLE 309 YUTONG BUS CO., LTD.: COMPANY OVERVIEW
             15.3.2 KARSAN
                       TABLE 310 KARSAN: COMPANY OVERVIEW
             15.3.3 XIAMEN KING LONG UNITED AUTOMOTIVE INDUSTRY CO., LTD.
                       TABLE 311 XIAMEN KING LONG UNITED AUTOMOTIVE INDUSTRY CO., LTD.: COMPANY OVERVIEW
             15.3.4 EINRIDE
                       TABLE 312 EINRIDE: COMPANY OVERVIEW
             15.3.5 WERIDE
                       TABLE 313 WERIDE: COMPANY OVERVIEW
             15.3.6 ISUZU MOTORS
                       TABLE 314 ISUZU MOTORS: COMPANY OVERVIEW
             15.3.7 SENSETIME
                       TABLE 315 SENSETIME: COMPANY OVERVIEW
             15.3.8 EASYMILE
                       TABLE 316 EASYMILE: COMPANY OVERVIEW
             15.3.9 SCANIA
                       TABLE 317 SCANIA: COMPANY OVERVIEW
               15.3.10 ZF FRIEDRICHSHAFEN AG
                                   TABLE 318 ZF FRIEDRICHSHAFEN AG: COMPANY OVERVIEW
               15.3.11 UISEE
                                   TABLE 319 UISEE: COMPANY OVERVIEW
               15.3.12 COAST AUTONOMOUS
                                   TABLE 320 COAST AUTONOMOUS: COMPANY OVERVIEW
               15.3.13 NAVISTAR INTERNATIONAL INC.
                                   TABLE 321 NAVISTAR INTERNATIONAL INC.: COMPANY OVERVIEW
               15.3.14 TUSIMPLE HOLDINGS INC.
                                   TABLE 322 TUSIMPLE HOLDINGS INC.: COMPANY OVERVIEW
               15.3.15 ALEXANDER DENNIS LIMITED
                                   TABLE 323 ALEXANDER DENNIS LIMITED: COMPANY OVERVIEW
               15.3.16 TOYOTA MOTOR CORPORATION
                                   TABLE 324 TOYOTA MOTOR CORPORATION: COMPANY OVERVIEW
               15.3.17 TESLA
                                   TABLE 325 TESLA: COMPANY OVERVIEW
               15.3.18 ROBERT BOSCH GMBH
                                   TABLE 326 ROBERT BOSCH GMBH: COMPANY OVERVIEW
 
16 RECOMMENDATIONS BY MARKETSANDMARKETS (Page No. - 336)
     16.1 NORTH AMERICA TO LEAD MARKET 
     16.2 E-COMMERCE TO INCREASE DEMAND FOR AUTONOMOUS TRUCKS 
     16.3 GROWING FOCUS ON AUTONOMOUS SHUTTLES FOR PUBLIC TRANSPORT 
     16.4 CONCLUSION 
 
17 APPENDIX (Page No. - 338)
     17.1 KEY INSIGHTS FROM INDUSTRY EXPERTS 
     17.2 DISCUSSION GUIDE 
     17.3 KNOWLEDGESTORE: MARKETSANDMARKETS’ SUBSCRIPTION PORTAL 
     17.4 CUSTOMIZATION OPTIONS 
             17.4.1 SEMI-AUTONOMOUS & AUTONOMOUS TRUCKS AND BUSES MARKET, BY PROPULSION TYPE AT COUNTRY LEVEL (FOR COUNTRIES NOT COVERED IN THE REPORT)
             17.4.2 SEMI-AUTONOMOUS & AUTONOMOUS TRUCKS AND BUSES MARKET, BY SENSOR TYPE AT COUNTRY LEVEL (FOR COUNTRIES NOT COVERED IN THE REPORT)
             17.4.3 COMPANY INFORMATION
                       17.4.3.1 Profiling of additional market players (Up to 10)
     17.5 RELATED REPORTS 
     17.6 AUTHOR DETAILS 

The research study involved extensive secondary sources, such as company annual reports/presentations, industry association publications, magazine articles, directories, technical handbooks, World Economic Outlook, trade websites, technical articles, and databases, to identify and collect information on the Semi-autonomous & autonomous Trucks and Buses market. Primary sources, such as experts from related industries, automobile OEMs, and suppliers, were interviewed to obtain and verify critical information and assess the growth prospects and market estimations.

Secondary Research

Secondary sources for this research study include corporate filings, such as annual reports, investor presentations, and financial statements; trade, business, and professional associations; whitepapers, marklines, and the OICA (International Organization of Motor Vehicle Manufacturers); certified publications; articles by recognized authors; directories; and databases. Secondary data was collected and analyzed to determine the overall market size, further validated by primary research.

Primary Research

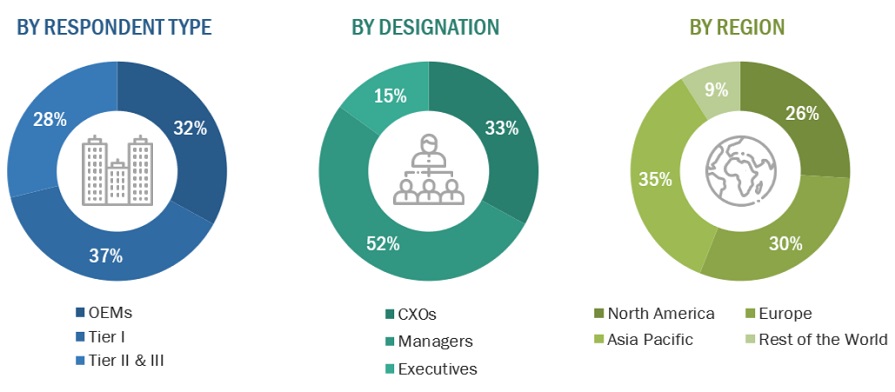
Extensive primary research was conducted after understanding the Semi-autonomous & autonomous Trucks and Buses market scenario through secondary research. Several primary interviews were conducted with market experts from the demand side (vehicle manufacturers, country-level government associations, and trade associations) and the supply side (Semi-autonomous & autonomous Trucks and Buses manufacturers, component providers, and system integrators). The regions considered for the research include North America, Europe, the Asia Pacific, and the Rest of the World. Approximately 17% and 83% of primary interviews were conducted from the demand and supply sides. Primary data was collected through questionnaires, emails, and telephonic interviews. In the canvassing of primaries, various departments within organizations, such as sales, operations, and marketing, were covered to provide a holistic viewpoint in this report.

After interacting with industry experts, brief sessions were conducted with highly experienced independent consultants to reinforce the findings from the primaries. This, along with the in-house subject matter experts’ opinions, led to the findings described in this report.
Semi-Autonomous & Autonomous Trucks and Buses Market  Size, and Share

To know about the assumptions considered for the study, download the pdf brochure

Market Size Estimation

A detailed market estimation approach was followed to estimate and validate the volume and value of the Semi-autonomous & autonomous Trucks and Buses market and other submarkets, as mentioned below.

  • Secondary research identified key players in the semi-autonomous & autonomous Trucks and Buses market. Their global market share was determined through primary and secondary research.
  • The research methodology included studying the annual and quarterly financial reports & regulatory filings of major market players and interviews with industry experts for detailed market insights.
  • All major penetration rates, percentage shares, splits, and breakdowns for the semi-autonomous & autonomous Trucks and Buses market across end users were determined using secondary sources and verified through primary sources.
  • All key macro indicators affecting the revenue growth of the market segments and subsegments were accounted for, viewed in extensive detail, verified through primary research, and analyzed to get the validated and verified quantitative & qualitative data.
  • The gathered market data was consolidated and added with detailed inputs, analyzed, and presented in this report.

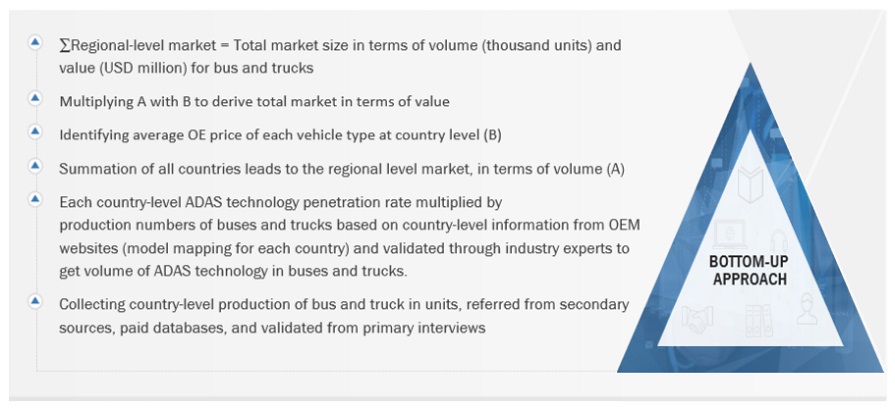
Semi-autonomous & autonomous Trucks and Buses Market Size: Bottom-Up Approach

Semi-Autonomous & Autonomous Trucks and Buses Market  Bottom Up Approach

To know about the assumptions considered for the study, Request for Free Sample Report

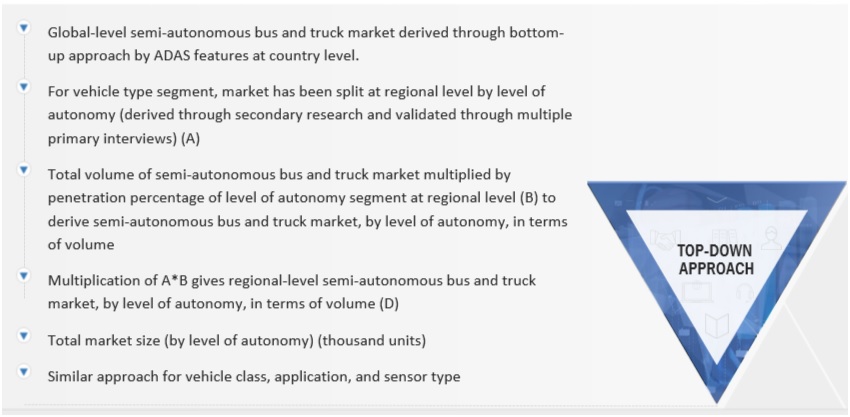
Semi-autonomous & autonomous Trucks and Buses Market Size: Top-Down Approach

Semi-Autonomous & Autonomous Trucks and Buses Market  Top Down Approach

Data Triangulation

After arriving at the overall market size through bottom-up approach, the semi-autonomous and autonomous bus and truck market was split into several segments and subsegments. Where applicable, the data triangulation procedure was employed to complete the overall market engineering process and arrive at the exact market value for key segments and subsegments. The extrapolated market data was triangulated by studying various macro indicators and regional trends from both the demand- and supply-side participants.

Market Definition

Semi-autonomous & autonomous Trucks and Buses Market: Semi-autonomous bus technology requires human intervention to control the vehicle while simultaneously using some of the advanced technologies such as Adaptive Cruise Control (ACC), Autonomous Emergency Braking (AEB), Lane Keep Assist (LKA), Intelligent Park Assist (IPA), Blind Spot Detection (BSD), Traffic Jam Assist (TJA) and highway pilot to reduce the effort required to maneuver the bus. Autonomous (self-driving) bus technology runs an artificial intelligence program that controls the entire bus without human intervention.

Semi-autonomous truck technology requires human intervention to control the vehicle while simultaneously using some advanced technologies such as Adaptive Cruise Control (ACC), Autonomous Emergency Braking (AEB), Lane Assist (LA), Intelligent Park Assist (IPA), Blind Spot Detection (BSD), Traffic Jam Assist (TJA) and highway pilot to reduce the effort required to maneuver the truck. Autonomous (self-driving) truck technology runs an artificial intelligence program that controls the entire truck without human intervention.

Key Stakeholders

  • Automobile Original Equipment Manufacturers (OEMs)
  • Automotive Insurance Providers
  • Automobile Industry (End-use Industry and Regional Automobile Associations)
  • Cybersecurity Providers for Autonomous and Semi-autonomous Buses
  • Legal and Regulatory Authorities
  • Manufacturers of Autonomous and Semi-autonomous Buses
  • Manufacturers of Autonomous and Semi-autonomous Bus Components
  • Raw Material Suppliers
  • Sensor Manufacturers
  • Software Providers
  • Traders, Distributors, and Suppliers

Report Objectives

  • To segment and forecast the size of the semi-autonomous & autonomous trucks and buses market in terms of volume (thousand units) and value (USD million)
  • To define, describe, and forecast the size of the semi-autonomous & autonomous trucks and buses market based on ADAS feature, Application, Vehicle type, Level of Autonomy, Vehicle class, Propulsion type, Sensor type, and region
  • To analyze regional markets for growth trends, prospects, and their contribution to the overall market
    • To provide qualitative insights on the market based on ADAS features [(Adaptive Cruise Control (ACC), Automatic Emergency Braking (AEB), Blind Spot Detection (BSD), Lane Keep Assist (LKA), Intelligent Park Assist (IPA), Traffic Jam Assist (TJA), Highway Pilot (HP)]
    • To segment and forecast the market size, by vehicle type (Buses and Trucks)
    • To segment and forecast the market size, by vehicle class [Class1-Class3, Class4-Class6, and Class7-Class8]
    • To segment and forecast the market size, by Application (Last-mile Delivery Trucks, Mining Trucks, Shuttles, and Intercity/Intracity Buses)
    • To segment and forecast the market size, by Level of Autonomy (L1, L2 and L3, L4, and L5)
    • To segment and forecast the market size, by propulsion type (Diesel, Electric, and Hybrid)
    • To segment and forecast the market size, by sensor type (Cameras, Radars sensors, LiDAR, and Ultrasonic sensors)
  • To forecast the market size by region [North America, Europe, Asia Pacific, and Rest of the World (RoW)]
  • To analyze technological developments impacting the market
  • To provide detailed information about the major factors influencing the market growth (drivers, challenges, restraints, and opportunities)
  • To strategically analyze the market, considering individual growth trends, prospects, and contributions to the total market
  • To study the following concerning the market
    • Value Chain Analysis
    • Ecosystem Analysis
    • Technology Analysis
    • HS Code
    • Case Study Analysis
    • Patent Analysis
    • Regulatory Landscape
    • Key Stakeholders and Buying Criteria
    • Key Conferences and Events
  • To estimate the following with respect to the semi-autonomous and autonomous Trucks and Buses market:
  • Pricing Analysis
    • Key Players, By Vehicle Type
    • By Region
  • Market Ranking Analysis
    • To strategically profile key players and comprehensively analyze their market ranking and core competencies
    • To analyze the impact of the recession on the market
    • To track and analyze competitive developments such as deals, product developments, expansion, and other activities carried out by key industry participants

Available Customizations

With the given market data, MarketsandMarkets offers customizations in accordance to the company’s specific needs.

  • Semi-autonomous & autonomous Trucks and Buses market, by propulsion type at the country level (for countries not covered in the report
  • Semi-autonomous & autonomous Trucks and Buses market, by sensor type at the country level (for countries not covered in the report

Company Information:

  • Profiling of additional market players (Up to 10)
Custom Market Research Services

We will customize the research for you, in case the report listed above does not meet with your exact requirements. Our custom research will comprehensively cover the business information you require to help you arrive at strategic and profitable business decisions.

Request Customization
Report Code
AT 7660
Published ON
Jul, 2024
Choose License Type
BUY NOW
  • SHARE
X
Request Customization
Speak to Analyst
Speak to Analyst
OR FACE-TO-FACE MEETING
PERSONALIZE THIS RESEARCH
  • Triangulate with your Own Data
  • Get Data as per your Format and Definition
  • Gain a Deeper Dive on a Specific Application, Geography, Customer or Competitor
  • Any level of Personalization
REQUEST A FREE CUSTOMIZATION
LET US HELP YOU!
  • What are the Known and Unknown Adjacencies Impacting the Semi-Autonomous & Autonomous Trucks and Buses Market
  • What will your New Revenue Sources be?
  • Who will be your Top Customer; what will make them switch?
  • Defend your Market Share or Win Competitors
  • Get a Scorecard for Target Partners
CUSTOMIZED WORKSHOP REQUEST
  • Call Us
  • +1-888-600-6441 (Corporate office hours)
  • +1-888-600-6441 (US/Can toll free)
  • +44-800-368-9399 (UK office hours)
CONNECT WITH US
ABOUT TRUST ONLINE
©2024 MarketsandMarkets Research Private Ltd. All rights reserved
DMCA.com Protection Status Website Feedback