Drone Services (Drone as a service) Market Size and Growth
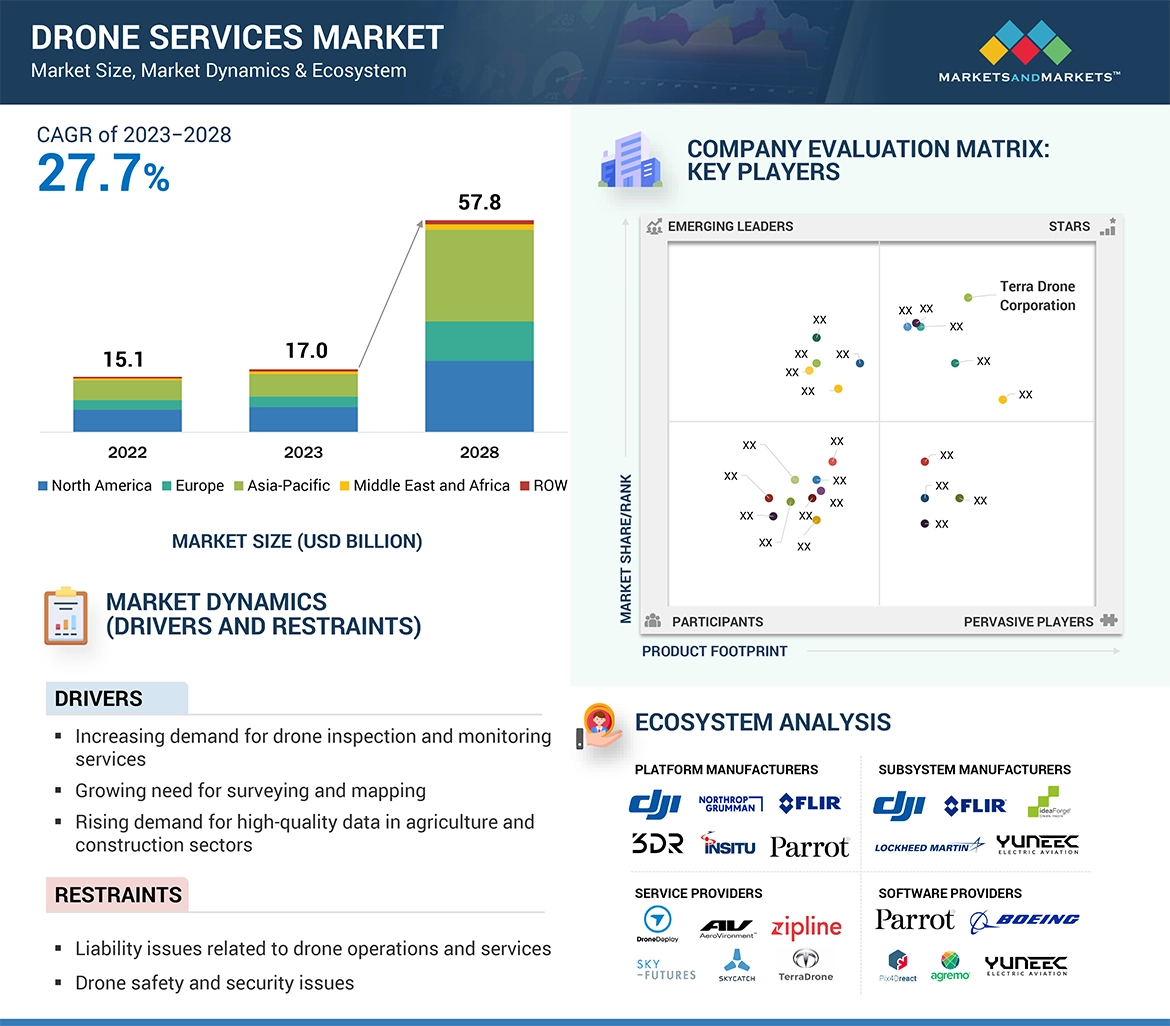
The Global Drone Services Market Size was valued at USD 17.0 billion in 2023 and is estimated to reach USD 57.8 billion by 2028, growing at a CAGR of 27.7% during the forecast period.
The drone market size continues to expand as the drone services industry evolves, offering a diverse range of services for both remotely controlled and autonomously flown drones. This industry integrates software-controlled flight plans into drones' embedded systems, making it a critical component in sectors like agriculture, insurance, construction, marine, aviation, oil & gas, mining, and infrastructure. The demand for these services, which includes tasks such as search and rescue, package delivery, industrial inspections, imaging, and healthcare supply distribution to remote areas, significantly contributes to the growing drone market size.
In terms of market segmentation, drone services are categorized by the type of service provided, including platform services (further divided into flight piloting and operation, data analysis, and data processing), maintenance, repair, and operations (MRO), and simulation and training. The application-based segmentation encompasses inspection and monitoring, mapping and surveying, spraying and seeding, filming and photography, transport and delivery, as well as security, search, and rescue.
The industry-based segmentation covers a wide spectrum of sectors, including construction and infrastructure, agriculture, utility, oil & gas, mining, defense and law enforcement, media and entertainment, scientific research, insurance, aviation, marine, healthcare and social assistance, and transportation, logistics, and warehousing. These industries rely heavily on drones for functions like inspection, monitoring, and photography, further driving the drone market size.
Furthermore, the market is categorized by solution type into end-to-end solutions, which encompass all platform services like piloting and operations, data analytics, and data processing. Point solutions are specific to piloting or data processing for applications such as surveying, inspection, and monitoring.
The market report segments the drone services industry across five key regions: North America, Europe, Asia Pacific, the Middle East, and the Rest of the World (ROW), with a focus on their key countries.
In 2023, North America is expected to hold the largest share of the drone market size within the drone services industry, as these services continue to replace legacy solutions in commercial sectors.
Drone services are progressively replacing legacy services in the commercial sector, such as aerial surveys, filmography, and search and rescue operations. They offer the advantages of prolonged operation, remote control by human operators, or autonomous functioning by onboard computers. The increasing adoption of drone services across various civil and commercial applications can be attributed to their extended endurance and cost-effectiveness. Furthermore, the integration of advanced technologies like artificial intelligence in drones, IoT (Internet of Things), and cloud computing into drone services is expected to further boost their demand across various sectors.


 HIGHEST CAGR MARKET IN 2023
 US FASTEST GROWING MARKET IN THE REGION
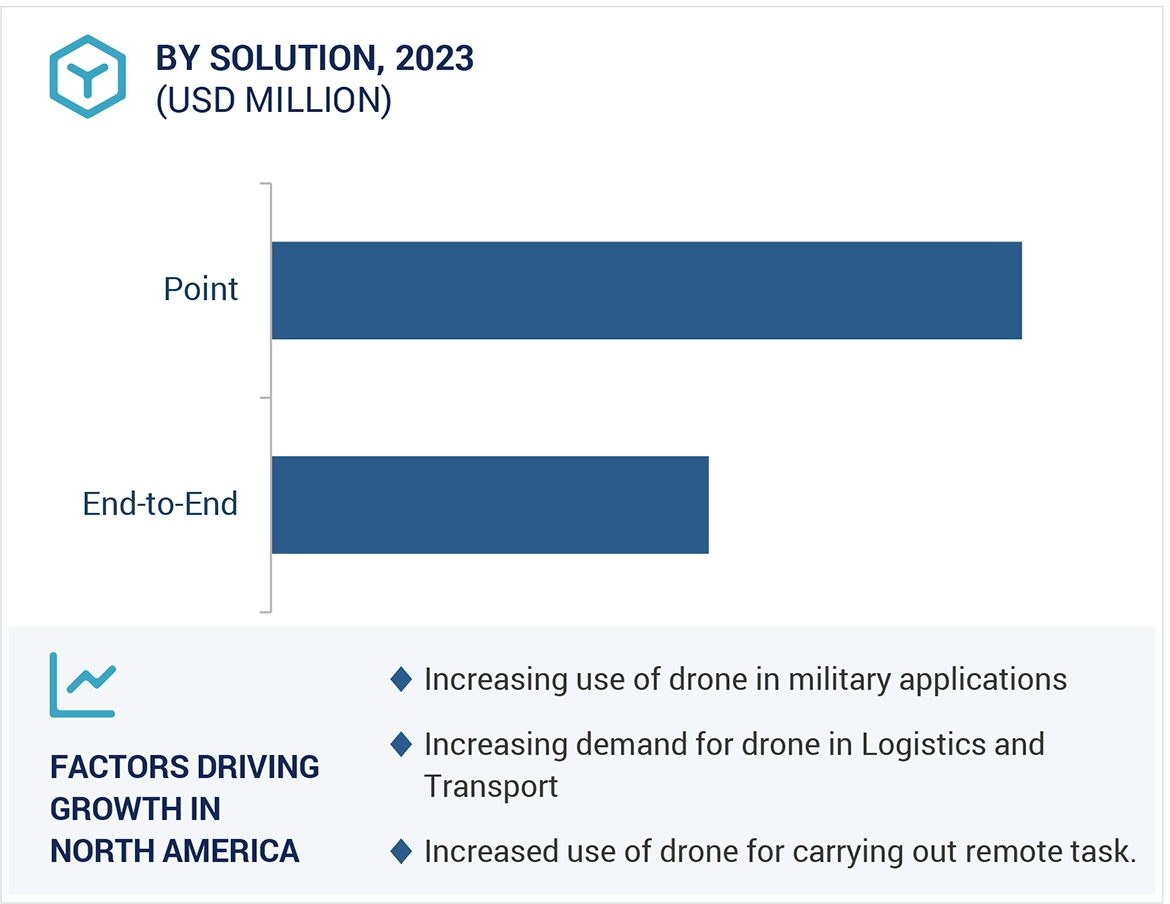


EL
Feb, 2019
We are a survey company using drones for 3D mapping, we are aiming to start providing the local market with drone solutions for infrastructure, industrial inspection. We are studying the market. .
randall
Dec, 2019
We are trying to determine whether to continue in the UAS market given the volatility with insurance carriers..
Arli
Sep, 2019
We are a drone company addressing the unique needs of the worlds most complex industrial environments. While we already work in film and television, we want to expand in the oil and gas, and medical supply delivery. Starting with the oil and gas, our plan is to build autonomous platforms for surveillance and inspections. We need to create financial projections for costs and revenues. Please contact us to discuss further. Thank you .
Derek
Jul, 2019
Does this report contain the following: Global Market Size and Growth Prospects (along with focus on Canada, the US, Europe, and Latin America), Value Chain Analysis, Regulatory Framework/Compliance (along with focus on Canada, US, Europe, and Latin America), Key Market Opportunities, Market Barriers, Industry Analysis & Outlook (global and regional), Market Driver Analysis, and Competitive Landscape (market leaders and analysis).
Mathew
Feb, 2019
What is the current Australian market potential for the following: drone surveying, photogrammetry, robotic process automation consulting and development, business analytics consulting, and data analytics consulting. .
Joe
Feb, 2019
We need to raise money for our startup. We need to know what is going on in the industry so that can convince investors that investing in us is a good bet..