Eddy Current Testing Market by Type (Conventional Eddy Current, ACFM, RFT, Eddy Current Array, Pulsed Eddy Current, Near-Field Testing, Near-Field Array, Partial Saturation Eddy Current), Service, Vertical, and Geography - Global Forecast to 2022


The eddy current testing (ECT) market was valued at USD 866.0 Million in 2015 and is expected to increase to USD 1,682.9 Million by 2022, at a CAGR of 9.82% between 2016 and 2022. The base year considered for the study is 2015, and the forecast period is between 2016 and 2022. This report provides a detailed analysis of eddy current testing market based on type, service, vertical, and geography. This market gives detailed information regarding the market dynamics influencing the growth of the market. The demand is increasing all over the world due to government regulations for the overall safety of industrial assets, workforce, and the surrounding environment. The report also aims to analyze the opportunities in the market by identifying high-growth segments of the global eddy current testing market.
The eddy current testing market is expected to be worth USD 1,682.9 Million by 2022, at a CAGR of 9.82% between 2016 and 2022. ECT measures and identifies defects and cracks in conductive material. Eddy current testing has its applications in various industries such as aerospace, automotive, oil & gas, manufacturing, and power generation. The report provides a description of each of the application areas of eddy current testing. The market within this study has been classified on the basis of ECT types into conventional eddy current, remote field testing, eddy current array, alternating current field measurement, pulsed eddy current testing, near-field testing, near-field array, and partial saturation eddy current.
Conventional eddy current is expected to hold the largest market share between 2016 and 2022. The conventional eddy current testing method detects defects in conductive materials such as copper, aluminum, and steel. It detects small cracks and measures thickness of materials.
The application in the oil & gas vertical is expected to hold the largest market share between 2016 and 2022. The demand for testing in this sector is largely driven by various governments’ mandates for ensuring the safety of the environment by avoiding pipeline leakages, oil spills, and other accidents. The market for the manufacturing vertical is expected to grow at the highest rate between 2016 and 2022. Different projects such as “Make in India” by the Indian government, a high-tech strategy of the German government, Industry 4.0 are anticipated to uplift the manufacturing sector during the forecast period.
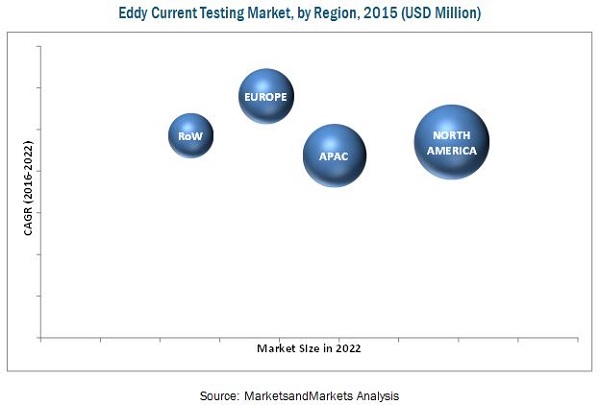
North America held the largest share of the NDT market in 2015, and it is expected to grow at a moderate CAGR between 2016 and 2022. The market in APAC is estimated to grow at the highest rate during the forecast period. The demand for eddy current testing in the APAC region is expected to be driven by increasing number of power plants since ECT is used to inspect the heat exchangers, tanks, and other equipment which are key part of power plants operations. For smooth and safe operations, inspection is performed at regular intervals.
There are few restraints for this eddy current testing market such as lack of skilled and qualified personnel and unawareness about the product. Also, ECT is used mainly to test conductive materials which are a limitation for eddy current testing since it cannot detect the defects in other materials such as plastic, rubber, fiber and others. Thus, it is a major restraint while using eddy current testing for inspection.
General Electric Company (U.S.) is the world’s largest clustered organization that offers a diversified product portfolio. The company has developed innovative products catering to the eddy current testing market. Also, it has followed expansion strategy by opening new technology center in the U.K. Apart from G.E. (U.S.), Olympus Corporation (Japan) , Eddyfi NDT Inc. (Canada), and Ashtead Technology Ltd. (U.K.) are other prominent key players in the eddy current testing market.
To speak to our analyst for a discussion on the above findings, click Speak to Analyst
 Exclusive indicates content/data unique to MarketsandMarkets and not available with any competitors.
Table of Contents
1 Introduction (Page No. - 13)
1.1 Objectives of the Study
1.2 Market Definition
1.3 Market Scope
1.3.1 Markets Covered
1.3.2 ECT Market, By Geography
1.3.3 Years Considered for the Study
1.4 Currency
1.5 Limitations
1.6 Stakeholders
2 Research Methodology (Page No. - 17)
2.1 Research Data
2.1.1 Secondary Data
2.1.1.1 Key Data From Secondary Sources
2.1.2 Primary Data
2.1.2.1 Key Data From Primary Sources
2.1.2.2 Key Industry Insights
2.1.2.3 Breakdown of Primaries
2.2 Market Size Estimation
2.2.1 Bottom-Up Approach
2.2.2 Top-Down Approach
2.3 Market Breakdown and Data Triangulation
2.4 Research Assumptions
3 Executive Summary (Page No. - 25)
4 Premium Insights (Page No. - 31)
4.1 Lucrative Opportunities in the ECT Market
4.2 ECT Market – Comparison of Growth Pattern of ECT Services
4.3 ECT Market in APAC in 2015
4.4 Market Share of Major Countries and Regions, 2015
4.5 ECT Market, By Type, 2016 vs 2022
5 Market Overview (Page No. - 35)
5.1 Introduction
5.2 Evolution of ECT
5.3 Market Segmentation
5.3.1 By Type
5.3.2 By Service
5.3.3 By Vertical
5.3.4 By Geography
5.4 Market Dynamics
5.4.1 Drivers
5.4.1.1 Safety Regulations By Governments
5.4.1.2 Advancements in New ECT Technologies
5.4.2 Restraints
5.4.2.1 Lack of Skilled and Qualified Workforce
5.4.3 Opportunities
5.4.3.1 Increasing Infrastructural Developments in Emerging Economies
5.4.3.2 Manufacturing Opportunities in Brics
5.4.4 Challenges
5.4.4.1 Fall in Prices of Oil & Gas
6 Industry Trends (Page No. - 44)
6.1 Introduction
6.2 Value Chain Analysis
6.3 Porter’s Five Forces Analysis
6.3.1 Threat of New Entrants
6.3.2 Threat of Substitutes
6.3.3 Bargaining Power of Suppliers
6.3.4 Bargaining Power of Buyers
6.3.5 Intensity of Rivalry
7 Market, By Type (Page No. - 52)
7.1 Introduction
7.2 Conventional Eddy Current Testing
7.3 Alternating Current Field Measurement (ACFM)
7.4 Remote Field Testing (RFT)
7.5 Eddy Current Array (ECA)
7.6 Pulsed Eddy Current Testing
7.7 Near-Field Testing (NFT)
7.8 Near-Field Array (NFA)
7.9 Partial Saturation Eddy Current (PSEC)
8 Market, By Service (Page No. - 71)
8.1 Introduction
8.2 Inspection Services
8.2.1 Advanced Eddy Current Inspection
8.3 Equipment Rental Services
8.4 Calibration Services
8.5 Training Services
9 Market, By Vertical (Page No. - 79)
9.1 Introduction
9.2 Manufacturing
9.3 Oil & Gas
9.3.1 Subsea Pipelines
9.3.2 Storage Tanks
9.4 Aerospace
9.4.1 Military Aerospace
9.5 Government Infrastructure
9.5.1 Inspeciton of Bridges
9.6 Automotive
9.7 Power Generation
9.7.1 Nuclear Power to Be A Major Driver for the Growth of ECT in the Power Generation Vertical
9.7.2 Wind Turbines
9.8 Other Verticals
9.8.1 Marine
9.8.2 Healthcare
9.8.3 Plastic and Polymer
10 Geographic Analysis (Page No. - 98)
10.1 Introduction
10.2 North America
10.2.1 U.S.
10.2.2 Canada
10.2.3 Mexico
10.3 Europe
10.3.1 U.K.
10.3.2 Germany
10.3.3 France
10.3.4 Italy
10.3.5 Rest of Europe
10.4 Asia-Pacific
10.4.1 China
10.4.2 Japan
10.4.3 India
10.4.4 Rest of APAC
10.5 Rest of the World
10.5.1 South America
10.5.2 Middle East
10.5.3 Africa
11 Competitive Landscape (Page No. - 119)
11.1 Overview
11.2 Market Ranking Analysis
11.3 Competitive Situation and Trends
11.3.1 New Product Launches
11.3.2 Agreements, Partnerships, and Contracts
11.3.3 Mergers & Acquisitions
11.3.4 Expansions
12 Company Profiles (Page No. - 124)
(Overview, Products & Services, Strategies & Insights, Developments and MnM View)*
12.1 Introduction
12.2 General Electric Company
12.3 Olympus Corporation
12.4 Ashtead Technology Inc.
12.5 Mistras Group Inc.
12.6 Eddyfi NDT Inc.
12.7 Ether NDE Limited
12.8 Zetec Inc.
12.9 TUV Rheinland AG
12.10 IBG NDT Systems Corporation
12.11 Fidgeon Limited
12.12 Magnetic Analysis Corporation Inc.
*Details on Overview, Products & Services, Strategies & Insights, Developments and MnM View Might Not Be Captured in Case of Unlisted Companies.
13 Appendix (Page No. - 148)
13.1 Insights of Industry Experts
13.2 Discussion Guide
13.3 Knowledge Store: Marketsandmarkets’ Subscription Portal
13.4 Introducing RT: Real-Time Market Intelligence
13.5 Available Customizations
13.6 Related Reports
List of Tables (72 Tables)
Table 1 Eddy Current Testing Market, By Type & Service, 2013–2022 (USD Million)
Table 2 Market, By Type, 2013–2022 (USD Million)
Table 3 Market for CEC, By Vertical, 2013–2022 (USD Million)
Table 4 Market for CEC, By Region, 2013–2022 (USD Million)
Table 5 Market for ACFM, By Vertical, 2013–2022 (USD Million)
Table 6 Market for ACFM, By Region, 2013–2022 (USD Million)
Table 7 Market for RFT, By Vertical, 2013–2022 (USD Million)
Table 8 Market for RFT, By Region, 2013–2022 (USD Million)
Table 9 Market for ECA, By Vertical, 2013–2022 (USD Million)
Table 10 Market for ECA, By Region, 2013–2022 (USD Million)
Table 11 Market for PEC, By Vertical, 2013–2022 (USD Million)
Table 12 Market for PEC, By Region, 2013–2022 (USD Million)
Table 13 Market for NFT, By Vertical, 2013–2022 (USD Million)
Table 14 Market for NFT, By Region, 2013–2022 (USD Million)
Table 15 Market for NFA, By Vertical, 2013–2022 (USD Million)
Table 16 Market for NFA, By Region, 2013–2022 (USD Million)
Table 17 Market for PSEC, By Vertical, 2013–2022 (USD Million)
Table 18 Market for PSEC, By Region, 2013–2022 (USD Million)
Table 19 Market, By Service, 2013–2022 (USD Million)
Table 20 Market for Inspection Services, By Vertical, 2013–2022 (USD Million)
Table 21 Market for Inspection Services, By Region, 2013–2022 (USD Million)
Table 22 Market for Equipment Rental Services, By Vertical, 2013–2022 (USD Million)
Table 23 Market Size for Equipment Rental Services, By Region, 2013–2022 (USD Million)
Table 24 Market for Calibration Services, By Vertical, 2013–2022 (USD Million)
Table 25 Market for Calibration Services, By Region, 2013–2022 (USD Million)
Table 26 ECT Market for Training Services, By Vertical, 2013–2022 (USD Million)
Table 27 ECT Market for Training Services, By Region, 2013–2022 (USD Million)
Table 28 Industries With Testing Requirements
Table 29 Market for Types and Services, By Vertical, 2013–2022 (USD Million)
Table 30 Market for Manufacturing Vertical, By Type, 2013–2022 (USD Million)
Table 31 Market for Manufacturing Vertical, By Service, 2013–2022 (USD Million)
Table 32 Market for Manufacturing Vertical, By Region, 2013–2022 (USD Million)
Table 33 Market for Oil & Gas Vertical, By Type, 2013–2022 (USD Million)
Table 34 Market for Oil & Gas Vertical, By Service, 2013–2022 (USD Million)
Table 35 Market for Oil & Gas Vertical, By Region, 2013–2022 (USD Million)
Table 36 Market for Aerospace Vertical, By Type, 2013–2022 (USD Million)
Table 37 Market for Aerospace Vertical, By Service, 2013–2022 (USD Million)
Table 38 Market for Aerospace Vertical, By Region, 2013–2022 (USD Million)
Table 39 Market for Government Infrastructure Vertical, By Type, 2013–2022 (USD Million)
Table 40 Market for Government Infrastructure Vertical, By Service, 2013–2022 (USD Million)
Table 41 Market for Government Infrastructure Vertical, By Region, 2013–2022 (USD Million)
Table 42 Market for Automotive Vertical, By Type, 2013–2022 (USD Million)
Table 43 ECT Market for Automotive Vertical, By Service, 2013–2022 (USD Million)
Table 44 ECT Market for Automotive Vertical, By Region, 2013–2022 (USD Million)
Table 45 ECT Market for Power Generation Vertical, By Type, 2013–2022 (USD Million)
Table 46 ECT Market for Power Generation Vertical, By Service, 2013–2022 (USD Million)
Table 47 Market for Power Generation Vertical, By Region, 2013–2022 (USD Million)
Table 48 Market for Other Verticals, By Type, 2013–2022 (USD Million)
Table 49 Market for Other Verticals, By Service, 2013–2022 (USD Million)
Table 50 ECT Market for Other Verticals, By Region, 2013–2022 (USD Million)
Table 51 Market, By Region, 2013–2022 (USD Million)
Table 52 Market in North America, By Type, 2013–2022 (USD Million)
Table 53 Market in North America, By Service, 2013–2022 (USD Million)
Table 54 Market in North America, By Vertical, 2013–2022 (USD Million)
Table 55 Market in North America, By Country, 2013–2022 (USD Million)
Table 56 Market in Europe, By Type, 2013–2022 (USD Million)
Table 57 Market in Europe, By Service, 2013–2022 (USD Million)
Table 58 Market in Europe, By Vertical, 2013–2022 (USD Million)
Table 59 Market in Europe, By Country, 2013–2022 (USD Million)
Table 60 Market in APAC, By Type, 2013–2022 (USD Million)
Table 61 Market in APAC, By Service, 2013–2022 (USD Million)
Table 62 Market in APAC, By Vertical, 2013–2022 (USD Million)
Table 63 Market in APAC, By Country, 2013–2022 (USD Million)
Table 64 Market in RoW, By Type, 2013–2022 (USD Million)
Table 65 Market in RoW, By Service, 2013–2022 (USD Million)
Table 66 Market in RoW, By Vertical, 2013–2022 (USD Million)
Table 67 Market in RoW, By Region, 2013–2022 (USD Million)
Table 68 Market Ranking, 2015
Table 69 New Product Launches, 2013–2016
Table 70 Agreements, Contracts, Partnerships, and Collaborations, 2013–2016
Table 71 Mergers & Acquisitions, 2013–2016
Table 72 Expansions, 2013–2016
List of Figures (57 Figures)
Figure 1 Eddy Current Testing Market: Research Design
Figure 2 Market Size Estimation Meth0dology: Bottom-Up Approach
Figure 3 Market Size Estimation Meth0dology: Top-Down Approach
Figure 4 Data Triangulation
Figure 5 Assumptions of the Research Study
Figure 6 Snapshot of ECT Market (2016 vs 2022): CEC to Be the Largest Market During the Forecast Period
Figure 7 Application in the Manufacturing Vertical to Exhibit High Growth Between 2016 and 2022
Figure 8 Inspection Services to Hold the Largest Share of the ECT Market (2016 vs 2022)
Figure 9 North America Expected to Hold A Major Share of the ECT Market During the Forecast Period
Figure 10 Increasing Demand From Power Generation and Manufacturing Sectors to Create Opportunities for ECT Market Between 2016 and 2022
Figure 11 Inspection Services to Grow at the Highest Rate During the Forecast Period
Figure 12 China Held the Largest Share of the ECT Market in APAC in 2015
Figure 13 U.S. Accounted for the Largest Market Share in 2015
Figure 14 CEC Likely to Be the Most Preferred ECT Type Between 2016 and 2022
Figure 15 Market Methods: Evolution
Figure 16 Major Markets for ECT Across Different Regions
Figure 17 Safety Regulations By Governments and Advancements in ECT Technologies to Drive the ECT Market Between 2016 and 2022
Figure 18 Value Chain Analysis: Market
Figure 19 Porter’s Five Forces Analysis: Market (2015)
Figure 20 Porter’s Five Forces: Impact Analysis
Figure 21 Market: Threat of New Entrants
Figure 22 Market: Threat of Substitutes
Figure 23 Market: Bargaining Power of Suppliers
Figure 24 Market: Bargaining Power of Buyers
Figure 25 Market: Intensity of Competitive Rivalry
Figure 26 Services Segment Expected to Hold A Large Share of the ECT Market During the Forecast Period
Figure 27 CEC Technique Expected to Hold the Largest Size of the ECT Market During the Forecast Period
Figure 28 Oil & Gas Vertical Expected to Hold the Largest Size of the CEC Market By 2022
Figure 29 North America and APAC to Be the Major Markets for ACFM Between 2016 and 2022
Figure 30 Oil & Gas Expected to Hold the Largest Size of the RFT Market By 2022
Figure 31 North America Expected to Lead the ECA Market With the Largest Market Size By 2022
Figure 32 Oil & Gas and Power Generation Verticals Expected to Hold Significant Size of the PEC Market By 2022
Figure 33 ECT Market for NFT , By Region (2015 vs 2022)
Figure 34 Oil & Gas and Power Generation to Be the Major Verticals of the NFA Market By 2022
Figure 35 North America Expected to Account for the Largest Size of the PSEC Market Between 2015 and 2022
Figure 36 Inspection Services to Lead the ECT Market By Holding the Largest Market Size By 2022
Figure 37 Oil & Gas Sector to Hold the Largest Market Size for ECT By 2022
Figure 38 ECT Market in Oil & Gas Vertical, By Region (2015 vs 2022)
Figure 39 ECT Market for Power Generation Vertical, By Region (2015 vs 2022)
Figure 40 India Expected to Be the Fastest-Growing Market for Eddy Current Testing Between 2016 and 2022
Figure 41 Attractive Growth Opportunities in the Manufacturing Vertical During the Forecast Period
Figure 42 North America: Market Snapshot, 2015
Figure 43 Europe: Market Snapshot, 2015
Figure 44 APAC: Market Snapshot, 2015
Figure 45 RoW: Market Snapshot, 2015
Figure 46 Organic and Inorganic Strategies Adopted By Companies Operating in the Eddy Current Testing Market
Figure 47 Battle for Market Share: New Product Launches Was the Key Strategy
Figure 48 Geographic Revenue Mix of Top Market Players
Figure 49 General Electric Company: Company Snapshot
Figure 50 General Electric Company: SWOT Analysis
Figure 51 Olympus Corporation: Company Snapshot
Figure 52 Olympus Corporation: SWOT Analysis
Figure 53 Ashtead Technology Ltd.: Company Snapshot
Figure 54 Ashtead Technology Inc.: SWOT Analysis
Figure 55 Mistras Group Inc.: Company Snapshot
Figure 56 Mistras Group: SWOT Analysis
Figure 57 TUV Rheinland AG: Company Snapshot
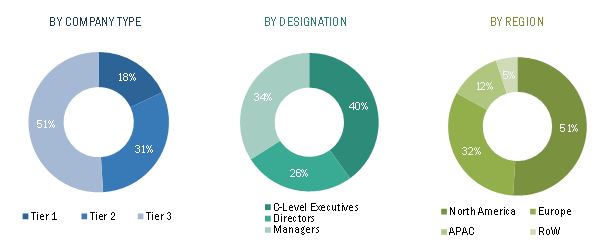
The research methodology used to estimate and forecast the eddy current testing market begins with capturing data on key vendor revenue through secondary research by the American Society for Non-Destructive Testing (ASNT), British Institute of Non-Destructive Testing (BINDT), and Indian Society for Non-Destructive Testing (ISNT). The vendor offerings are taken into consideration to determine the market segmentation. A combination of top-down and bottom-up approaches has been employed to arrive at the overall size of the global market from the revenues of key players in the market. After arriving at the overall market size, the total market has been split into several segments and subsegments which have been verified through the primary research by conducting extensive interviews of people holding key positions such as CEOs, VPs, directors, and executives. Market breakdown and data triangulation procedures have been employed to complete the overall market engineering process and arrive at the exact statistics for all segments and subsegments. The breakdown of profiles of primaries is depicted in the figure below:
To know about the assumptions considered for the study, download the pdf brochure
The eddy current testing market comprises equipment manufacturers and inspection service providers. The companies such as General Electric Company (U.S.), Ether NDE Limited (U.K.), Olympus Corporation (Japan), and Eddyfi NDT Inc. (Canada) among others are the ones who design and manufacture ECT equipment. The companies offering inspection services include Ashtead Technology Ltd. (U.K.), TUV Rheinland AG (Germany), and Mistras Group Inc. (U.S.) among others. Many of these companies also act as system integrators and distributors for eddy current testing equipment.
Target Audience:
- Analysts and strategic business planners
- Governments, financial institutions, and investment communities
- Original equipment manufacturers (OEMs) (end-user application or electronic component manufacturers)
- Product manufacturers
- Raw material and manufacturing equipment suppliers
- Research organizations
- Technology investors
- Technology standards organizations, forums, alliances, and associations
The study answers several questions for the stakeholders, primarily which market segments to focus on in the next two to five years for prioritizing efforts and investments.”
Scope of the Report:
The report scope covers the eddy current testing market based on following segments:
-
By Technique
- Conventional Eddy Current Testing
- Remote Field Testing
- Alternating Current Field Measurement
- Eddy Current Array
- Pulsed Eddy Current Testing
- Near-Field Testing
- Near-Field Array
- Partial Saturation Eddy Current
-
By Service
- Inspection Services
- Equipment Rental Services
- Calibration Services
- Training Services
-
By Vertical
- Manufacturing
- Oil & Gas
- Aerospace
- Government Infrastructure & Public Safety
- Automotive
- Power Generation
- Others
-
By Geography
-
North America
- U.S.
- Canada
- Mexico
-
Europe
- U.K.
- Germany
- France
- Italy
- Rest of Europe
-
Asia-Pacific
- China
- Japan
- India
- Rest of APAC
-
RoW
- South America
- Middle East
- Africa
-
North America
Available Customizations:
With the given market data, MarketsandMarkets offers customizations according to the company’s specific needs. The following customization options are available for the report:
Company Information:
Detailed analysis and profiling of additional market players (up to five)


Growth opportunities and latent adjacency in Eddy Current Testing Market
I am a specialist in non-destructive testing methods (PhD). I have many US patents, Ukraine and the UK. I have control of the vortex method patents welds, the electrical conductivity of the powdery material. Could you please send me sample brochure of this report?