NDT Services Market by Testing Technique (Ultrasonic, Radiographic, Eddy Current, Magnetic particle, Acoustic Emission, Terahertz Imaging), Type (Inspection, Renting, Training, Calibration), Vertical, & Geography - Global Forecast to 2022


The NDT services market size was valued at USD 4.77 Billion in 2015 and is expected to increase to USD 8.55 Billion by 2022, at a CAGR of 8.52% between 2016 and 2022. This report provides a detailed analysis of the NDT services market based on technique, type, vertical, and geography. The availability of different NDT methods according to the industry requirements to ensure quality inspection is leading to the demand for the market around the globe.
The years considered for this report:
2015 – Base Year
2016 – Estimated year
2022 – Forecast year
The objective of the report is to define, describe, and forecast the global NDT services market on the basis of technique, type, vertical and geography; to forecast the market size in terms of value for various segments with regard to four main regions, namely, North America, Europe, Asia-Pacific, and RoW; to provide detailed information regarding the major factors influencing the growth of the NDT services market (drivers, restraints, opportunities, and challenges); to study the value chain and analyze the impact of Porter’s five forces on the market; and to analyse the micro markets with respect to the individual growth trends, future prospects, and contribution to the total NDT services market
The global NDT services market size was valued at USD 4.77 Billion in 2015 and is expected to increase to USD 8.55 Billion by 2022. It is expected to grow at a CAGR of 8.52% between 2016 and 2022. The key market drivers for this market are the outsourcing of NDT services to third party service providers, aging infrastructure and the availability of different NDT methods according to the industry requirements for quality inspection. NDT has its applications in various industries such as aerospace & defense, automotive, oil & gas, infrastructure, and power generation.
The NDT inspection services market is expected to hold the largest share between 2016 and 2022. NDT inspection is used to validate the integrity of materials, detect instabilities, discover performance, and recognize failed components. As a result, it is of utmost importance so as to evaluate the reliability of the product and prevent catastrophic failures. The training market is expected to grow at the highest CAGR during the forecast period owing to the shift towards advanced NDT techniques such as phased array ultrasonic testing (PAUT) from traditional NDT techniques which requires skilled technicians for inspection.
In the NDT services market, the ultrasonic testing technique is expected to occupy the leading market share during the forecast period. The ultrasonic testing is fast, reliable, and versatile method of inspection which can detect internal and hidden discontinuities. The terahertz imaging market is expected to grow at the highest CAGR during the forecast period. A wide range of imaging and spectroscopic capabilities possessed by terahertz technology makes it suitable for the investigation of material integrity and thus it is being used widely in paints and coatings defect identification, electronic circuit inspection, and food quality inspection among others.
Among the verticals, the oil & gas sector is expected to occupy the largest NDT services market share during the forecast period between 2016 and 2022. The demand for NDT technologies in this sector is largely driven by government regulations for improving the safety of people and environment by avoiding oil spillage due to leaks, bursting of pipes, or any other accidents. The manufacturing sector is expected to grow at the highest rate due to various government initiatives such as ‘Make in India’ by Government of India, “Industry 4.0” in Europe, and “National infrastructure plan” in South Africa among others.
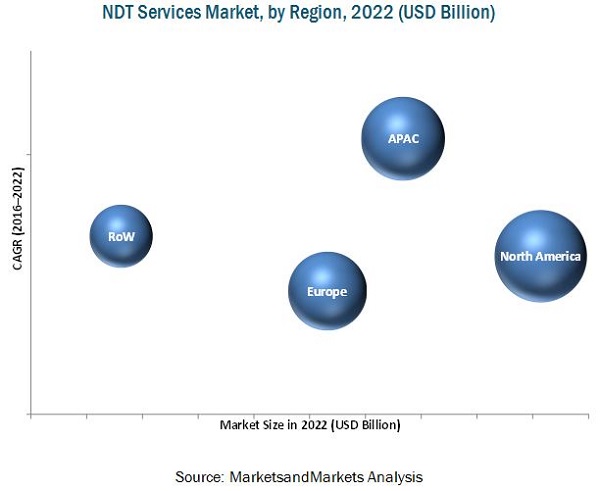
North America held the largest share of the NDT services market in 2015, and it is expected to grow at a moderate CAGR between 2016 and 2022. The market in this region is driven by dominant construction and manufacturing activities in the region. The market in APAC is estimated to grow at the highest rate for this market during the forecast period. The demand for non-destructive testing in the APAC region is expected to be driven by advancement in terms of economic growth, infrastructural developments, and construction of power plants.
The major restraint for this NDT services market is the fluctuation in the prices of oil and gas. This has increased the price pressure in the capex inspection activities done by the companies. Also, it has led to a delay in the maintenance of refineries by the companies. Therefore, the NDT services have been affected temporarily to some extent due to this.
The key players in the NDT services market include GE Oil & Gas Digital Solutions (U.S.), Ashtead Technology (U.K.), Mistras Group Inc. (U.S.), Zetec Inc. (U.S.), Intertek Group (U.K.), Yxlon international GMBH (Germany), and TUV Rheinland AG (Germany) among others. GE Oil & Gas Digital Solutions (U.S.) majorly focuses on organic growth strategies such as new product launches and expansions. It has made technological breakthroughs in the NDT inspection.
To speak to our analyst for a discussion on the above findings, click Speak to Analyst
 Exclusive indicates content/data unique to MarketsandMarkets and not available with any competitors.
Table of Contents
1 Introduction (Page No. - 14)
1.1 Objectives of The Study
1.2 Market Definition
1.3 Study Scope
1.3.1 Markets Covered
1.3.2 Geographic Scope
1.3.3 Years Considered for The Study
1.4 Currency
1.5 Limitations
1.6 Stakeholders
2 Research Methodology (Page No. - 18)
2.1 Research Data
2.1.1 Secondary Data
2.1.1.1 Key Data From Secondary Sources
2.1.2 Primary Data
2.1.2.1 Key Data From Primary Sources
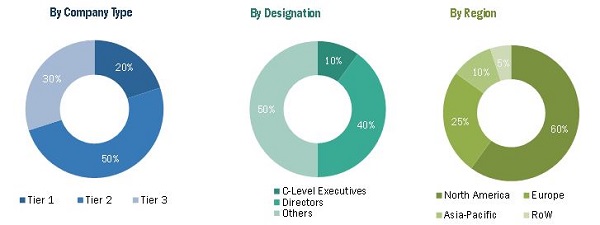
2.1.2.2 Breakdown of Primaries
2.2 Market Size Estimation
2.2.1 Bottom-Up Approach
2.2.2 Top-Down Approach
2.3 Market Breakdown & Data Triangulation
2.4 Research Assumptions
3 Executive Summary (Page No. - 26)
4 Premium Insights (Page No. - 31)
4.1 Lucrative Opportunities in The NDT Services Market
4.2 Market in APAC to Witness Prominent Growth During The Forecast Period
4.3 Market, Segment-Wise Market Share 2015
4.4 Market, By Type, 2016 vs 2022
4.5 Market, By Technique, 2016 vs 2022
5 Market Overview (Page No. - 35)
5.1 Introduction
5.2 Evolution of Non-Destructive Testing
5.3 Market Segmentation
5.3.1 Market, By Technique
5.3.2 Market, By Service
5.3.3 Market, By Vertical
5.3.4 Market, By Geography
5.4 Market Dynamics
5.4.1 Drivers
5.4.1.1 Outsourcing of NDT Services to Third Party Service Providers
5.4.1.2 Aging Infrastructure and Increasing Need for Maintenance
5.4.1.3 Availability of Different NDT Methods According to The Requirement to Ensure Quality Inspection
5.4.2 Restraints
5.4.2.1 Fluctuation in Prices of Oil & Gas has Impacted The Demand for NDT Inspection Services
5.4.3 Opportunities
5.4.3.1 Increasing Infrastructure Development in Emerging Economies
5.4.3.2 Power Generation to Be A Key Emerging Market for NDT Inspection Services
5.4.4 Challenges
5.4.4.1 Procurement of NDT Equipment and Training Staff to Carry Out NDT Inspection
6 Industry Trends (Page No. - 44)
6.1 Value Chain Analysis
6.1.1 NDT Services Market
6.2 Porter’s Five Forces Analysis
6.2.1 Threat of New Entrants
6.2.2 Threat of Substitutes
6.2.3 Bargaining Power of Suppliers
6.2.4 Bargaining Power of Buyers
6.2.5 Intensity of Rivalry
7 Market, By Technique (Page No. - 51)
7.1 Introduction
7.2 Visual Inspection Testing (VT)
7.2.1 General Inspection
7.2.2 Aided Visual Inspection
7.2.2.1 Borescope
7.2.2.2 Endoscope
7.2.2.3 Videoscope
7.3 Magnetic Particle Testing (MPT)
7.4 Liquid Penetrant Testing (LPT)
7.5 Eddy Current Testing (ECT)
7.5.1 Alternating Current Field Measurement (ACFM)
7.5.2 Remote Field Testing (RFT)
7.5.3 Eddy Current Array (ECA)
7.6 Ultrasonic Testing (UT)
7.6.1 Straight Beam Inspection
7.6.2 Angle Beam Testing
7.6.3 Immersion Testing
7.6.4 Guided-Wave Testing
7.6.5 Phased Array Inspection
7.6.6 Time-Of-Flight Diffraction (TOFD)
7.7 Radiographic Testing (RT)
7.7.1 X-Ray Testing
7.7.2 Gamma-Ray Testing
7.7.3 Computed Radiography
7.7.4 Film Radiography
7.7.5 Direct Radiography (Real-Time)
7.8 Acoustic Emission Testing (AET)
7.9 Terahertz Imaging (THZ Imaging)
7.9.1 Aerospace
7.9.2 Semiconductor & Electronics
7.9.3 Pharmaceutical
8 Market, By Type (Page No. - 74)
8.1 Introduction
8.2 Inspection Services
8.2.1 Ultrasonic Inspection
8.2.2 Radiographic Inspection
8.2.3 Visual Inspection
8.2.4 Magnetic Particle Inspection
8.2.5 Advanced Eddy Current Inspection
8.2.6 Liquid Penetrant Inspection
8.3 Equipment Rental Services
8.4 Training Services
8.5 Calibration
9 Market, By Vertical (Page No. - 82)
9.1 Introduction
9.2 Manufacturing
9.3 Oil & Gas
9.3.1 Refining
9.3.2 Transmission Pipeline
9.3.3 Subsea Pipelines
9.3.4 Storage Tanks
9.4 Aerospace
9.4.1 NDT for Aircraft Engine Part Production
9.4.2 NDT for Composite Airframe Manufacturing
9.4.3 Aircraft Maintenance
9.4.4 Material Analysis
9.5 Government Infrastructure and Public Safety
9.5.1 Military and Defense
9.5.2 Airport Security
9.5.3 Railway Industry
9.5.4 Bridges and Tunnels
9.5.5 Border Crossing
9.5.6 Nuclear Waste Storage and Decommissioning
9.6 Automotive
9.7 Power Generation
9.7.1 Nuclear Power
9.7.2 Wind Turbines
9.7.3 Solar Power
9.7.4 Fossil Fuel Energy
9.8 Others
9.8.1 Marine
9.8.2 Healthcare
9.8.3 Plastic and Polymer
10 Non-Destructive Testing Market, By Geography (Page No. - 105)
10.1 Introduction
10.2 North America
10.2.1 U.S.
10.2.2 Canada
10.2.3 Mexico
10.3 Europe
10.3.1 U.K.
10.3.2 Germany
10.3.3 France
10.3.4 Italy
10.3.5 Rest of Europe
10.4 APAC
10.4.1 China
10.4.2 Japan
10.4.3 India
10.4.4 Rest of APAC
10.5 Rest of The World
10.5.1 South America
10.5.2 Middle East
10.5.3 Africa
11 Competitive Landscape (Page No. - 132)
11.1 Overview
11.2 Market Ranking Analysis
11.3 Competitive Situation and Trends
11.3.1 New Product Launches
11.3.2 Contracts, Agreements and Partnerships
11.3.3 Mergers & Acquisitions
11.3.4 Expansions
12 Company Profiles (Page No. - 141)
(Overview, Products and Services, Financials, Strategy & Development)*
12.1 Introduction
12.2 GE Oil and Gas Digital Solutions
12.3 Ashtead Technology
12.4 Mistras Group, Inc.
12.5 TUV Rheinland AG
12.6 Intertek Group PLC
12.7 Team, Inc.
12.8 Zetec Inc.
12.9 Yxlon International GmbH
12.10 Rockwood Service Corporation
*Details on Overview, Products and Services, Financials, Strategy & Development Might Not Be Captured in Case of Unlisted Companies
13 Appendix (Page No. - 168)
13.1 Insights of Industry Experts
13.2 Discussion Guide
13.3 Knowledge Store: Marketsandmarkets’ Subscription Portal
13.4 Introducing RT: Real-Time Market Intelligence
13.5 Available Customizations
13.6 Related Reports
List of Tables (71 Tables)
Table 1 NDT Services Market Size, By Technique, 2013–2022 (USD Million)
Table 2 Market for Visual Inspection Testing Services, By Vertical, 2013–2022 (USD Million)
Table 3 Market for Visual Inspection Testing Services, By Region, 2013–2022 (USD Million)
Table 4 Market for Magnetic Particle Testing Services, By Vertical, 2013–2022 (USD Million)
Table 5 Market for Magnetic Particle Testing Services, By Region, 2013–2022 (USD Million)
Table 6 Market for Liquid Penetrant Testing Services, By Vertical, 2013–2022 (USD Million)
Table 7 Market for Liquid Penetrant Testing Services, By Region, 2013–2022 (USD Million)
Table 8 Market for Eddy Current Testing Services, By Vertical, 2013–2022 (USD Million)
Table 9 Market for Eddy Current Testing Services, By Region, 2013–2022 (USD Million)
Table 10 Market for Ultrasonic Testing Services, By Vertical, 2013–2022 (USD Million)
Table 11 Market for Ultrasonic Testing Services, By Region, 2013–2022 (USD Million)
Table 12 Market for Radiographic Testing Services, By Vertical, 2013–2022 (USD Million)
Table 13 Market for Radiographic Testing Services, By Region, 2013–2022 (USD Million)
Table 14 Market for Acoustic Emission Testing Services, By Vertical, 2013–2022 (USD Million)
Table 15 Market for Acoustic Emission Testing Services, By Region, 2013–2022 (USD Million)
Table 16 Market for Terahertz Imaging Services, By Vertical, 2013–2022 (USD Million)
Table 17 Market for Terahertz Imaging Services, By Region, 2013–2022 (USD Million)
Table 18 Market Size, By Type, 2013–2022 (USD Million)
Table 19 Market for Inspection Services, By Vertical, 2013–2022 (USD Million)
Table 20 Market for Equipment Rental Services, By Vertical, 2013–2022 (USD Million)
Table 21 Market for Training Services, By Vertical, 2013–2022 (USD Million)
Table 22 Market for Calibration Services, By Vertical, 2013–2022 (USD Million)
Table 23 Industries With Testing Requirements
Table 24 Market, By Vertical, 2013–2022 (USD Million)
Table 25 Market for Manufacturing Vertical, By Technique, 2013–2022 (USD Million)
Table 26 Market for Manufacturing Vertical, By Type, 2013–2022 (USD Million)
Table 27 Market for Oil & Gas Vertical, By Technique, 2013–2022 (USD Million)
Table 28 Market for Oil & Gas Vertical, By Type, 2013–2022 (USD Million)
Table 29 NDT Techniques in Aerospace
Table 30 Essential NDT Techniques for Aircraft Maintenance
Table 31 Market for Aerospace Vertical, By Technique, 2013–2022 (USD Million)
Table 32 Market for Aerospace Vertical, By Type, 2013–2022 (USD Million)
Table 33 Market for Government Infrastructure Vertical, By Technique, 2013–2022 (USD Million)
Table 34 Market for Government Infrastructure Vertical, By Type, 2013–2022 (USD Million)
Table 35 NDT Technologies in The Automotive Vertical
Table 36 Market for Automotive Vertical, By Technique, 2013–2022 (USD Million)
Table 37 Market for Automotive Vertical, By Type, 2013–2022 (USD Million)
Table 38 Application of NDT Techniques in Nuclear Power Plants
Table 39 Market for Power Generation Vertical, By Technique, 2013–2022 (USD Million)
Table 40 Market for Power Generation Vertical, By Type, 2013–2022 (USD Million)
Table 41 Market for Other Verticals, By Technique, 2013–2022 (USD Million)
Table 42 Market for Other Verticals, By Type, 2013–2022 (USD Million)
Table 43 Market, By Region, 2013–2022 (USD Million)
Table 44 Market in North America, By Country, 2013–2022 (USD Million)
Table 45 Market in North America, By Technique, 2013–2022 (USD Million)
Table 46 Market in U.S., By Technique, 2013–2022 (USD Million)
Table 47 Market in Canada, By Technique, 2013–2022 (USD Million)
Table 48 Market in Mexico, By Technique, 2013–2022 (USD Million)
Table 49 Market in Europe, By Country, 2013–2022 (USD Million)
Table 50 Market in Europe, By Technique, 2013–2022 (USD Million)
Table 51 Market in U.K. , By Technique, 2013–2022 (USD Million)
Table 52 Market in Germany, By Technique, 2013–2022 (USD Million)
Table 53 Market in France, By Technique, 2013–2022 (USD Million)
Table 54 Market in Italy, By Technique, 2013–2022 (USD Million)
Table 55 Market in Rest of Europe, By Technique, 2013–2022 (USD Million)
Table 56 Market in APAC, By Country, 2013–2022 (USD Million)
Table 57 Market in APAC, By Technique, 2013–2022 (USD Million)
Table 58 Market in China, By Technique, 2013–2022 (USD Million)
Table 59 Market in Japan, By Technique, 2013–2022 (USD Million)
Table 60 Market in India, By Technique, 2013–2022 (USD Million)
Table 61 Market in Rest of APAC, By Technique, 2013–2022 (USD Million)
Table 62 Market in RoW, By Region, 2013–2022 (USD Million)
Table 63 Market in RoW, By Technique, 2013–2022 (USD Million)
Table 64 Market in South America, By Technique, 2013–2022 (USD Million)
Table 65 Market in Middle East, By Technique, 2013–2022 (USD Million)
Table 66 Market in Africa, By Technique, 2013–2022 (USD Million)
Table 67 Market Ranking, 2015
Table 68 New Product Launches, 2014–2016
Table 69 Contracts, Agreements and Partnerships, 2014–2016
Table 70 Mergers & Acquisitions, 2014–2016
Table 71 Expansions, 2014-2016
List of Figures (50 Figures)
Figure 1 Market Segmentation
Figure 2 NDT Services Market : Research Design
Figure 3 Market: Bottom-Up Approach
Figure 4 Market: Top-Down Approach
Figure 5 Data Triangulation
Figure 6 Market Snapshot (2016 vs 2022): Ultrasonic Testing Technique to Be The Largest Market By 2022
Figure 7 Manufacturing Vertical to Grow at The Highest Rate During The Forecast Period
Figure 8 NDT Inspection Services to Hold The Highest Share of The Market in The Forecast Period
Figure 9 North America Expected to Hold A Major Share of The NDT Market During The Forecast Period
Figure 10 Market to Witness Prominent Growth Between 2016 and 2022
Figure 11 U.S. Accounted for The Largest Market Share in 2015
Figure 12 Oil & Gas Vertical Held The Major Share of The Market in 2015
Figure 13 Inspection Services to Hold The Largest Market Size During The Forecast Period
Figure 14 Ultrasonic Testing to Hold The Largest Market Size Between 2016 and 2022
Figure 15 Non-Destructive Testing Methods: Evolution
Figure 16 Major Markets for NDT Services Across Different Geographies
Figure 17 Outsourcing of NDT Services to Third Party Service Providers and Ageing Infrastructure to Drive The market During 2016 - 2022
Figure 18 Value Chain Analysis: NDT Services Market
Figure 19 Porter’s Five Forces Analysis – Market
Figure 20 Porter’s Five Forces: Impact Analysis
Figure 21 Market: Threat of New Entrants
Figure 22 Market: Threat of Substitutes
Figure 23 Market: Bargaining Power of Suppliers
Figure 24 Market: Bargaining Power of Buyers
Figure 25 Market: Intensity of Rivalry
Figure 26 Market Expected to Be Led By Ultrasonic Testing Technique During The Forecast Period
Figure 27 Visual Inspection Testing Market Expected to Hold The Largest Size in North America During The Forecast Period
Figure 28 Eddy Current Testing Market, By Vertical, (2015 vs 2022)
Figure 29 Oil & Gas Sector to Be The Largest Market for UT Services By 2022
Figure 30 Market for Ultrasonic Testing in APAC to Grow at The Highest Rate During The Forecast Period
Figure 31 North America to Hold The Largest Size of The Market for Radiographic Testing Services During The Forecast Period
Figure 32 Inspection Services to Hold The Largest Share of The Market By 2022
Figure 33 Manufacturing Vertical to Grow at The Highest Rate in The Market
Figure 34 Market in India Expected to Grow at The Highest Rate Between 2016 and 2022
Figure 35 North America: Market Snapshot, 2015
Figure 36 Europe: Market Snapshot, 2015
Figure 37 APAC: Market Snapshot, 2015
Figure 38 RoW: Market Snapshot, 2015
Figure 39 Organic and Inorganic Strategies Adopted By Companies in The Market
Figure 40 Market Witnessed A Significant Growth Between 2014 and 2016
Figure 41 Battle for Market Share: New Product Launches Was The Key Strategy
Figure 42 General Electric Group: Company Snapshot
Figure 43 GE Oil & Gas Digital Solutions: SWOT Analysis
Figure 44 Mistras Group, Inc.: Company Snapshot
Figure 45 Mistras Group Inc.: SWOT Analysis
Figure 46 TUV Rheinland AG: Company Snapshot
Figure 47 TUV Rheinland AG: SWOT Analysis
Figure 48 Intertek Group PLC: Company Snapshot
Figure 49 Intertek Group PLC.: SWOT Analysis
Figure 50 Team, Inc.: Company Snapshot
The research methodology used to estimate and forecast the NDT services market begins with capturing data on key vendor revenue through secondary sources such as the American Society of Nondestructive Testing (ASNT), British Institute of Non-Destructive Testing among others. The vendor offerings have also been taken into consideration to determine the market segmentation. The combination of top-down and bottom-up procedures have been employed to arrive at the overall size of the global NDT services market from the revenues of key players in the market. After arriving at the overall market size, the total NDT services market has been split into several segments and sub segments which have been verified through the primary research by conducting extensive interviews of people holding key positions such as CEOs, VPs, directors, and executives. The NDT services market breakdown and data triangulation procedures have been employed to complete the overall market engineering process and to arrive at the exact statistics for all segments and sub segments. The breakdown of profiles of primaries is depicted in the figure below:
To know about the assumptions considered for the study, download the pdf brochure
This report provides valuable insights regarding ecosystem of this market such as NDT equipment manufacturers and suppliers, NDT training and certification providers, system integrators, middleware and firmware providers, suppliers and distributors among others. Companies such as Mistras Group Inc. (U.S.), GE (U.S.), Olympus Corporation (Japan), Nikon Metrology (U.S.), and others provide NDT equipment in the NDT services market. The NDT training and certification has been provided by some players such as TUV Rheinland (Germany), Intertek (U.K.) and TEAM industrial services (U.S.) among others. The NDT service providers include GE Oil & Gas Digital Solutions (U.S.), Ashtead Technology (U.K.), Zetec Inc. (U.S.), and Yxlon international GMBH (Germany) among others. The end users of NDT services include PSEG Nuclear (U.S.), BP PLC (U.K.), and Southern Company (U.S.) among others.
Target Audience
- Analysts and strategic business planners
- Governments, financial institutions, and investment communities
- Original equipment manufacturers (OEMs) (end-user application or electronic component manufacturers)
- Product manufacturers
- Raw material and manufacturing equipment suppliers
- Research organizations
- Technology investors
- Technology standards organizations, forums, alliances, and associations
“Study answers several questions for the stakeholders, primarily which market segments to focus in next two to five years for prioritizing the efforts and investments”.
Scope of the Report:
The report scope covers the following submarkets of the non-destructive testing market:
-
By Testing Technique
- Visual Inspection
- Magnetic Particle
- Liquid Penetrant
- Eddy Current
- Ultrasonic
- Radiographic
- Acoustic Emission
- Terahertz Imaging
-
By Type
- Inspection Services
- Equipment Rental Services
- Training Services
- Calibration Services
-
By Vertical
- Manufacturing
- Oil & Gas
- Aerospace
- Government Infrastructure & Public Safety
- Automotive
- Power Generation
- Others( Plastic & Polymers, Medical & Health and Marine )
-
By Geography
-
North America
- U.S.
- Canada
- Mexico
-
Europe
- U.K.
- Germany
- France
- Italy
- Rest of Europe
-
Asia-Pacific
- China
- Japan
- India
- Rest of APAC
-
RoW
- South America
- Middle East
- Africa
-
North America
Available Customizations:
With the given market data, MarketsandMarkets offers customizations as per the company’s specific needs. The following customization options are available for the report:
Company Information
Detailed analysis and profiling of additional market players (up to five) and competitive landscape.


Growth opportunities and latent adjacency in NDT Services Market
I went through your blog and found it very informative and thorough for NDT.
We would like to know if the report breaks the market for Ultrasonic testing, radiographic testing, visual inspection, magnetic particle inspection, and advanced eddy current testing into North America, Europe, APAC, and RoW? If not, can we get this as a part of customization?
Dear sir or madam, we would like to understand the structure and level of details provided in your report before buying it. Is there any way to get a free sample of the full NDT report?
Does the report include Drill stem testing, Specialty Tool NDT and Inspection market. For instance, Inspection of OCTG, BHA, Drill pipes, rental tools for Drilling, etc.?
I am searching information about NDT market specifically in Mexico. Would like to know the market leaders in Mexico and their strengths and weaknesses. Does your report include the required information?