Elastography Imaging Market by Modality (Ultrasound, Magnetic Resonance Elastography), Application (Radiology, Cardiology, OB/GYN, Vascular, Orthopedic and Musculoskeletal), End User (Hospital, Surgery Center, Diagnostic Center) - Global Forecast to 2024


Elastography is a technique that maps the elastic properties and stiffness of soft tissue by using the imaging modality such as ultrasound and magnetic resonance imaging.
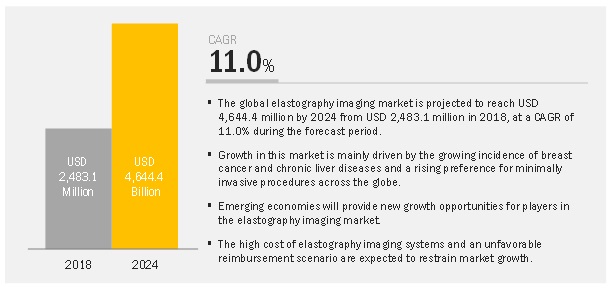
In this report, the global elastography imaging market has been categorized based on modality, application, end-user, and region. The market is projected to reach USD 4.64 billion by 2024 from USD 2.48 billion in 2018, at a CAGR of 11.0% during the forecast period.
The growth of this market is mainly driven by the growing incidence of breast cancer and chronic liver diseases and a rising preference for minimally invasive procedures across the globe.
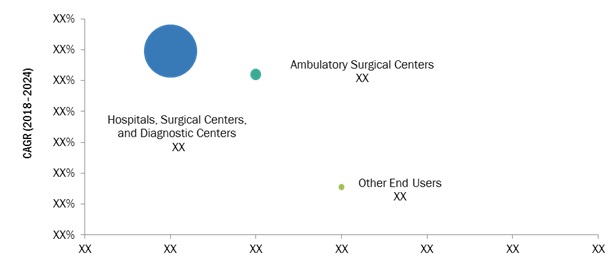
By end-user, hospitals, surgical centers, and diagnostic centers segment will continue to dominate the elastography imaging market in 2024
Based on end-users, the elastography imaging market is segmented into hospitals, surgical centers, & diagnostic centers; ambulatory surgical centers; and other end users. Among these end-user segments, hospitals, surgical centers, & diagnostic centers accounted for the largest share of the elastography imaging market in 2018.
Market growth is primarily driven by factors, such as the significant number of ultrasound and MRI-based elastography medical procedures performed in hospitals, the growing trend of workflow automation among healthcare providers, and the rising adoption of minimally invasive diagnostic & surgical procedures in these facilities.
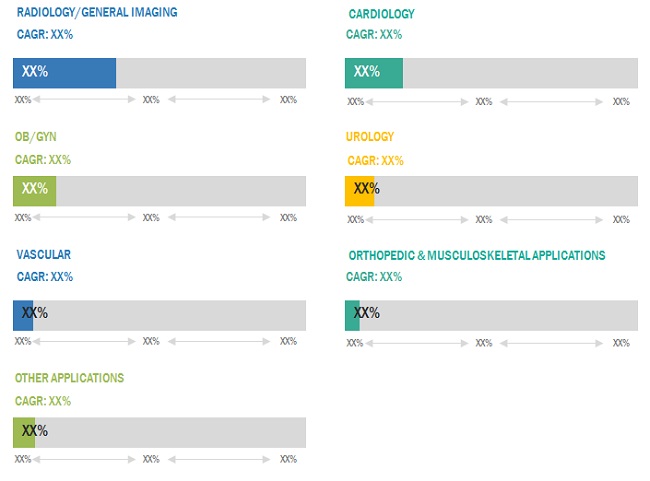
By application, the radiology/general imaging segment will command the largest share the elastography imaging market during the forecast period
Elastography imaging uses high-frequency soundwaves and mechanical waves to create images of the inside of the body. Currently, ultrasound is one of the most-preferred elastography imaging techniques as compared to other imaging modalities such as MRI and CT, owing to its minimally invasive nature, lower procedural cost, less/no side effects, and ease of use.
Based on applications, the elastography imaging market is divided into eight segments, namely radiology/general imaging, cardiology, OB/GYN, urology, vascular, orthopedic & musculoskeletal applications, and other applications (anesthesia, neurology, and bariatric surgery, among others).
Asia Pacific to grow at the highest CAGR during the forecast period
The Asia Pacific elastography imaging market is estimated to grow at the highest CAGR during the forecast period. Growth in this regional market can be attributed to the increasing healthcare expenditure across the region’s major countries (especially India and China), growing public awareness about the therapeutic potential of ultrasound technologies, a continuous decrease in device costs (due to increasing localized manufacturing and the presence of global market players), and rising prevalence of target diseases.
Market Dynamics
Driver: Growing incidence of breast cancer and chronic liver diseases
Breast cancer is among the most common cancers affecting women in developed as well as developing countries. According to the American Cancer Society, breast cancer is the second-leading cause of cancer-related deaths in women across the globe. Similarly, as per the US CDC, the death rates for chronic liver disease increased by an average of 5.3% per year during 2012–2016 in the US. During 2006–2016, the death rates for chronic liver disease and cirrhosis were higher among men than among women. Although biopsies have traditionally been considered the reference standard for the assessment of chronic liver diseases and breast cancer, noninvasive techniques such as ultrasound-based elastography and magnetic resonance (MR) elastography are the emerging focus in this field. As such, the growing prevalence of these diseases will support the growth of the elastography imaging segment.
Restraint: High cost of elastography imaging systems
Elastography imaging systems are priced at a premium and require high investments for installations, which increases the procedural cost for patients as well. This affects the adoption rate of new systems, especially in emerging countries; most healthcare facilities in these countries, consequently, cannot afford such systems. An elastography ultrasound machine, on average, costs between USD 30,000 to USD 125,000. Healthcare facilities that purchase such costly systems often depend on third-party payers for reimbursements for costs incurred in screening and diagnostic procedures performed with these systems. Moreover, it takes over two to five years for a system to secure compensation once launched in the market. Due to the high cost of these systems and budget constraints, healthcare facilities are reluctant to invest in new or technologically advanced systems.
Opportunity: Emerging markets to offer significant growth opportunities
Emerging markets (such as China, India, Brazil, and Mexico) are expected to offer significant growth opportunities for elastography imaging product manufacturers and distributors during the forecast period. This can be attributed to the growing number of minimally invasive procedures, the ever-increasing prevalence of chronic conditions, as well as increasing R&D initiatives.
Moreover, the development of healthcare systems and infrastructure in developing countries, along with their rising healthcare expenditure, will support the adoption of elastography devices. China’s healthcare market, for example, was expected to hit USD 748 billion (CNY 4.9 trillion) in 2017 (Source: Health Management Summit Report, Beijing). Both India and China registered high growth in government healthcare expenditure during 2010–2015 (Source: OECD). Private sector expenditure on the healthcare segment in India was around USD 60.8 billion in 2015, from USD 56 million in 2014. (Source: Statistica). The potential for growth has drawn several market players to these countries, to expand or establish their presence in these markets. Mature markets are also reaching saturation, prompting players to look for alternative avenues to offset falling profit margins.
Challenge: Survival of small players and entry barriers for new players
The survival of small players and new entrants in the elastography imaging market is a significant challenge, as huge investments are required to enter this market. This market demands the continuous improvement of existing products and technologies, as well as the launch of novel products. Thus, to remain competitive, companies have to invest heavily in R&D. Market players also have to maintain economies of scale and reduce operational costs to successfully survive in the market, thereby posing a significant challenge for small players and new entrants. Other barriers include the presence of a stringent product approval process and long time-to-market for a new product. For example, in the US, the FDA approval process takes several years to complete, owing to the presence of stringent regulations and norms.
Scope of the Report
|
Report Metric |
Details |
|
Market size available for years |
2016–2024 |
|
Base year considered |
2017 |
|
Forecast period |
2018–2024 |
|
Forecast units |
USD Million (Value) |
|
Segments covered |
Modality, Application, End-User, and Region |
|
Geographies covered |
North America, Europe, APAC, and RoW |
|
Companies covered |
GE Healthcare (US), Siemens Healthineers (Germany), Philips Healthcare (Netherlands), Canon Medical System Corporation (Japan), Samsung Medison (South Korea), Hitachi Ltd. (Japan), Shenzhen Mindray Bio-Medical Electronics Co. (China), FUJIFILM Holdings Corporation (Japan), Esaote (Italy), SuperSonic Imagine (France), and Resoundant (US) |
This research report categorizes the elastography imaging market based on Modality, Application, End User, and Region.
By Modality:
- Ultrasound
- Magnetic Resonance
By Application:
- Radiology/general imaging
- Cardiology
- OB/GYN
- Urology
- Vascular
- Orthopedic and musculoskeletal applications
- Other applications
By End-User:
- Hospitals, surgical centers, and diagnostic centers
- Ambulatory surgical centers
- Other end-users.
By Region:
-
North America
- US
- Canada
-
Europe
- Germany
- France
- UK
- RoE
- Asia Pacific
- India
- China
- Japan
- South Korea
- Indonesia
- RoW
Key Market Players
GE Healthcare (US), Siemens Healthineers (Germany), Philips Healthcare (Netherlands), Canon Medical System Corporation (Japan), Samsung Medison (South Korea)
Recent Developments
- In 2018, Philips entered into a 5-year strategic partnership with Erasmus University Medical Center. As per this partnership, Philips will assist in the management, procurement, maintenance, and optimization of ultrasound systems to the Erasmus Medical Center for the next five years.
- In 2018, Siemens AG opened its new corporate headquarters for management of the board and central functions of the firm, including human resources, finance, and communications, and marketing.
- In 2018, Samsung showcased its ultrasound systems at EUROSON (the 30th EUROSON Congress of the EFSUMB), Poland, to address evolving healthcare demands.
- In 2018, Canon Middle East (CME) expanded its regional presence by establishing direct operations in the Kingdom of Saudi Arabia.
- In 2018, GE Healthcare expanded collaboration with SonoSim to offer ultrasound training to primary care and point of care users. With this partnership, both companies are focused on enhancing education services for ultrasound users in different areas include women’s health, cardiology, point of care, and primary care.
Key questions addressed by the report:
- Who are the major market players in the elastography imaging market?
- What are the regional growth trends and the largest revenue-generating region for the elastography imaging market?
- What are the major drivers and opportunities of the elastography imaging market?
- What are the primary test types for elastography imaging?
- What are the major end-users for the elastography imaging market?
To speak to our analyst for a discussion on the above findings, click Speak to Analyst
 Exclusive indicates content/data unique to MarketsandMarkets and not available with any competitors.
Table of Contents
1 Introduction (Page No. - 13)
1.1 Objectives of the Study
1.2 Market Definition
1.3 Market Scope
1.3.1 Markets Covered
1.3.2 Years Considered for the Study
1.4 Currency
1.5 Limitations
1.6 Stakeholders
2 Research Methodology (Page No. - 16)
2.1 Research Data
2.1.1 Secondary Sources
2.1.2 Key Data From Secondary Sources
2.1.3 Primary Sources
2.1.3.1 Key Industry Insights
2.1.4 Key Data From Primary Sources
2.2 Market Size Estimation
2.3 Market Breakdown and Data Triangulation
3 Executive Summary (Page No. - 23)
4 Premium Insights (Page No. - 27)
4.1 Elastography Imaging: Market Overview
4.2 Europe: Elastography Imaging Market, By Application (2018)
4.3 Elastography Imaging Market Share, By End User, 2018 vs 2024
5 Market Overview (Page No. - 30)
5.1 Introduction
5.2 Market Dynamics
5.2.1 Drivers
5.2.1.1 Growing Incidence of Breast Cancer and Chronic Liver Diseases
5.2.1.2 Increasing Demand for Minimally Invasive Procedures
5.2.2 Restraints
5.2.2.1 High Cost of Elastography Imaging Systems
5.2.2.2 Unfavorable Reimbursement Scenario
5.2.3 Opportunities
5.2.3.1 Emerging Markets
5.2.4 Challenges
5.2.4.1 Survival of Small Players and Entry Barriers for New Players
6 Elastography Imaging Market, By Modality (Page No. - 34)
6.1 Introduction
6.2 Ultrasound
6.2.1 Ultrasound Segment Accounted for the Dominant Share of the Elastography Imaging Market in 2018
6.3 Magnetic Resonance Elastography
6.3.1 Mre Can Be Incorporated Into A Standard Mri Examinations to Provide Rapid, Reliable, and Comprehensive Imaging Assessment
7 Elastography Imaging Market, By Application (Page No. - 38)
7.1 Introduction
7.2 Radiology/General Imaging
7.2.1 Radiology/General Imaging is the Largest Application Segment of the Elastography Imaging Market
7.3 Cardiology
7.3.1 Rising Incidence of Cardiac Diseases to Drive Market Growth
7.4 Obstetrics/Gynecology
7.4.1 Stringent Government Regulations Governing the Obstetric Use of Ultrasound Devices to Restrain Market Growth
7.5 Urology
7.5.1 Rising Incidence of Prostate Cancer to Drive Market Growth
7.6 Vascular
7.6.1 Rising Incidence of Vascular Disorders Coupled With the Greater Adoption of Vascular Ultrasound for Disease Diagnosis to Support Market Growth
7.7 Orthopedic & Musculoskeletal Applications
7.7.1 Lack of Skilled Sonographers for Imaging Musculoskeletal-Based Disorders to Challenge Market Growth
7.8 Other Applications
8 Elastography Imaging Market, By End User (Page No. - 51)
8.1 Introduction
8.2 Hospitals, Surgical Centers, & Diagnostic Centers
8.2.1 Hospitals, Surgical Centers, & Diagnostic Centers are the Largest End Users of the Elastography Imaging Market
8.3 Ambulatory Surgical Centers
8.3.1 Increasing Number of Image-Guided Surgeries Performed in the Ascs is A Key Factor Driving Market Growth
8.4 Other End Users
8.4.1 Growing Number of Industry-Academia Collaborations Likely to Drive the Other End Users Market
9 Elastography Imaging Market, By Region (Page No. - 58)
9.1 Introduction
9.2 Europe
9.2.1 Europe is Expected to Dominate the Global Elastography Imaging Market During the Forecast Period
9.2.2 Germany
9.2.2.1 Germany Accounted for the Largest Share in the European Elastography Imaging Market
9.2.3 France
9.2.3.1 Need for Early Cancer Detection is A Key Factor Driving Market Growth in France
9.2.4 UK
9.2.4.1 The Increasing Proportion of Geriatric Individuals Will Contribute to Market Growth
9.2.5 Rest of Europe
9.3 North America
9.3.1 Rising Preference to Minimally Invasive Procedure to Drive This Market
9.3.2 US
9.3.2.1 US Expected to Hold the Largest Share of the North American Market in the Forecast Period
9.3.3 Canada
9.3.3.1 Increasing Incidence of Breast Cancer and Government Initiatives for Breast Cancer Awareness to Drive Market Growth in Canada
9.4 Asia Pacific
9.4.1 High Focus on Healthcare Modernization Will Create Growth Opportunities
9.5 Rest of the World
10 Competitive Landscape (Page No. - 77)
10.1 Introduction
10.1.1 Vanguards
10.1.2 Innovators
10.1.3 Dynamic Differentiators
10.1.4 Emerging
10.2 Market Ranking Analysis, 2017
10.3 Competitive Situation and Trends
10.3.1 Product Launches
10.3.2 Expansions
10.3.3 Partnerships
10.3.4 Acquisitions
11 Company Profiles (Page No. - 83)
(Business Overview, Products Offered, Recent Developments, MnM View)*
11.1 General Electric Company
11.2 Koninklijke Philips N.V.
11.3 Siemens AG
11.4 Canon Medical Systems Corporation
11.5 Hitachi Ltd.
11.6 Samsung Electronics (Samsung Medison)
11.7 Fujifilm Holdings Corporation
11.8 Mindray Medical International Ltd.
11.9 Esaote
11.10 Supersonic Imagine
11.11 Resoundant Inc.
*Business Overview, Products Offered, Recent Developments, MnM View Might Not Be Captured in Case of Unlisted Companies.
12 Appendix (Page No. - 105)
12.1 Discussion Guide
12.2 Knowledge Store: Marketsandmarkets’ Subscription Portal
12.3 Available Customizations
12.4 Related Reports
12.5 Author Details
List of Tables (66 Tables)
Table 1 Elastography Imaging Market, By Modality, 2016–2024 (USD Million)
Table 2 Ultrasound Elastography Imaging: Market, By Region, 2016–2024 (USD Million)
Table 3 North America: Ultrasound Elastography Imaging: Market, By Country, 2016–2024 (USD Million)
Table 4 Europe: Ultrasound Elastography Imaging: Market, By Country, 2016–2024 (USD Million)
Table 5 Magnetic Resonance Elastography Market, 2016–2024 (USD Million)
Table 6 Market, By Application, 2016–2024 (USD Million)
Table 7 Market for Radiology/General Imaging, By Region, 2016–2024 (USD Million)
Table 8 Europe: Market for Radiology/General Imaging, By Country, 2016–2024 (USD Million)
Table 9 North America: Market for Radiology/General Imaging, By Country, 2016–2024 (USD Million)
Table 10 Market for Cardiology, By Region, 2016–2024 (USD Million)
Table 11 Europe: Market for Cardiology, By Country, 2016–2024 (USD Million)
Table 12 North America: Market for Cardiology, By Country, 2016–2024 (USD Million)
Table 13 Market for Ob/Gyn, By Region, 2016–2024 (USD Million)
Table 14 Europe: Market for Ob/Gyn, By Country, 2016–2024 (USD Million)
Table 15 North America: Market for Ob/Gyn, By Country, 2016–2024 (USD Million)
Table 16 Market for Urology Applications, By Region, 2016–2024 (USD Million)
Table 17 Europe: Market for Urology Applications, By Country, 2016–2024 (USD Million)
Table 18 North America: Market for Urology Applications, By Country, 2016–2024 (USD Million)
Table 19 Market for Vascular Applications, By Region, 2016–2024 (USD Million)
Table 20 Europe: Market for Vascular Applications, By Country, 2016–2024 (USD Million)
Table 21 North America: Market for Vascular Applications, By Country, 2016–2024 (USD Million)
Table 22 Market for Orthopedic & Musculoskeletal Applications, By Region, 2016–2024 (USD Million)
Table 23 Europe: Market for Orthopedic & Musculoskeletal Applications, By Country, 2016–2024 (USD Million)
Table 24 North America: Market for Orthopedic & Musculoskeletal Applications, By Country, 2016–2024 (USD Million)
Table 25 Market for Other Applications, By Region, 2016–2024 (USD Million)
Table 26 Europe: Market for Other Applications, By Country, 2016–2024 (USD Million)
Table 27 North America: Market for Other Applications, By Country, 2016–2024 (USD Million)
Table 28 Market, By End User, 2016–2024 (USD Million)
Table 29 Market for Hospitals, Surgical Centers, & Diagnostic Centers, By Region, 2016–2024 (USD Million)
Table 30 Europe: Market for Hospitals, Surgical Centers, & Diagnostic Centers, By Country, 2016–2024 (USD Million)
Table 31 North America: Market for Hospitals, Surgical Centers, & Diagnostic Centers, By Country, 2016–2024 (USD Million)
Table 32 Market for Ambulatory Surgical Centers, By Region, 2016–2024 (USD Million)
Table 33 Europe: Market for Ambulatory Surgical Centers, By Country, 2016–2024 (USD Million)
Table 34 North America: Market for Ambulatory Surgical Centers, By Country, 2016–2024 (USD Million)
Table 35 Market for Other End Users, By Region, 2016–2024 (USD Million)
Table 36 Europe: Market for Other End Users, By Country, 2016–2024 (USD Million)
Table 37 North America: Market for Other End Users, By Country, 2016–2023 (USD Million)
Table 38 Market, By Region, 2016–2024 (USD Million)
Table 39 Europe: Market, By Country, 2016–2024 (USD Million)
Table 40 Europe: Market, By Application, 2016–2024 (USD Million)
Table 41 Europe: Market, By End User, 2016–2024 (USD Million)
Table 42 Germany: Market, By Application, 2016–2024 (USD Million)
Table 43 Germany: Market, By End User, 2016–2024 (USD Million)
Table 44 France: Market, By Application, 2016–2024 (USD Million)
Table 45 France: Market, By End User, 2016–2024 (USD Million)
Table 46 UK: Market, By Application, 2016–2024 (USD Million)
Table 47 UK: Market, By End User, 2016–2024 (USD Million)
Table 48 RoE: Market, By Application, 2016–2024 (USD Million)
Table 49 RoE: Market, By End User, 2016–2024 (USD Million)
Table 50 North America: Market, By Country, 2016–2024 (USD Million)
Table 51 North America: Market, By Application, 2016–2024 (USD Million)
Table 52 North America: Market, By End User, 2016–2024 (USD Million)
Table 53 Cms Reimbursement for Elastography Imaging Procedures, 2019
Table 54 US: Market, By Application, 2016–2024 (USD Million)
Table 55 US: Market, By End User, 2016–2024 (USD Million)
Table 56 Canada: Market, By Application, 2016–2024 (USD Million)
Table 57 Canada: Market, By End User, 2016–2024 (USD Million)
Table 58 Asia Pacific: Market, By Application, 2016–2024 (USD Million)
Table 59 Asia Pacific: Market, By End User, 2016–2024 (USD Million)
Table 60 RoW: Market, By Application, 2016–2024 (USD Million)
Table 61 RoW: Market, By End User, 2016–2024 (USD Million)
Table 62 Rank of Companies in the Global Elastography Imaging Market, 2017
Table 63 Product Launches, 2016-2018
Table 64 Expansions, 2016–2018
Table 65 Partnerships, 2016–2018
Table 66 Acquisitions, 2016–2018
List of Figures (24 Figures)
Figure 1 Research Design
Figure 2 Primary Sources
Figure 3 Elastography Imaging Market: Top-Down Approach
Figure 4 Elastography Imaging Market: Bottom-Up Approach
Figure 5 Data Triangulation Methodology
Figure 6 Market Share, By Modality (2018)
Figure 7 Market Share, By Application (2018)
Figure 8 Market, By End User (2018–2024)
Figure 9 Geographical Snapshot of the Elastography Imaging: Market
Figure 10 Elastography Imaging: Market to Register A Double-Digit Growth Rate During the Forecast Period
Figure 11 Radiology/General Imaging Segment Accounted for the Largest Share of the European Elastography Imaging: Market in 2018
Figure 12 Hospitals, Surgical Centers, and Diagnostic Centers Segment Will Continue to Dominate the Elastography Imaging: Market in 2024
Figure 13 Market: Drivers, Restraints, Opportunities, and Challenges
Figure 14 Europe: Market Snapshot
Figure 15 Asia Pacific: Market Snapshot
Figure 16 Dive Chart
Figure 17 General Electric Company: Company Snapshot (2018)
Figure 18 Koninklijke Philips N.V.: Company Snapshot (2018)
Figure 19 Siemens AG: Company Snapshot (2018)
Figure 20 Canon Medical Systems Corporation: Company Snapshot (2017)
Figure 21 Hitachi Ltd.: Company Snapshot (2017)
Figure 22 Samsung Electronics (Samsung Medison): Company Snapshot (2017)
Figure 23 Fujifilm Holdings Corporation: Company Snapshot (2017)
Figure 24 Supersonic Imagine: Company Snapshot (2017)
The study involved 4 major activities in estimating the current market size for elastography imaging. Exhaustive secondary research was done to collect information on the market as well as its peer and parent markets. The next step was to validate these findings, assumptions, and sizing with industry experts across the value chain through primary research. Both the top-down and bottom-up approaches were employed to estimate the complete market size. Thereafter, market breakdown and data triangulation were used to estimate the market size of segments and sub-segments.
Secondary Research
In the secondary research process, various secondary sources such as Hoovers, Bloomberg BusinessWeek, Forbes, and Dun & Bradstreet have been referred to, so as to identify and collect information useful for a technical, market-oriented, and commercial study of the elastography imaging market. These secondary sources included annual reports, press releases & investor presentations of companies, World Health Organization (WHO), Food and Drug Administration (FDA), National Health Service (NHS), Breastcancer.org, American College of Radiology, American College of Cardiology, European Society of Beast Imaging (EUSOBI), International Agency of Research on Cancer, National Breast and Ovarian Cancer Centre. Secondary research was mainly used to obtain key information about the industry’s supply chain, the total pool of key players, market classification, and segmentation, according to the industry trends to the bottom-most level and regional markets. It was also used to obtain information about the key developments from a market-oriented perspective.
Primary Research
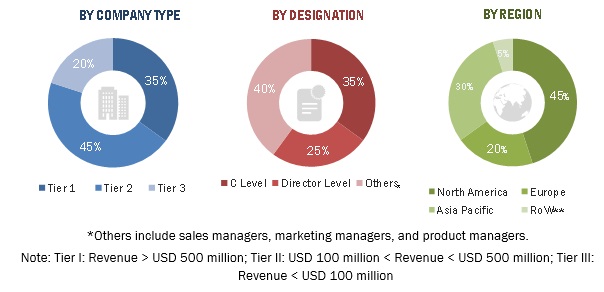
The elastography imaging market comprises several stakeholders such as raw material suppliers, manufacturers of elastography imaging, and regulatory organizations in the supply chain. Various primary sources from both the supply and demand sides of the market were interviewed to obtain qualitative and quantitative information. The primary interviewees from the demand side include key opinion leaders in the hospitals, surgical & diagnostic centers; ambulatory surgical centers. The primary sources from the supply side include key opinion leaders, distributors, and elastography imaging manufacturers. Various primary sources from both the supply and demand sides of the market were interviewed to obtain qualitative and quantitative information. Given below is the breakdown of the primary respondents:
To know about the assumptions considered for the study, download the pdf brochure
Market Size Estimation
Both the top-down and bottom-up approaches were used to estimate and validate the total size of the elastography imaging market. These approaches were also used extensively to estimate the size of various sub-segments in the market. The research methodology used to estimate the market size includes the following:
- Key players have been identified through extensive secondary research.
- The elastography imaging industry’s value chain and market size, in terms of value have been determined through primary and secondary research.
- All percentage shares, splits, and breakdowns have been determined using secondary sources and verified through primary sources.
- All possible parameters that affect the market covered in this research study have been accounted for, viewed in extensive detail, verified through primary research, and analyzed to obtain the final quantitative and qualitative data.
Data Triangulation
After arriving at the overall market size—using the market size estimation processes explained above—the market was split into several segments and sub-segments. To complete the overall market engineering process and arrive at the exact statistics of each market segment and sub-segment, data triangulation and market breakdown procedures were employed, wherever applicable. The data was triangulated by studying various factors and trends from both the demand and supply sides of the elastography imaging industry.
Report Objectives
- To define, segment, and project the global market size for elastography imaging
- To understand the structure of the elastography imaging market by identifying its various sub-segments
- To provide detailed information about the key factors influencing the growth of the market (drivers, restraints, and opportunities)
- To project the size of the market and its sub-markets, in terms of value and volume, with respect to 4 regions (along with their respective key countries)
- To profile key players and comprehensively analyze their core competencies
- To understand the competitive landscape and identify the major growth strategies adopted by players across key regions
- To analyze the competitive developments such as product launch, expansions, partnership, collaboration, agreement and acquisitions in the elastography imaging market
Available Customizations
With the given market data, MarketsandMarkets offers customizations according to company-specific scientific needs.
The following customization options are available for the report:
Regional Analysis
- Further breakdown of Asia Pacific elastography imaging market, by key country

 Generating Response ...


Growth opportunities and latent adjacency in Elastography Imaging Market