
Electric Ship Market Size, Size, Share & Trends 2032

Electric Ship Market by Point of Sale (Newbuild & Line Fit vs. Retrofit), Technology (Fully Electric vs. Hybrid), Ship Type (Commercial, Defense), Solution (Storage, Conversion, Generation, Distribution, Drive) and Region - Global Forecast to 2032


ELECTRIC SHIP MARKET OVERVIEW
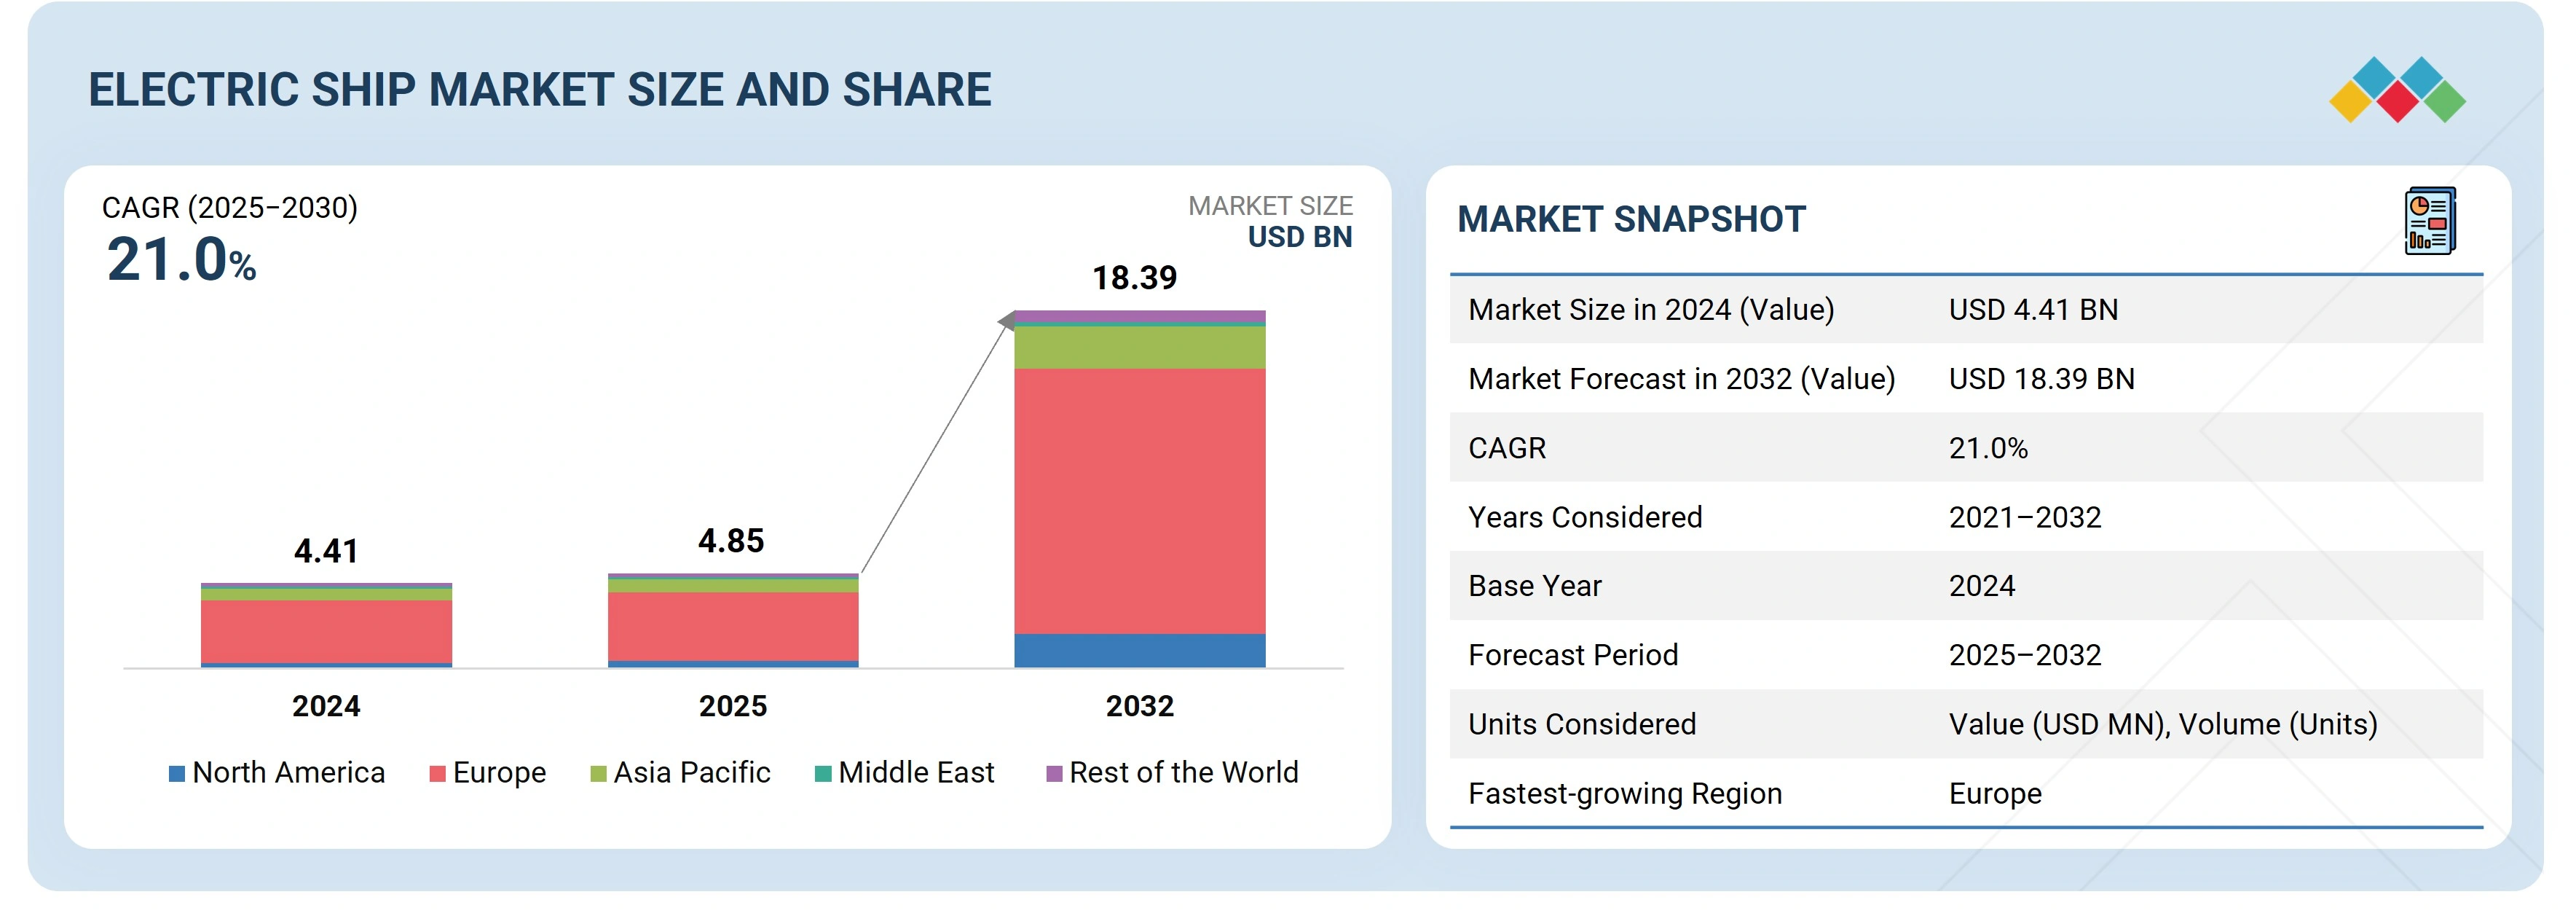
The Electric Ship Market Size is estimated at USD 4.85 billion in 2025 and is projected to reach USD 18.39 billion by 2032, at a CAGR of 21.0%. In terms of volume, the electric ship market is projected to grow from 553 units in 2024 to 2,958 units in 2032. Market growth is driven by the increasing demand for low-emission maritim
The Electric Ship Market is gaining strong momentum as maritime industries move toward cleaner propulsion technologies and lower emissions. The Electric Ship Market size is expanding steadily due to increasing investments in sustainable marine transport, battery powered vessels, and hybrid propulsion systems. Growing environmental regulations and decarbonization targets are influencing the Electric Ship Market share across commercial shipping, naval fleets, and passenger ferries. As governments and shipbuilders invest in electric propulsion infrastructure, the Electric Ship Market growth continues to accelerate globally. The power Ship Market is also evolving alongside the Electric and Ship Market, with advanced power management systems, lithium ion battery technologies, and integrated propulsion solutions driving innovation in vessel electrification.
Several emerging Electric Ship Market trends highlight the transition toward fully electric and hybrid vessels for short distance maritime operations. Increasing adoption of shore power systems, autonomous electric vessels, and smart grid integration is shaping the future of the Electric Ship Market. The US Electric ship Market is particularly witnessing strong development due to federal sustainability initiatives, modernization of naval fleets, and growing investments in electric ferries and commercial vessels. With technological advancements and rising environmental awareness, the Electric Ship Market size and Electric Ship Market share are expected to grow significantly over the coming years, strengthening the global Electric and Ship Market ecosystem and reinforcing the long term Electric Ship Market growth outlook.
ELECTRIC SHIP MARKET Size & Forecast
KEY TAKEAWAYS
-
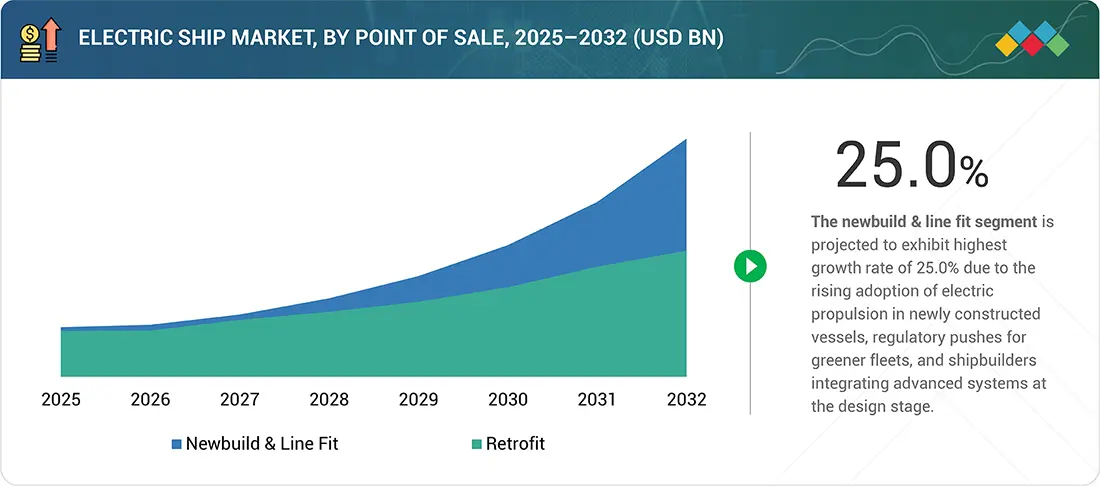
BY POINT OF SALEThe electric ship market by point of sale comprises newbuild & line fit and retrofit solutions. Newbuild & line fit dominate as shipyards integrate electric propulsion, battery storage, and hybrid systems directly during vessel construction, ensuring compliance with emission norms and reducing lifecycle costs. Retrofit solutions are gaining importance as existing fleets are upgraded with energy storage systems, shore power connectivity, and hybrid configurations to meet sustainability targets.
-
BY TONNAGEThe electric ship market by tonnage includes <500 DWT, 500–5,000 DWT, 5,001–15,000 DWT, and >15,000 DWT. The <500 DWT category leads adoption, covering ferries, harbor craft, and service vessels suited for full-electric operation.
-
BY SOLUTIONThe electric ship market by solution includes power storage, power conversion, power generation, power distribution, power drive, and system integration services.
-
BY RANGEThe electric ship market by range comprises <50 km, 50–100 km, 100–1,000 km, and >1,000 km. The 50–100 km range is the largest segment, driven by passenger ferries, inland waterway vessels, and short-sea cargo ships with frequent port calls and access to charging.
-
BY SHIP TYPEThe electric ship market by ship type comprises commercial and defense vessels. The commercial segment drives volume, whereas the defense segment advances high-performance, stealth-oriented solutions.
-
BY POWER CAPACITYThe electric ship market by power capacity includes <75 kW, 75–150 kW, 151–745 kW, 746–7,560 kW, and >7,560 kW. The 75–150 kW segment dominates due to widespread use in ferries, motorboats, and small cargo ships, while higher ranges support larger vessels with hybrid configurations.
-
BY AUTONOMYThe electric ship market by autonomy comprises manned, remotely operated, and autonomous vessels. Manned ships dominate current adoption, remotely operated vessels expand in offshore and defense use, while autonomous ships form the fastest-growing segment with advances in AI and automated navigation.
-
BY REGIONThe market has been segmented by region into North America, Europe, Asia Pacific, Middle East, and Rest of the World. Major ports across Scandinavia and Western Europe are investing heavily in shore power and charging infrastructure, enabling wider adoption of electric ferries and coastal vessels. Strong collaboration between governments, maritime clusters, and technology providers accelerates the commercialization of zero-emission vessels.
-
COMPETITIVE LANDSCAPEMajor players in the electric ship market have adopted both organic and inorganic strategies, including partnerships, joint ventures, and technology investments. For instance, ABB Marine & Ports, Wärtsilä, Kongsberg Maritime, Siemens Energy, and Yara Marine Technologies have entered into multiple collaborations and pilot projects to advance battery storage, hybrid propulsion, shore power connectivity, and autonomous navigation.
The future of the electric ship industry is expected to be driven by the increasing integration of electric and hybrid propulsion across passenger ferries, harbor crafts, short-sea cargo, and defense support vessels. This trend aligns with global decarbonization goals and government-led initiatives promoting maritime sustainability and green port infrastructure. Progress in battery technologies, energy management systems, and modular electric drivetrains is likely to reduce lifecycle costs and improve operational efficiency. As regulatory pressure grows through carbon pricing and zero-emission targets, electric ships are positioned as a critical enabler in the transformation of global maritime transport toward a cleaner and more resilient future.
Source: Secondary Research, Interviews with Experts, MarketsandMarkets Analysis
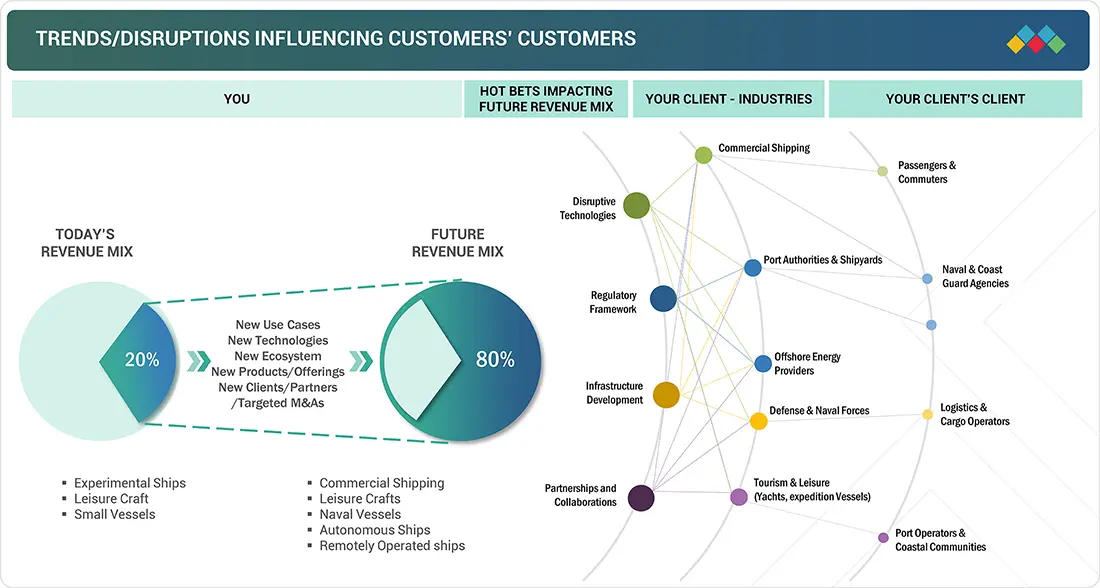
TRENDS & DISRUPTIONS IMPACTING CUSTOMERS' CUSTOMERS
The impact on maritime businesses is being shaped by emerging customer demands and sustainability-driven disruptions. Numerous electric ship startups and maritime OEMs are seeking venture capital funding, strategic partnerships, and joint ventures to accelerate innovation in electric propulsion and onboard power systems. These collaborations are helping develop critical charging infrastructure and high-performance battery technologies, expanding the adoption potential across commercial, defense, and logistics fleets.
Source: Secondary Research, Interviews with Experts, MarketsandMarkets Analysis
ELECTRIC SHIP MARKET DYNAMICS
Level
-
Favorable regulatory frameworks and government initiatives

-
Rise in short-sea transport and coastal tourism

Level
-
High upfront investment and prolonged retrofit downtime

-
Technical limitations in range and power scalability

Level
-
Innovation in energy storage solutions

-
Scaling of battery and fuel cell technologies for long-range shipping

Level
-
Supply chain issues for critical materials

-
Lack of adequate charging and port infrastructure

Source: Secondary Research, Interviews with Experts, MarketsandMarkets Analysis
Driver: Favorable regulatory frameworks and government initiatives
Favorable regulatory frameworks and government initiatives are creating strong momentum for the electric ship market. The International Maritime Organization’s decarbonization targets, coupled with regional emission norms in Europe, North America, and the Asia Pacific, are compelling operators to adopt greener propulsion systems. Governments are supporting this transition with grants, tax incentives, and port infrastructure upgrades to accommodate charging and hybrid operations. These initiatives reduce investment risks, encourage innovation, and accelerate the commercialization of hybrid and fully electric vessels.
Restraint: High upfront investment and prolonged retrofit downtime
One of the most significant barriers to electric ship adoption is the high initial cost associated with propulsion systems, battery packs, onboard power management units, and safety controls. These systems can increase vessel cost by 30–60% compared to conventional diesel propulsion, depending on the vessel type and operational profile. Additionally, retrofitting existing fleets for partial or full electrification involves structural redesign, removal of legacy systems, battery placement, and shore power interface installations all of which require the vessel to be out of service for extended periods.
Opportunity: Innovations in energy storage solutions
Energy storage is central to the operation of hybrid and electric ships. Battery-based propulsion is increasingly applied in smaller vessels, while engine manufacturers are developing hybrid battery solutions for larger vessels. Ongoing technological innovations are expanding the range of energy storage solutions relevant for maritime use. Beyond lithium-ion, there are efforts to develop alternatives such as silicon-based, sodium-sulfur, proton, graphite dual-ion, aluminum-ion, nickel-zinc, potassium-ion, salt-water, paper-polymer, and magnesium batteries.
Challenge: Supply chain issues of critical materials
The electric ship market depends heavily on critical raw materials such as lithium, cobalt, nickel, and rare earth elements for batteries, electric motors, and power electronics. These materials face growing global demand from EVs, grid storage, and industrial electrification creating intense supply pressure. Many of these resources are geographically concentrated, often in politically unstable regions, making prices volatile and access uncertain. Additionally, ethical concerns and ESG requirements related to mining practices are increasing scrutiny on sourcing.
Electric Ship Market: COMMERCIAL USE CASES ACROSS INDUSTRIES
| COMPANY | USE CASE DESCRIPTION | BENEFITS |
|---|---|---|
 |
Yara launched the Yara Birkeland, the world’s first fully electric and autonomous container vessel for short-sea logistics in 2021. | Reduced CO2 and NO? emissions, Cuts 1,000 tonnes of CO2 annually, eliminates 40,000 truck trips per year, and sets benchmarks for zero-emission autonomous shipping.. |
 |
Wärtsilä deployed hybrid propulsion and advanced battery storage systems for the Aurora Botnia ferry, operating on the Kvarken route between Finland and Sweden. | Improved fuel efficiency by 50%, lowered emissions, and enabled flexible vessel operations in harsh Nordic conditions |
 |
ABB equipped Grandi Navi Veloci ferries with shore-to-ship power connectivity and battery support to cut port emissions. | Reduced port CO2 emissions by 30–40%, cut particulate matter by up to 98%, and ensured compliance with EU port emission standards |
 |
Kongsberg supplied propulsion and autonomous navigation systems for MS Ro Vision, the world’s first hybrid-electric live fish carrier. | Increased operational safety, supported semi-autonomous operations, and demonstrated scalable digital integration in maritime fleets. |
 |
Siemens Energy delivered modular power distribution systems for Elektra, the world’s first hydrogen-electric push boat. | Achieved 100% CO2-free operations, optimized energy distribution efficiency by 15%, and enabled emission-free inland waterway transport. |
 |
Corvus supplied battery systems for BC Ferries’ hybrid-electric vessels under its Island Class program. | Delivered high-capacity energy storage, reduced fuel costs by 25–30%, and enabled scalable electrification of short-haul routes. |
Logos and trademarks shown above are the property of their respective owners. Their use here is for informational and illustrative purposes only.
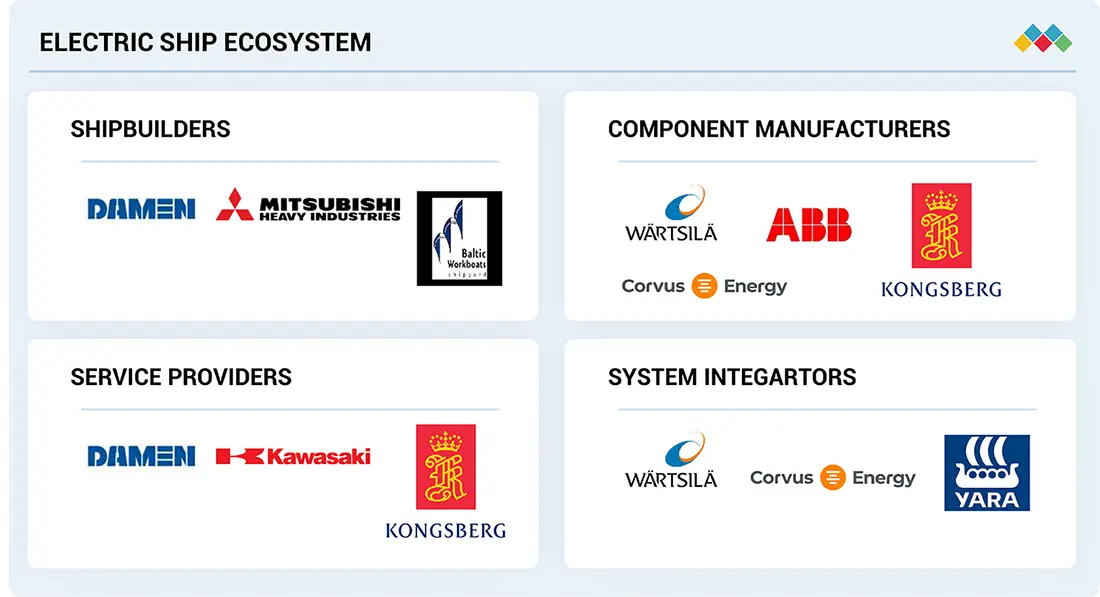
ELECTRIC SHIP MARKET ECOSYSTEM
The key stakeholders in the market ecosystem are component manufacturers, system integrators, service providers, and ship builders. The following figure lists some key players working in the electric ship ecosystem. Major influencers in the market are investors, academic researchers, service providers, distributors, and companies producing components.
Logos and trademarks shown above are the property of their respective owners. Their use here is for informational and illustrative purposes only.
ELECTRIC SHIP MARKET SEGMENTS
Source: Secondary Research, Interviews with Experts, MarketsandMarkets Analysis
Electric Ship Market, By Range
The 50-100 km range vessels are expected to hold the largest share due to their alignment with short-sea and inland waterway operations. This range is optimal for passenger ferries, short-haul cargo carriers, and service vessels that have frequent access to charging infrastructure. The segment benefits from advancements in battery energy density and fast-charging systems, enabling reliable operations without compromising turnaround times.
Electric Ship Market, By Power Capacity
The 75–150 kW vessels are projected to dominate the electric ship market during the forecast period, driven by their suitability for small ferries, motorboats, and harbor craft that operate on short to medium ranges. These vessels typically require moderate propulsion power, making this category cost-effective and technologically viable with current battery capabilities. Growing investments in coastal transport electrification, particularly in Europe and the Asia Pacific, are further supporting this segment’s expansion.
Electric Ship Market, By Tonnage
The <500 DWT segment is projected to lead adoption in the early phase of the electric ship market, as smaller vessels are ideally suited for full-electric propulsion. The segment benefits from the availability of compact battery packs, rapid charging infrastructure, and strong regulatory support for the electrification of inland waterways and coastal transport.
Electric Ship Market, By Autonomy
The manned segment currently represents the largest share of the electric ships market, reflecting the widespread adoption of electric and hybrid propulsion in traditional vessel operations. Manned electric vessels are particularly prevalent in short-sea routes and inland waterways, where predictable operations and access to charging infrastructure make battery integration practical.
Electric Ship Market, By Ship Type
The commercial segment accounts for the largest share of the electric ship market and is expected to remain the dominant category throughout the forecast period. This segment includes ferries, cargo carriers, cruise ships, yachts, and motorboats, where electrification is being driven by rising regulatory pressure to reduce maritime emissions and growing investments in sustainable transport infrastructure.
Electric Ship Market, By Point of Sale
The newbuild & line fit segment is projected to lead the electric ship market, supported by strong demand for newly constructed vessels designed with integrated electric and hybrid propulsion systems. Shipbuilders are increasingly incorporating battery storage, power distribution, and digital control solutions during the construction phase, ensuring compliance with evolving emission regulations and future-proofing fleets.
Electric Ship Market, By Solution
The power distribution segment is expected to dominate the electric ship market. This segment is a critical enabler of electric ship operations, ensuring the efficient transfer of electricity from onboard storage systems to propulsion drives and auxiliary loads. Modern electric ships increasingly rely on integrated distribution networks that manage energy flows across propulsion, navigation, and hoteling functions, particularly in ferries, cruise ships, and offshore support vessels.
ELECTRIC SHIP MARKET REGION
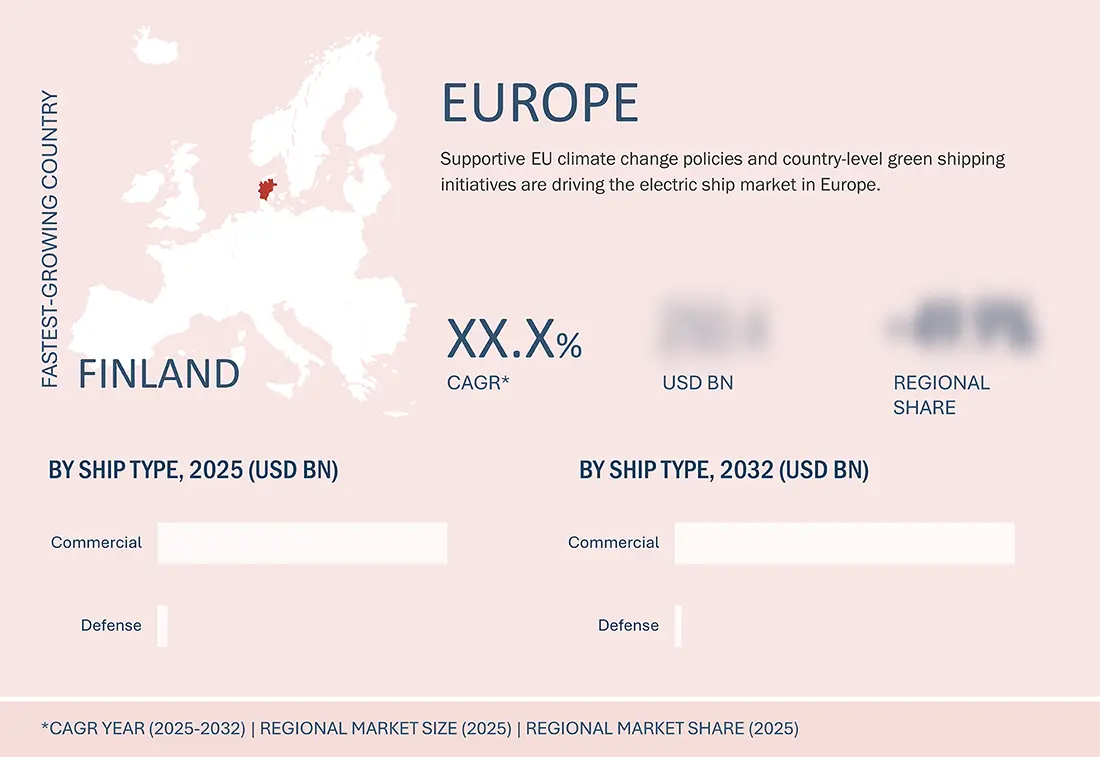
Europe to be fastest-growing region in global electric ship market during forecast period
Europe is projected to be the fastest-growing region in the global electric ship market due to stringent decarbonization policies, strong government funding, and early adoption of green maritime technologies. The International Maritime Organization’s emission targets, alongside the EU’s Fit for 55 package, are driving investments in electrification, shore charging networks, and hybrid propulsion solutions.
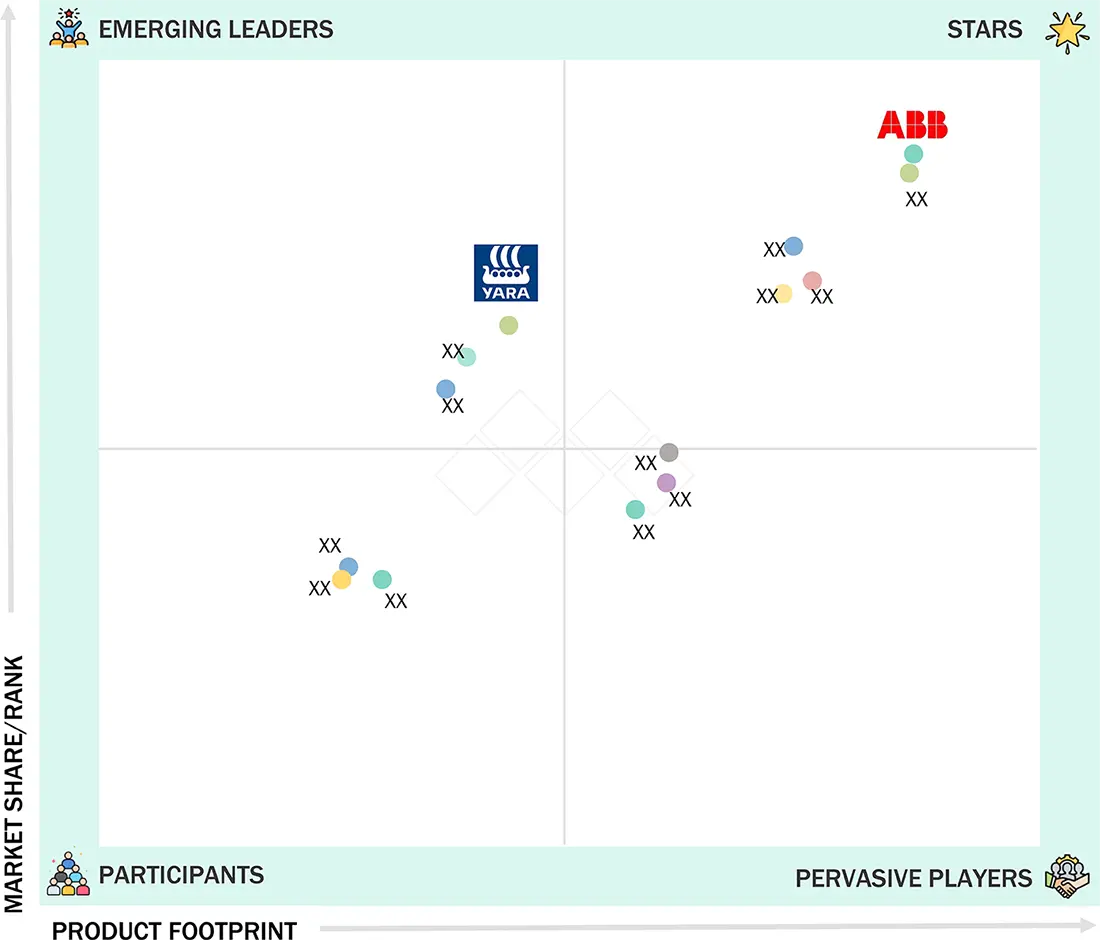
Electric Ship Market: COMPANY EVALUATION MATRIX
The company evaluation matrix for the electric ship market evaluates players based on product footprint and market share. It highlights their competitive positioning and ranks them according to market strength and growth strategies. ABB is positioned as a leading player with a strong focus on advanced technologies, while Yara is recognized as an emerging leader in this market.
Source: Secondary Research, Interviews with Experts, MarketsandMarkets Analysis
ELECTRIC SHIP MARKET KEY PLAYERS
List of Top Electric Ship Market Companies
ELECTRIC SHIP MARKET SCOPE
| REPORT METRIC | DETAILS |
|---|---|
| Market Size in 2024 (Value) | USD 4.41 Billion |
| Market Forecast in 2032 (value) | USD 18.39 Billion |
| Growth Rate | CAGR of 21.0% from 2025–2032 |
| Years Considered | 2021–2032 |
| Base Year | 2024 |
| Forecast Period | 2025–2032 |
| Units Considered | Value (USD Billion), Volume (Units) |
| Report Coverage | Revenue forecast, company ranking, competitive landscape, growth factors, and trends |
| Segments Covered |
|
| Regions Covered | North America, Europe, Asia Pacific, Middle East, and Rest of the World |
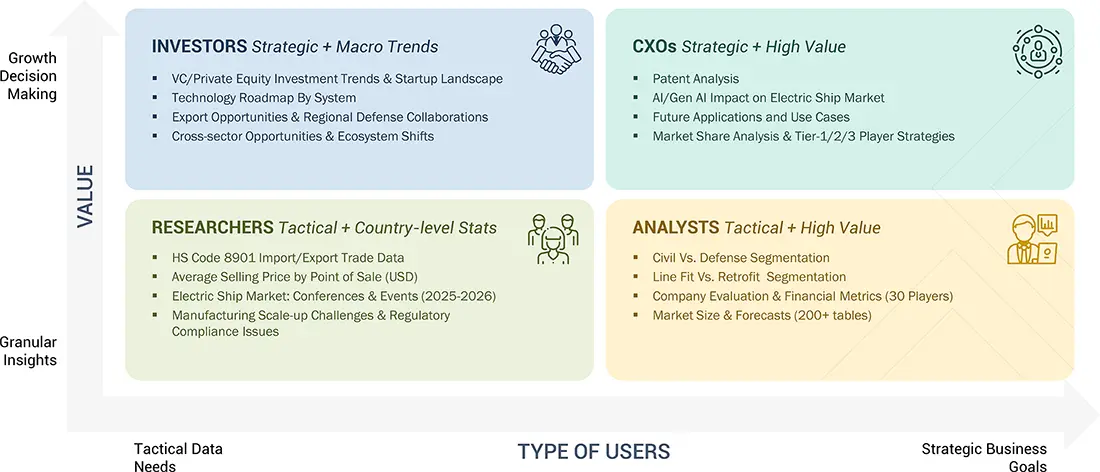
WHAT IS IN IT FOR YOU: Electric Ship Market REPORT CONTENT GUIDE
DELIVERED CUSTOMIZATIONS
We have successfully delivered the following deep-dive customizations:
| CLIENT REQUEST | CUSTOMIZATION DELIVERED | VALUE ADDS |
|---|---|---|
| Comprehensive Electric Ships Market Analysis with Focus on Market Players and Ecosystem | This is a dedicated electric ship market study focusing on the ecosystem of solution providers, component suppliers, and OEMs. It also provides lifespan analysis of vessels by type and pricing benchmarks across key regions. The study also provides supply chain mapping of components, system integrators, and end users, alongside a comparative assessment of thermal management pricing structures by ship category and region. |
|
RECENT DEVELOPMENTS
- August 2025 : GE Vernova Naval Systems was awarded a USD 10.4 million contract by the US Navy to prototype a megawatt-scale hybrid modular multi-level converter (HMMC) for naval propulsion and power distribution.
- August 2025 : Corvus Energy was selected to supply the energy storage system powering the world’s first fully electric offshore construction vessel. The vessel will rely entirely on the ESS for main propulsion rather than hybrid assistance.
- July 2025 : SCHOTTEL was awarded a contract by French maritime service provider Louis Dreyfus Armateurs (LDA) to supply eight SRP 430 D RudderPropeller Dynamic units for two service operation vessels being built for Vattenfall.
- July 2025 : Kongsberg was contracted to upgrade the Norwegian Coastal Administration’s hybrid vessel, OV Bøkfjord, by installing electric Rim-Drive azimuth thrusters and enhancing its hybrid propulsion system.
- June 2025 : Wärtsilä secured a contract from Vertom Group to supply hybrid propulsion systems for four 10,700 DWT tween-decker vessels under construction at Chowgule Shipyards in India. The solution integrates Wärtsilä 25 engines, electric drive systems, CPP, thrusters, and EcoControl, enabling battery-only sailing in specific conditions.
Table of Contents
 Exclusive indicates content/data unique to MarketsandMarkets and not available with any competitors.
Methodology
The study involved four major activities in estimating the current size of the electric ship market. Extensive secondary research was conducted to collect information on the electric ship market, its adjacent markets, and its parent market. The next step was to validate these findings, assumptions, and sizing with industry experts across the value chain through primary research. Demand-side analysis was carried out to estimate the overall size of the market. After that, market breakdown and data triangulation procedures were used to estimate the sizes of different segments and subsegments of the electric ship market.
Secondary Research
In the secondary research process, various sources were referred to identify and collect information for this study. The secondary sources included government sources; corporate filings such as annual reports, press releases, and investor presentations of companies; white papers, journals, and certified publications; and articles from recognized authors, directories, and databases.
Primary Research
Extensive primary research was conducted after acquiring information regarding the market scenario through secondary research. Several primary interviews were conducted with market experts from both the demand and supply sides across North America, Europe, Asia Pacific, the Middle East, and the Rest of the World, comprising Africa and Latin America. Primary data was collected through questionnaires, emails, and telephone interviews.

To know about the assumptions considered for the study, download the pdf brochure
Market Size Estimation
The top-down and bottom-up approaches were used to estimate and validate the size of the electric ship market. The research methodology used to estimate the market size includes the following details.
- Key players in the electric ship market were identified through secondary research, and their market share was determined through primary and secondary research. This included a study of the annual and financial reports of the top market players and extensive interviews with leaders such as directors, engineers, marketing executives, and other stakeholders of leading companies operating in the electric ship market.
- All percentage shares, splits, and breakdowns were determined using secondary sources and verified through primary sources. All possible parameters that affect the markets covered in this research study were accounted for, viewed in extensive detail, verified through primary research, and analyzed to obtain the final quantitative and qualitative data on the electric ship market. This data was consolidated, enhanced with detailed inputs, analyzed by MarketsandMarkets, and presented in this report.
Electric Ship Market : Top-Down and Bottom-Up Approach

Data Triangulation
After arriving at the overall market size, the total market was split into several segments and subsegments. The data triangulation and market breakdown procedures explained below were implemented, wherever applicable, to complete the overall market engineering process and arrive at the estimated market numbers for the market segments and subsegments. The data was triangulated by studying various factors and trends from the demand and supply sides. The market size was also validated using the top-down and bottom-up approaches.
Market Definition
The electric ship encompasses the development, deployment, and operation of vessels that utilize full or hybrid electric propulsion systems. It includes applications across passenger ferries, cargo vessels, defense platforms, and service ships, supported by advanced batteries, hybrid energy storage, and integrated power management systems. The market is driven by stringent environmental regulations, high fuel costs, and improvements in energy storage and distribution technologies that enhance operational efficiency and reduce lifecycle emissions. Beyond propulsion, the scope extends to supporting port infrastructure, charging networks, and digital energy management solutions that enable wider adoption.
Key Stakeholders
- System/Component Manufacturers
- Passenger Vessel Operators
- Shipping Vessel Operators
- Government Organizations
- Shipbuilders
- System Integrators
Report Objectives
- To define, describe, segment, and forecast the size of the electric ship market based on point of sale, solution, ship type, power capacity, tonnage, range, autonomy, and region from 2025 to 2032
- To forecast the size of market segments with respect to five major regions, namely North America, Europe, Asia Pacific, the Middle East, and the Rest of the World
- To identify and analyze key drivers, restraints, opportunities, and challenges influencing market growth
- To strategically analyze micro markets with respect to individual growth trends, prospects, and their contribution to the market
- To analyze opportunities for stakeholders in the market by identifying key market trends
- To analyze competitive developments such as acquisitions, agreements, contracts, expansions, joint ventures, partnerships, product launches/developments, and R&D activities in the market
- To provide a detailed competitive landscape of the market, in addition to an analysis of business and corporate strategies adopted by leading market players
- To strategically profile key market players and comprehensively analyze their core competencies
Customization Options
MarketsandMarkets offers the following customizations for this market report:
- Additional country-level analysis of the electric ship market
- Profiling of five additional market players
Product Analysis
- Product matrix, which provides a detailed comparison of the product portfolio of each company in the electric ship market
Company Information
- Detailed analysis and profiling of up to five additional market players
Key Questions Addressed by the Report
What is the projected market size of the electric ship market?
The electric ship market is projected to reach USD 18.39 billion by 2032, growing at a CAGR of 21.0%.
Which regions are covered and which region is growing fastest in the electric ship market?
The market is analyzed across North America, Europe, Asia Pacific, the Middle East, and the Rest of the World, with Europe expected to be the fastest-growing region due to strong decarbonization policies and investments.
What are the key segments of the electric ship market?
The market is segmented by point of sale, ship type, solution, range, power capacity, autonomy, and region, covering a wide range of operational and technological categories.
Which segment is expected to lead the market during the forecast period?
The commercial ship segment is expected to dominate the market, while newbuild and line fit solutions and short-range vessels are driving adoption due to regulatory compliance and operational efficiency.
Who are the key players in the electric ship market?
Major companies operating in the market include ABB, Wärtsilä, Kongsberg Maritime, Siemens Energy, GE Vernova, and VARD AS, focusing on electric propulsion and hybrid maritime technologies.
Need a Tailored Report?
Customize this report to your needs
Get 10% FREE Customization
Customize This ReportPersonalize This Research
- Triangulate with your Own Data
- Get Data as per your Format and Definition
- Gain a Deeper Dive on a Specific Application, Geography, Customer or Competitor
- Any level of Personalization
Let Us Help You
- What are the Known and Unknown Adjacencies Impacting the Electric Ship Market
- What will your New Revenue Sources be?
- Who will be your Top Customer; what will make them switch?
- Defend your Market Share or Win Competitors
- Get a Scorecard for Target Partners

Custom Market Research Services
We Will Customise The Research For You, In Case The Report Listed Above Does Not Meet With Your Requirements
Get 10% Free CustomisationTESTIMONIALS
Growth opportunities and latent adjacency in Electric Ship Market


Charles
Apr, 2026
Can I see how you compare newbuild vessels versus retrofit opportunities in terms of market size and growth?.
Ryan
Apr, 2026
Do you include pricing trends and investment insights for electric ship technologies and components?.