
Electric Truck Market

Electric Truck Market Size, Share & Industry Analysis by Propulsion (BEV, PHEV, FCEV), Type (Light-duty Trucks, Medium-duty Trucks, Heavy-duty Trucks), Range, Battery Type, Battery Capacity, Level of Automation, End User, Payload Capacity, and Region - Global Forecast to 2032


OVERVIEW
Source: Secondary Research, Interviews with Experts, MarketsandMarkets Analysis
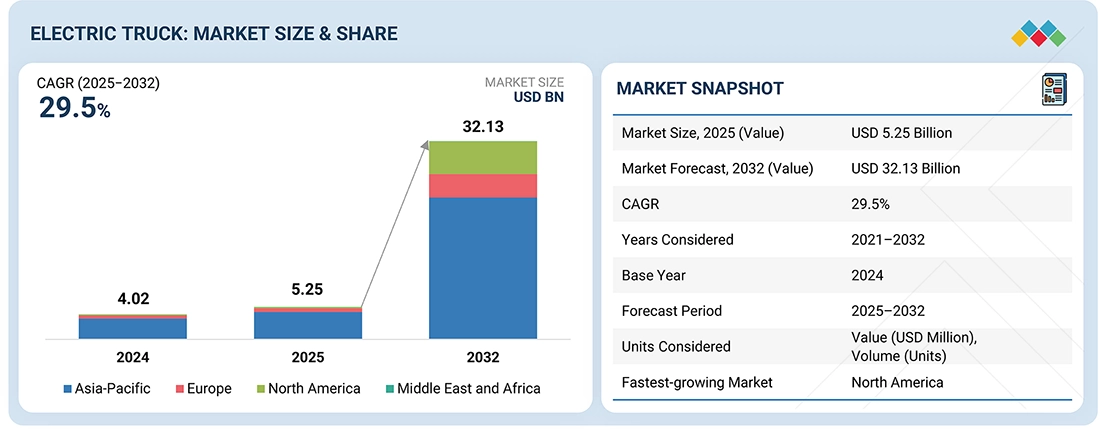
The electric truck market size is estimated at USD 5.25 billion in 2025 and is projected to reach USD 32.13 billion by 2032, registering a CAGR of 29.5%. Growing emphasis on emission-free mobility is accelerating electric truck adoption, with logistics and e-commerce as primary demand drivers. OEMs are strategically expanding revenue streams and their global footprint within the electric commercial vehicle ecosystem. Leaders, including BYD, AB Volvo, Ford, Rivian, and Dongfeng, are pursuing differentiated strategies to consolidate competitive advantage.
Market Size and Forecast:
- Market Size Value in 2025: USD 5.25 Billion
- Revenue Forecast in 2032: USD 32.13 Billion
- Growth Rate: CAGR of 29.5% from 2025 to 2032
- Data available from 2021 to 2032
- Base year: 2024
- Forecast period: 2025–2032
Key Market Trends and Insights
- Market Growth: Growth is driven by rising demand for zero-emission freight transportation, increasing fleet electrification, stringent emission regulations, and expanding government incentives for commercial electric vehicles.
-
Technology Impact: Advancements in battery technology, high-capacity energy storage systems, megawatt charging infrastructure, and connected fleet management solutions are improving electric truck performance and operational efficiency.
- Growing Trends: The market is witnessing increased adoption of battery-electric trucks, autonomous driving technologies, modular battery architectures, software-defined vehicle platforms, and electrification of medium- and heavy-duty commercial fleets.
- Growth Opportunities: Opportunities are driven by ongoing development of self-driving truck technology, innovations in fuel cell systems, expansion of charging infrastructure, and growing demand from logistics, e-commerce, and last-mile delivery sectors.
KEY TAKEAWAYS
-
BY PAYLOAD CAPACITYBy payload capacity, the market is segmented into up to 10,000 lbs, 10,001–26,000 lbs, and above 26,000 lbs. Up to 10,000 lbs suits urban last-mile, 10,001–26,000 lbs drives fastest fleet electrification, while above 26,001 lbs dominates long-haul heavy-duty transport.
-
BY LEVEL OF AUTOMATIONElectric trucks can be semi-autonomous or fully autonomous. Fleet operators choose semi-autonomous trucks for near-term efficiency and fully autonomous trucks for long-term cost and scalability.
-
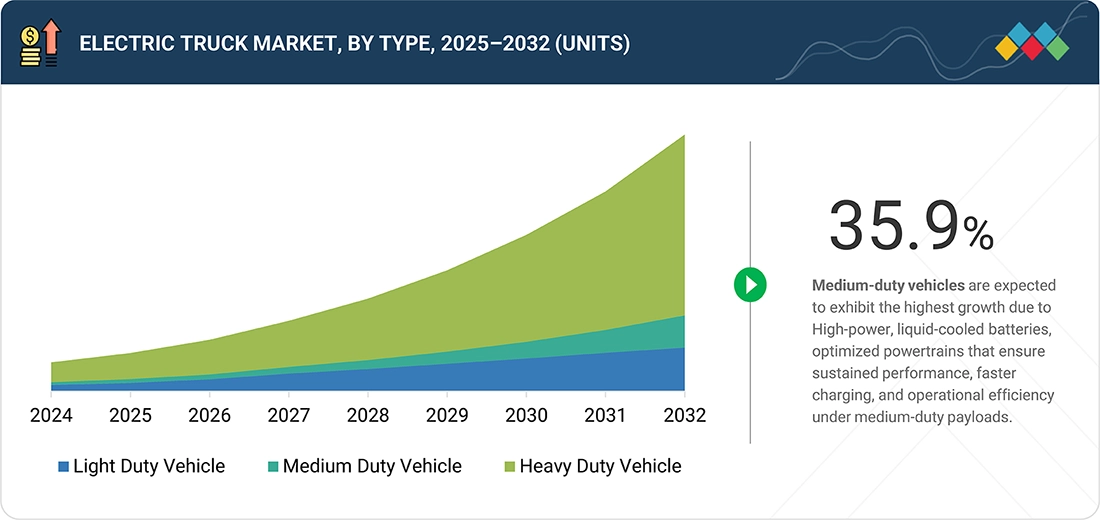
BY TYPEOn the basis of type, the market is segmented into light-duty, medium-duty, and heavy-duty trucks. Among these, it is observed that light-duty trucks are used for urban delivery, medium-duty for regional logistics, and heavy-duty for long-haul high-capacity fleet electrification.
-
BY BATTERY CAPACITYElectric trucks with battery capacities of less than 50 kWh, 50–250 kWh, and above 250 kWh. Trucks with <50 kWh are considered for short urban routes, 50–250 kWh for regional operations, and >250 kWh for long-haul, with high-payload fleet efficiency.
-
BY REGIONThe key regions studied for this market are North America, Asia Pacific, Europe, and the Middle East & Africa. Asia Pacific is estimated to lead fleet electrification with high logistics demand, strong incentives, and robust charging infrastructure, making it the strategic growth hub.
-
COMPETITIVE LANDSCAPEKey players like Dongfeng, AB Volvo, and Ford focus on electrified powertrains, modular batteries, and autonomous/connected solutions to boost range, payload, and fleet efficiency.
The electric truck industry is entering a decisive growth phase as zero-emission regulations, fleet decarbonization goals, and ESG-driven procurement accelerate adoption. Unlike passenger EVs, electric trucks demand breakthroughs in battery energy density, payload efficiency, and megawatt charging to enable heavy-duty and long-haul applications. Advances in modular architectures, ADAS integration, and connected fleet management are reshaping operational benchmarks. Total cost of ownership advantages, driven by lower fuel and maintenance costs, are strengthening the business case for early movers.
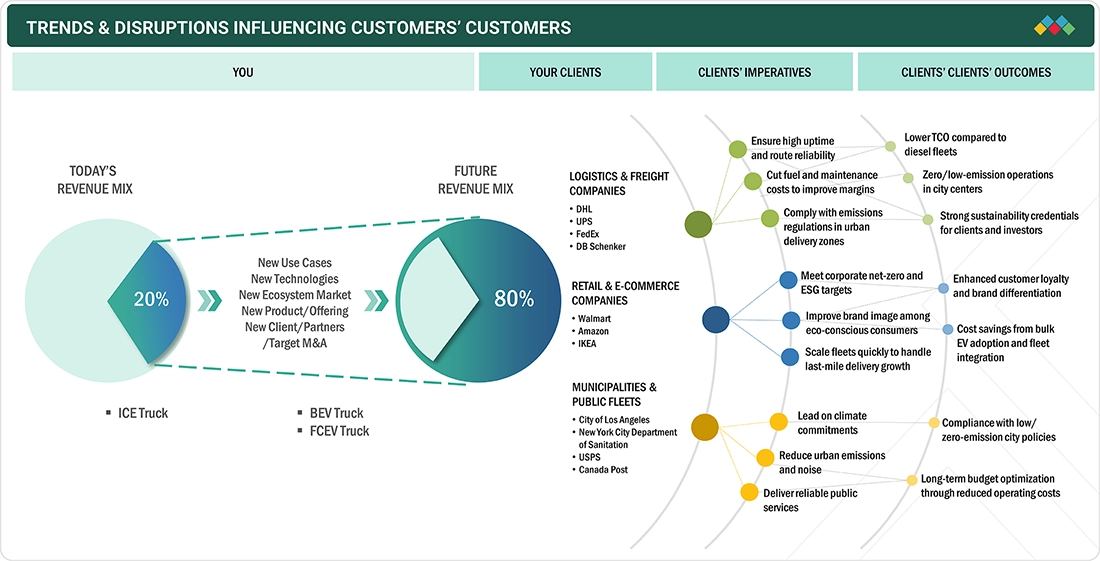
TRENDS & DISRUPTIONS IMPACTING CUSTOMERS' CUSTOMERS
The electric truck market trends is driven by rising regulatory pressure for zero-emission freight, growing demand for cost-efficient and sustainable logistics, and ongoing advancements in battery and charging technologies. Fleet operators are adopting electric trucks to reduce operating costs and meet ESG targets. Government incentives and infrastructure development further accelerate market growth.
Source: Secondary Research, Interviews with Experts, MarketsandMarkets Analysis
MARKET DYNAMICS
Level
-
Declining battery costs

-
Increasing range for electric trucks

Level
-
High initial investment for production

-
Lack of EV charging infrastructure

Level
-
Ongoing development of self-driving truck technology

-
Rapid advancements in fuel cell technology

Level
-
Inadequate standardization of EV charging infrastructure

-
Limited availability of lithium for EV batteries

Source: Secondary Research, Interviews with Experts, MarketsandMarkets Analysis
Driver: Elevated demand for electric trucks in logistics and other commercial sectors
Rising demand for electric trucks in logistics and commercial sectors is fueled by emission mandates, TCO benefits, and ESG commitments. Companies like FedEx, Amazon, and Walmart are adopting them to cut carbon and fuel costs. Their efficiency in urban delivery and high-frequency operations makes them a critical enabler of freight decarbonization.
Restraint: High initial investment for production
High upfront production costs, driven by large-capacity batteries, specialized drivetrains, and retooled manufacturing lines, remain a key barrier. Volatile raw material prices for lithium, cobalt, and nickel further escalate financial pressure on OEMs and suppliers. Without sustained incentives or scale efficiencies, these capital requirements slow adoption despite strong long-term TCO benefits.
Opportunity: Rapid advancements in fuel cell technology
Rapid progress in fuel cell technology offers electric trucks an extended range, faster refueling, and minimal payload compromise, making them viable for long-haul and heavy-duty use. Advancements in energy density, thermal management, and modularity are enabling flexible powertrain designs across duty cycles. As emission regulations tighten, fuel cell trucks emerge as a future-proof zero-emission solution for freight decarbonization.
Challenge: Inadequate standardization of EV charging infrastructure
The lack of standardized EV charging infrastructure limits interoperability and slows the adoption of electric trucks across regions. Variations in voltage, connector types, and fast-charging protocols (CCS, CHAdeMO, GB/T) create operational and planning complexities for fleets. Establishing universal standards is critical to enabling seamless deployment, accelerating technology adoption, and supporting scalable battery and vehicle innovation.
Electric Truck Market: COMMERCIAL USE CASES ACROSS INDUSTRIES
| COMPANY | USE CASE DESCRIPTION | BENEFITS |
|---|---|---|
 |
Manufacturing and deploying electric trucks for urban and regional logistics across China and other Asia Pacific markets | Enables scalable electrified fleets, strengthens market leadership, reduces fleet emissions, and supports regulatory compliance |
 |
Electrifying commercial truck fleets with Hitachi powertrain, BMS, ADAS, and telematics | Achieves lower TCO, regulatory compliance, enhanced fleet reliability, energy efficiency, and operational resilience |
 |
Deploying electric trucks in urban delivery networks to reduce emissions and optimize operational costs | Lower fuel and maintenance costs, improved ESG performance, and enhanced brand reputation |
 |
Providing high-capacity batteries and fast-charging solutions for heavy-duty electric trucks | Maximizes vehicle uptime, accelerates fleet electrification, and enables long-haul operations with reliable energy solutions |
Logos and trademarks shown above are the property of their respective owners. Their use here is for informational and illustrative purposes only.
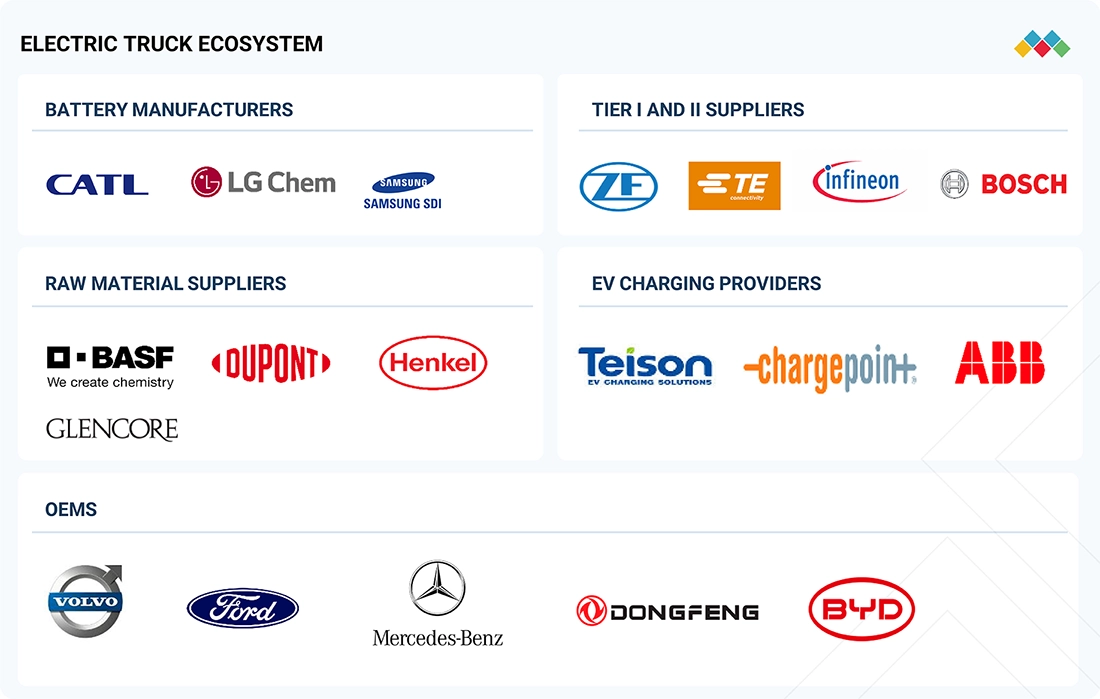
MARKET ECOSYSTEM
The ecosystem analysis highlights various players in the electric truck market ecosystem, which is primarily represented by OEMs, Tier 1 integrators/suppliers, and EV charging providers. Some major electric truck OEMs are AB Volvo, Dongfeng Motor Corporation, and Ford Motor Company. The adoption of electric trucks depends on robust charging infrastructure, with ChargePoint, ABB, and Siemens as key providers.
Logos and trademarks shown above are the property of their respective owners. Their use here is for informational and illustrative purposes only.
MARKET SEGMENTS
Source: Secondary Research, Interviews with Experts, MarketsandMarkets Analysis
Electric Truck Market, by Level of Automation
Autonomous electric trucks are expanding rapidly in last-mile delivery and yard operations. Leveraging Level 4 automation, they reduce labor costs, increase asset utilization, and optimize route efficiency. This enables near-continuous operation and higher operational throughput without downtime.
Electric Truck Market, by Type
Medium-duty electric trucks are gaining traction for urban and regional logistics. High-power, liquid-cooled batteries combined with efficient powertrains ensure consistent performance under medium payloads. Faster charging cycles and operational reliability make them ideal for high-frequency delivery routes.
Electric Truck Market, by Payload Capacity
Electric trucks in the 10,001–26,000 lbs payload range deploy liquid-cooled, high-power battery systems. These systems maintain sustained acceleration and top speed even at full freight and cargo loads, making them highly effective for city transit routes with frequent stops.
Electric Truck Market, by Battery Capacity
Electric trucks equipped with <50 kWh battery capacity are growing fastest in dense city operations. Lightweight designs and smaller battery packs enable quick acceleration and frequent charging. Optimized routes and reduced operational costs maximize fleet efficiency and utilization.
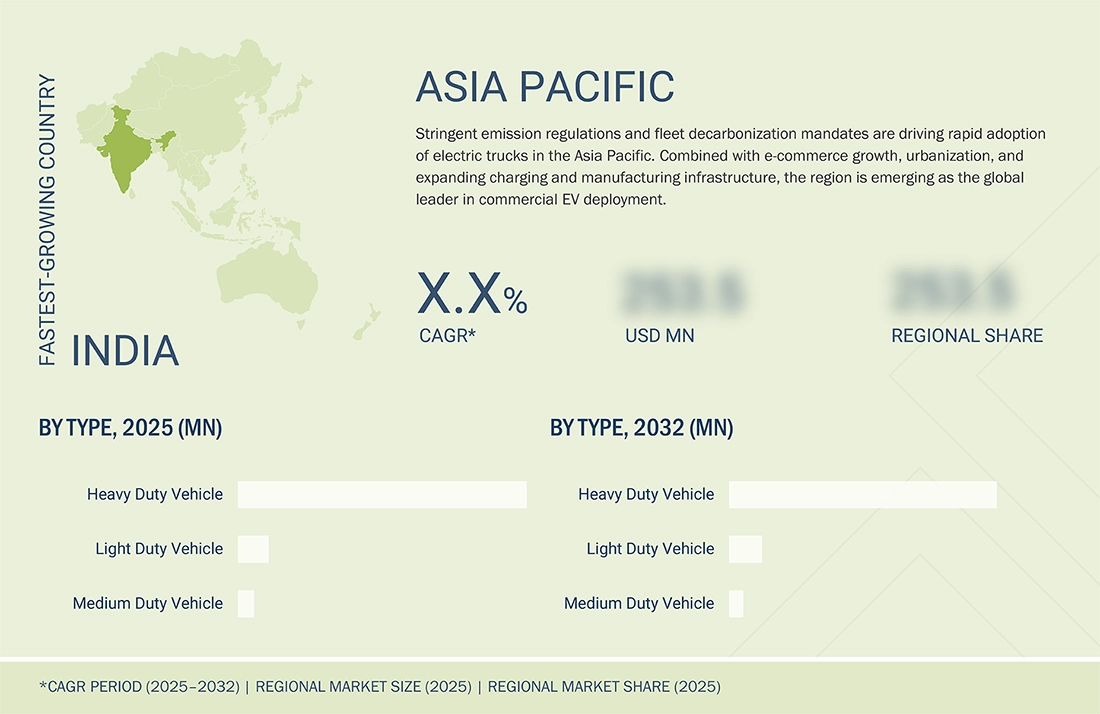
REGION
Asia Pacific to be largest region in global electric truck market during forecast period
Asia Pacific is well-positioned to lead the electric truck market through 2032, driven by strong government mandates, rapid urbanization, and rising logistics demand. China, Japan, South Korea, and India are advancing adoption through targeted subsidies, stringent low-emission regulations, and expanding EV infrastructure. China’s ambitious zero-emission targets and large-scale commercial EV production, exemplified by BYD’s all-electric SHARK pickup, underscore its leadership. Southeast Asia and India are scaling electrification to meet growing urban and industrial transport needs. The region benefits from cost-efficient supply chains, significant battery production capacity, and enabling regulatory frameworks. Policy instruments, including EV quotas and low-emission zones, are accelerating market penetration in major cities.
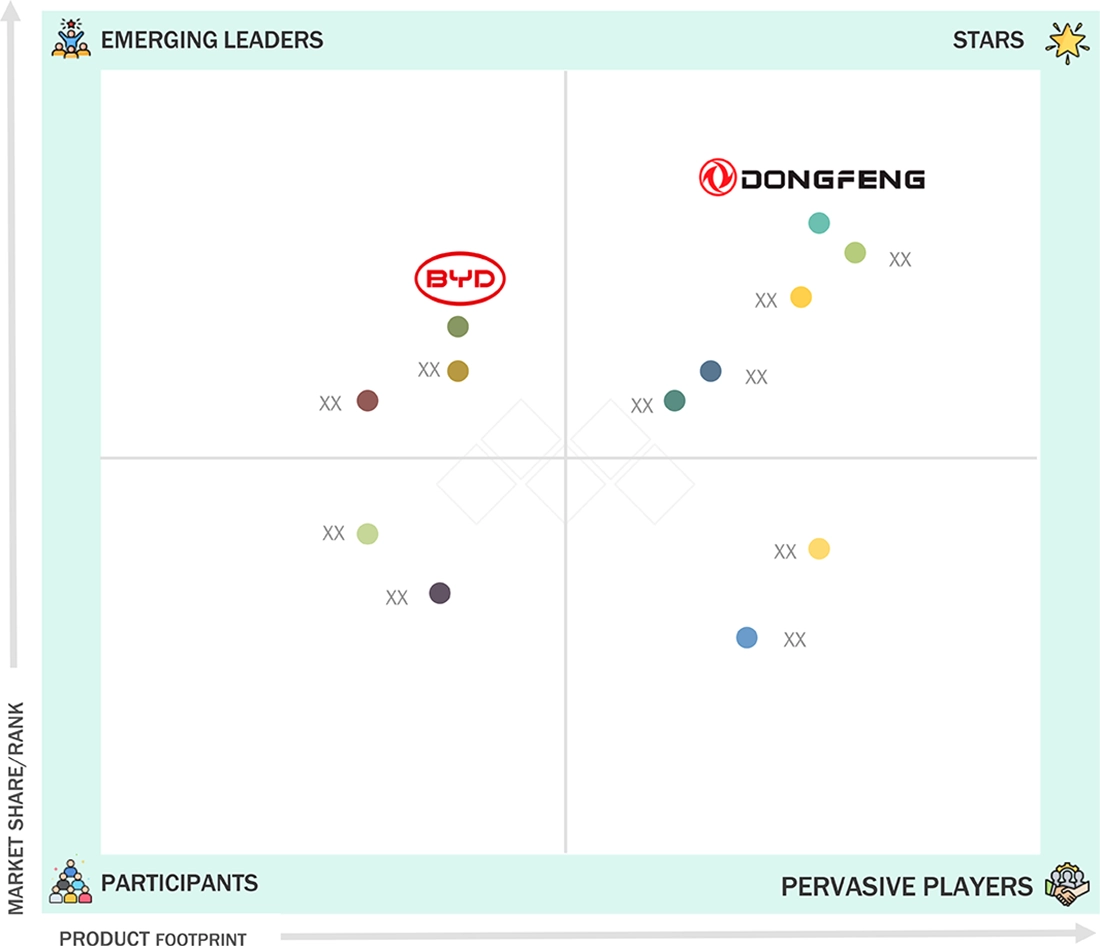
Electric Truck Market: COMPANY EVALUATION MATRIX
In the electric truck market share matrix, Dongfeng Motor Corporation (Star) leads with a strong commercial fleet presence and proven vehicle reliability, driving large-scale adoption across urban and regional logistics. BYD (Emerging Leader) is gaining momentum through advanced battery technology, scalable electric truck production, and strategic fleet partnerships, showing strong potential to move toward the star quadrant.
Source: Secondary Research, Interviews with Experts, MarketsandMarkets Analysis
KEY MARKET PLAYERS
- BYD (China)
- AB Volvo (Sweden)
- Ford Motor Company(US)
- Rivian (US)
- Dongfeng Motor Company (China)
- Paccar Inc. (US)
- Foton International (China)
- Mercedes-Benz Group (Germany)
- Workhorse Group (US)
- Bollinger Motors (US)
- MAN SE (Germany)
- Ashok Leyland (India)
- VDL Groep (Netherlands)
- Tesla Inc. (US)
- Scania AB (Sweden)
MARKET SCOPE
| REPORT METRIC | DETAILS |
|---|---|
| Market Size, 2025 (Value) | 5.25 Billion |
| Market Forecast, 2032 (Value) | 32.13 Billion |
| Growth Rate | CAGR of 29.5% from 2025 to 2032 |
| Years Considered | 2021–2032 |
| Base year | 2024 |
| Forecast Period | 2025–2032 |
| Units Considered | Value (USD Billion/Billion), Volume (Units) |
| Report Coverage | Revenue Forecast, Company Ranking, Competitive Landscape, Growth Factors, Trends |
| Segments Covered |
|
| Regional Scope | Asia Pacific, Europe, North America, Middle East & Africa |
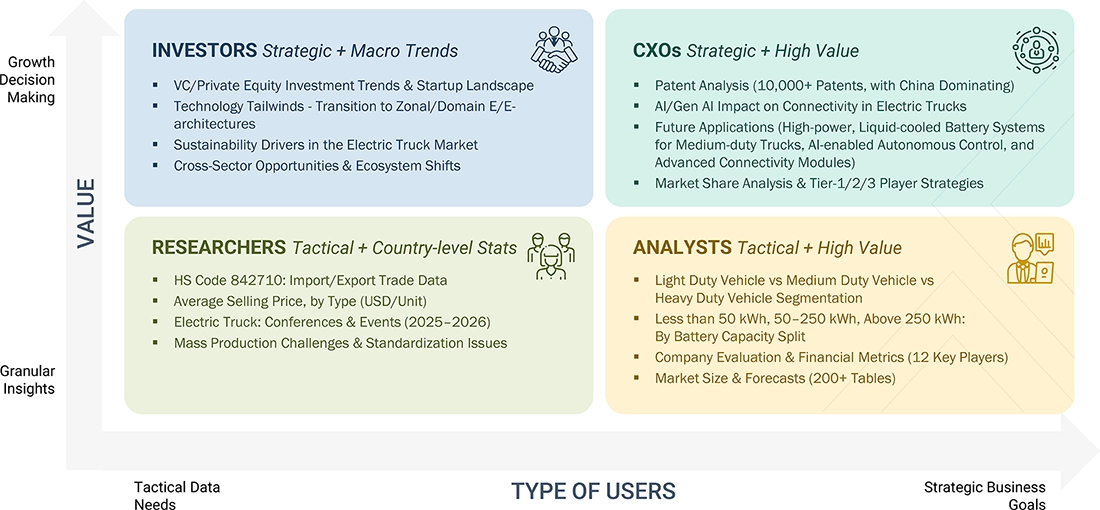
WHAT IS IN IT FOR YOU: Electric Truck Market REPORT CONTENT GUIDE
DELIVERED CUSTOMIZATIONS
We have successfully delivered the following deep-dive customizations:
| CLIENT REQUEST | CUSTOMIZATION DELIVERED | VALUE ADDS |
|---|---|---|
| US-based EV Truck OEMs & Tier-1 Suppliers | Detailed competitor benchmarking for electric truck systems, including charging interface standards, IP rating, material choices, thermal management, and production capacity | Identification of differentiation opportunities in high-voltage, liquid-cooled, and smart in-vehicle systems for trucks |
| Battery & Powertrain Suppliers | Technical evaluation of component compatibility with emerging electric truck architectures (48–800V systems, liquid-cooled vs. air-cooled, modular battery packs, inverter integration) | Guidance on designs to reduce energy losses, improve thermal management, enhance battery and inverter safety, and optimize truck range and performance |
| Global & Regional electric truck Supply Chain | Mapping of raw material sourcing (copper, aluminum, plastics, PFAS-free alternatives), tier-1 supplier ecosystems, and distributor networks focused on electric trucks | Visibility into cost fluctuations, supply risks, infrastructure availability, and potential strategic partnerships for long-term procurement and reliability in truck production |
RECENT DEVELOPMENTS
- February 2025 : Dongfeng Motor Corporation (China) unveiled new models, including DONGFENG GX, KC PRO, and KC PLUS, at the DONGFENG DAY 2025 event in Jakarta, marking its expansion into the Southeast Asian electric truck market.
- January 2025 : Daimler Truck AG (Germany) secured a supply contract with Amazon (US) for 200 Mercedes-Benz eActros LongHaul electric heavy-duty trucks. The trucks would be deployed in Germany and the UK as part of Amazon’s efforts to decarbonize its transportation network. Deliveries are expected to begin in late 2025.
- January 2025 : Scania AB (Sweden), SKF (Sweden), and LOTS Group (Sweden) launched a collaborative project to create an electric truck transport route between Gothenburg and Helsingborg, Sweden. The route would utilize battery-electric Scania trucks powered by SKF’s charging solutions to demonstrate the viability of long-distance electric transportation. LOTS Group would manage operations and logistics, supporting decarbonization efforts across the supply chain. The project aimed to accelerate the shift to fossil-free transportation and showcase sustainable logistics solutions.
- May 2025 : Scania (Sweden) announced investing around USD 2 billion to establish a new production hub in Rugao, China, marking its third global manufacturing site after Sweden and Brazil. Scheduled to commence operations by October 2025, the facility was expected to produce up to 50,000 vehicles annually, nearly doubling the output of Scania’s Brazilian plant. This strategic expansion aimed to enhance Scania’s presence in the Asian market, reduce delivery times, and integrate with China’s advanced transportation technology ecosystem.
Table of Contents
 Exclusive indicates content/data unique to MarketsandMarkets and not available with any competitors.
Methodology
The study involved four major activities in estimating the current size of the electric truck market. Exhaustive secondary research was done to collect information on the market, the peer market, and the parent market. The next step was to validate these findings, assumptions, and sizing from industry experts across value chains through primary research. The top-down and bottom-up approaches were employed to estimate the complete market size. Thereafter, market breakdown and data triangulation processes were used to estimate the market size of segments and subsegments.
Secondary Research
In the secondary research process, various secondary sources such as company annual reports/presentations, press releases, industry association publications [e.g., publications of electric trucks OEMs, Canadian Automobile Association (CAA), country-level automotive associations and trade organizations, and the US Department of Transportation (DOT)], commercial vehicle magazine articles, directories, technical handbooks, World Economic Outlook, trade websites, and technical articles have been used to identify and collect information useful for an extensive commercial study of the global electric truck market.
Primary Research
Extensive primary research was conducted after acquiring an understanding of the electric truck market scenario through secondary research. Several primary interviews were conducted with market experts from both the demand (electric truck manufacturers, country-level government associations, and trade associations) and supply (OEMs and component manufacturers) sides across Asia Pacific, Europe, and North America. Primary data was collected through questionnaires, emails, and telephonic interviews. In the canvassing of primaries, various departments within organizations, such as sales, operations, and administration, were covered to provide a holistic viewpoint in this report.
After interacting with industry experts, brief sessions with highly experienced independent consultants were conducted to reinforce the findings from the primaries. This, along with the in-house subject-matter experts’ opinions, has led to the findings described in the remainder of this report.

Note: Tiers of companies are based on the value chain of the electric truck market; revenues of companies have not been considered. Tier
1 companies are component manufacturers, and Tier 2 companies are material suppliers and system integrators.
Other designations include sales, marketing, and product managers.
To know about the assumptions considered for the study, download the pdf brochure
Market Size Estimation
A detailed market estimation approach was followed to estimate and validate the volume of the electric truck market and other dependent submarkets, as mentioned below:
- Key players in the electric truck market were identified through secondary research, and their global market shares were determined through primary and secondary research.
- The research methodology included the study of the annual and quarterly financial reports & regulatory filings of major market players, as well as interviews with industry experts for detailed market insights.
- All major penetration rates, percentage shares, splits, and breakdowns for the electric trucks market were determined using secondary sources and model mapping and verified through primary sources.
- All key macro indicators affecting the revenue growth of the market segments and subsegments were accounted for, viewed in extensive detail, verified through primary research, and analyzed to get the validated and verified quantitative & qualitative data.
- The market data gathered was consolidated and added with detailed inputs, analyzed, and presented in this report.
Electric Truck Market : Top-Down and Bottom-Up Approach

Data Triangulation
After arriving at the overall market size using the market estimation processes explained above, the market was split into several segments and sub-segments. To complete the overall market engineering process and arrive at the exact statistics of each market segment and sub-segment, data triangulation and market breakdown procedures were employed, wherever applicable. The data was triangulated by studying various factors and trends from both the demand and supply sides.
Market Definition
Electric trucks are designed to carry a weight of more than 3.5 tons. However, they have a few limitations, such as short-range and lower power output than conventional trucks. Electric trucks are further segmented into light-duty, medium-duty, and heavy-duty trucks.
Stakeholders
- Associations, Forums, and Alliances related to Electric Trucks
- Automobile Manufacturers
- Automotive Component Manufacturers
- Automotive Investors
- Automotive Software Manufacturers and Providers
- Companies Operating in Autonomous Vehicle Ecosystem
- Electric Pick-up Truck Manufacturers
- Electric Medium and Heavy-duty Truck Manufacturers
- EV Battery Manufacturers
- Charging Equipment Manufacturers
- Charging Infrastructure Service Providers
- EV Component Manufacturers
- EV Distributors and Retailers
- Government Agencies and Policy Makers
- Original Equipment Manufacturers
- Raw Material Suppliers for Automotive Software or Components
- Transport Authorities
- Technology Providers
- Vehicle Electronics Manufacturers
Report Objectives
-
To segment and forecast the size of the electric truck market in terms of volume
- By propulsion (BEV, PHEV, and FCEV)
- By type (light-duty trucks, medium-duty trucks, and heavy-duty trucks)
- By range (up to 200 miles and above 200 miles)
- By battery type [Lithium-Iron-Phosphate (LFP), Lithium-Nickel-Manganese-Cobalt Oxide (NMC), and others]
- By battery capacity (<50 kWh, 50−250 kWh, and above 250 kWh)
- By level of automation (semi-autonomous and autonomous)
- By payload capacity (up to 10,000 lbs, 10,001–26,000 lbs, and above 26,000 lbs)
- By end user (last-mile delivery, field services, distribution services, long-haul transportation, and refuse services)
- To segment and forecast the size of the regional electric truck market in terms of value
- To forecast the sizes of market segments with respect to key regions, namely North America, Europe, Asia Pacific, and the Middle East & Africa
- To provide detailed information regarding the major factors influencing market growth (drivers, challenges, restraints, and opportunities)
- To analyze regional markets for growth trends, prospects, and their contribution to the overall market
- To analyze opportunities for stakeholders and provide details of the competitive landscape for market leaders
-
To study the following with respect to the market:
- Impact of AI/Gen AI
- US 2025 Tariff
- Trend and Disruption Impact
- Value Chain Analysis
- Ecosystem Analysis
- Technology Analysis
- Case Study Analysis
- Patent Analysis
- Trade Analysis
- Regulatory Landscape
- Bill of Materials
- Investment And Funding Scenario
- Total Cost of Ownership
- Key Stakeholders and Buying Criteria
- Key Conferences and Events
- Average Selling Price Analysis
- To strategically profile key players and comprehensively analyze their market share and core competencies
- To track and analyze competitive developments such as deals (joint ventures, mergers & acquisitions, partnerships, collaborations), product launches/developments, and other activities carried out by key industry participants
Available Customizations
With the given market data, MarketsandMarkets offers customizations in line with company-specific needs.
Electric truck market, by range, at country level (For countries covered in the report)
Company Information
- Profiling of up to five additional players
Key Questions Addressed by the Report
What is the current market size of the Electric Truck Market, and how is it expected to grow?
The Electric Truck Market is projected to grow from USD 5.25 billion in 2025 to USD 32.13 billion by 2032, at a CAGR of 29.5% during the forecast period.
What are the key factors driving the growth of the Electric Truck Market?
The market is driven by stringent emission regulations, increasing fleet electrification, government incentives, expanding charging infrastructure, and growing demand for zero-emission freight transportation.
Which region is expected to dominate the Electric Truck Market during the forecast period?
Asia Pacific is expected to dominate the Electric Truck Market due to strong government support, rapid commercial EV adoption, expanding logistics operations, and robust battery manufacturing capabilities.
What are the latest trends shaping the Electric Truck Market?
Key trends include advancements in battery technology, megawatt charging systems, autonomous driving capabilities, software-defined truck platforms, and increasing adoption of medium- and heavy-duty electric trucks.
Who are the leading companies in the Electric Truck Market, and what strategies are they adopting?
Leading companies are focusing on expanding electric truck portfolios, developing high-performance battery technologies, forming strategic partnerships, and investing in charging infrastructure to strengthen their market position.
Need a Tailored Report?
Customize this report to your needs
Get 10% FREE Customization
Customize This ReportPersonalize This Research
- Triangulate with your Own Data
- Get Data as per your Format and Definition
- Gain a Deeper Dive on a Specific Application, Geography, Customer or Competitor
- Any level of Personalization
Let Us Help You
- What are the Known and Unknown Adjacencies Impacting the Electric Truck Market
- What will your New Revenue Sources be?
- Who will be your Top Customer; what will make them switch?
- Defend your Market Share or Win Competitors
- Get a Scorecard for Target Partners

Custom Market Research Services
We Will Customise The Research For You, In Case The Report Listed Above Does Not Meet With Your Requirements
Get 10% Free CustomisationTESTIMONIALS

JIM NAAS
PRODUCT DIRECTOR, WEASLER
Weasler Engineering, a CentroMotion organization
Global Provider of Industrial Actuation & Control Solutionswww.weasler.com
Our organization was interested in learning more about the attractiveness of a particular market space. We contacted MarketsandMarkets to help us based on previous positive experiences we had with them. The results did not disappoint! We discussed our objectives with them, and the team at MarketsandMarkets developed and executed a proposal that met our needs precisely. We were very impressed by their level of expertise, the quality of the analysis and their insightful recommendations. We would not hesitate in working with them again in the future.

Matt Kardel,
Vice President
Aptiv,
A global technology company that develops safer, greener and more connected solutions.www.aptiv.com
We contracted with
MarketsandMarkets to evaluate the value chain and potential go-to-market partners related to our
interest in the Fleet Management space. The team successfully completed the work on time and at the
pricing agreed. MarketsandMarkets listened and understood our objectives and collaborated well with
us to help us get the visibility we needed to make an investment.
We have subsequently used
MarketsandMarkets again related to Smart Cities to good results.
Growth opportunities and latent adjacency in Electric Truck Market


John
May, 2022
We are interested in Electric Trucks Market based on the level of automation (semi-autonomous electric trucks market and autonomous electric trucks market).