Emergency Spill Response Market by Type (Product (Booms, Skimmers, Transfer Products, Sorbents), Services (Product Rental, Waste Management, Manpower Training), Spill Material (Oil, Chemical & Hazardous), Vertical - Global Forecast to 2036


 Exclusive indicates content/data unique to MarketsandMarkets and not available with any competitors.
Table of Contents
1 Introduction (Page No. - 14)
1.1 Objectives of the Study
1.2 Market Definition
1.3 Study Scope
1.3.1 Markets Covered
1.3.2 Years Considered for the Study
1.4 Currency
1.5 Limitations
1.6 Market Stakeholders
2 Research Methodology (Page No. - 17)
2.1 Research Data
2.2 Value Chain Analysis – Emergency Spill Response
2.2.1 Secondary and Primary Research
2.2.1.1 Key Industry Insights
2.2.2 Secondary Data
2.2.2.1 Key Data From Secondary Sources
2.2.3 Primary Data
2.2.3.1 Breakdown of Primaries
2.2.3.2 Key Data From Primary Sources
2.3 Market Size Estimation
2.3.1 Bottom-Up Approach
2.3.1.1 Approach for Capturing the Market Share Using Bottom-Up Analysis (Demand Side)
2.3.2 Top-Down Approach
2.3.2.1 Approach for Capturing the Market Share Using Top-Down Analysis (Supply Side)
2.4 Market Breakdown & Data Triangulation
2.5 Research Assumptions
3 Executive Summary (Page No. - 28)
4 Premium Insights (Page No. - 31)
4.1 Attractive Market Opportunities in the Global Emergency Spill Response Market
4.2 Market, By Vertical
4.3 Market, By Type
4.4 Market, By Spill Material
4.5 Market, By Spill Environment
4.6 Life Cycle Analysis, By Region
5 Market Overview (Page No. - 35)
5.1 Introduction
5.2 Market Segmentation
5.2.1 By Type
5.2.2 By Vertical
5.2.3 By Spill Material
5.2.4 By Spill Environment
5.2.5 By Region
5.3 Market Dynamics
5.3.1 Drivers
5.3.1.1 Increasing Awareness Regarding the Effects of Spill on the Environment
5.3.1.2 Increased International Trade and Transportation
5.3.2 Restraints
5.3.2.1 Reduced Incidents of Large Spills on Sea
5.3.3 Opportunities
5.3.3.1 Government Initiatives to Strengthen Response to Oil Spills on Sea
5.3.4 Challenges
5.3.4.1 Environmental Challenges for Spill Response in the Arctic Region
6 Industry Trends (Page No. - 45)
6.1 Introduction
6.2 Value Chain Analysis
6.3 Porter’s Five Forces Analysis
6.3.1 Threat of New Entrants
6.3.2 Threat of Substitutes
6.3.3 Bargaining Power of Suppliers
6.3.4 Bargaining Power of Buyers
6.3.5 Intensity of Competitive Rivalry
7 Market, By Type (Page No. - 54)
7.1 Introduction
7.2 Products
7.2.1 Booms
7.2.1.1 Oil Booms
7.2.1.1.1 Offshore Protection Booms
7.2.1.1.1.1 Internal Foam Floatation Booms
7.2.1.1.1.2 Self-Inflating Booms
7.2.1.1.1.3 Pressure Inflatable Booms
7.2.1.1.1.4 Fence Booms
7.2.1.1.2 Shore Protection Booms
7.2.1.1.2.1 Exclusion Booms
7.2.1.1.2.2 Diversion Booms
7.2.1.1.2.3 River Booms
7.2.1.1.2.4 Shore Sealing Booms
7.2.1.1.2.5 Beach Berms
7.2.1.2 Chemical Booms
7.2.1.3 Universal Booms
7.2.2 Skimmers
7.2.3 Dispersants & Dispersant Products
7.2.4 In-Situ Burning Products
7.2.4.1 Fire Resistant Booms
7.2.4.2 Igniters
7.2.4.3 Chemical Herders
7.2.5 Sorbents
7.2.6 Transfer Products
7.2.6.1 Pumps
7.2.7 Radio Communication Products
7.2.7.1 Remote Sensing Products
7.2.7.1.1 Radars
7.2.7.1.2 Satellite Remote Sensing
7.2.7.1.3 Laser Flouro Sensors
7.2.7.1.4 Ultraviolet Sensors
7.2.7.1.5 Infrared Sensors
7.3 Services
7.3.1 Product Rental Services
7.3.2 Waste Management Services
7.3.3 Manpower Training Services
7.3.4 Transportation and Disposal Services
7.3.5 Spill Response Drill & Exercise Services
7.3.6 Tracking & Surveillance Services
7.3.7 Risk Assessments & Analysis
7.3.8 Other Services
8 Market, By Spill Material (Page No. - 70)
8.1 Introduction
8.2 Oil Spills
8.3 Chemical & Hazardous Material Spills
9 Market, By Spill Environment (Page No. - 76)
9.1 Introduction
9.2 Spills on Land
9.3 Spills on Sea
10 Market, By Vertical (Page No. - 93)
10.1 Introduction
10.2 Transportation
10.3 Chemical
10.4 Oil & Gas
10.5 Ports & Harbors
10.6 Government
10.7 Industrial Facilities
11 Regional Analysis (Page No. - 101)
11.1 Introduction
11.2 North America
11.2.1 U.S.
11.2.2 Canada
11.2.3 Mexico
11.3 Europe
11.3.1 U.K.
11.3.2 Norway
11.3.3 Germany
11.3.4 France
11.3.5 Ireland
11.4 APAC
11.4.1 India
11.4.2 China
11.4.3 Malaysia
11.4.4 Indonesia
11.4.5 Australia
11.5 Rest of the World (RoW)
11.5.1 Middle East & Africa
11.5.2 South America
12 Competitive Landscape (Page No. - 122)
12.1 Overview
12.2 Market Ranking Analysis, 2015
12.3 Competitive Situation and Trends
12.3.1 Mergers & Acquisitions
12.3.2 New Product Launches
12.3.3 Partnerships, Joint Ventures, and Collaborations
13 Company Profiles (Page No. - 127)
13.1 Introduction
(Business Overview, Products & Services, Key Insights, Recent Developments, SWOT Analysis, Ratio Analysis, MnM View)*
13.2 Oil Spill Response Limited
13.3 Marine Well Containment Company
13.4 Polyeco Group
13.5 Vikoma International Ltd
13.6 Desmi A/S
13.7 Veolia Environnement S.A.
13.8 Clean Harbors, Inc.
13.9 US Ecology, Inc.
13.10 Adler and Allan Limited
13.11 Markleen A/S.
13.12 Elastec Inc.
*Details on Business Overview, Products & Services, Key Insights, Recent Developments, SWOT Analysis, MnM View Might Not Be Captured in Case of Unlisted Companies.
14 Appendix (Page No. - 152)
14.1 Insights of Industry Experts
14.2 Discussion Guide
14.3 Knowledge Store: Marketsandmarkets’ Subscription Portal
14.4 Introducing RT: Real-Time Market Intelligence
14.5 Available Customizations
14.6 Related Reports
14.7 Author Details
List of Tables (75 Tables)
Table 1 List of Major Secondary Sources
Table 2 Intensity of Competitive Rivalry and Bargaining Power of Buyers Had A High Impact on the Market
Table 3 Emergency Spill Response Market, By Type, 2014-2022 (USD Billion)
Table 4 Market, By Product Type, 2014-2022 (USD Million)
Table 5 Booms Segment, By Type, 2014-2022 (USD Million)
Table 6 Oil Booms Subsegment, By Type, 2014-2022 (USD Million)
Table 7 Offshore Protection Oil Booms Subsegment, By Type, 2014-2022 (USD Million)
Table 8 Shore Protection Oil Booms Subsegment, By Type, 2014-2022 (USD Million)
Table 9 Skimmers Segment, By Type, 2014-2022 (USD Million)
Table 10 Dispersants& Dispersant Products Segment, By Type, 2014-2022 (USD Million)
Table 11 In-Situ Burning Products Segment, By Type, 2014-2022 (USD Million)
Table 12 Transfer Products Segment, By Type, 2014-2022 (USD Million)
Table 13 Pumps Sub Segment, By Type, 2014-2022 (USD Million)
Table 14 Remote Sensing Products Subsegment, By Type, 2014-2022 (USD Million)
Table 15 Market, By Service Type, 2014-2022 (USD Million)
Table 16 Market, By Spill Material, 2014-2022 (USD Billion)
Table 17 Market for Oil Spills, By Type, 2014-2022 (USD Billion)
Table 18 Market for Oil Spills, By Product Type, 2014-2022 (USD Million)
Table 19 Market for Oil Spills, By Service Type, 2014-2022 (USD Million)
Table 20 Market for Chemical & Hazardous Materials, By Type, 2014-2022 (USD Billion)
Table 21 Market for Chemical & Hazardous Materials, By Product Type, 2014-2022 (USD Million)
Table 22 Market for Chemical & Hazardous Materials, By Service Type, 2014-2022 (USD Million)
Table 23 Market, By Spill Environment, 2014-2022 (USD Billion)
Table 24 Market for Spills on Land, By Type, 2014-2022 (USD Billion)
Table 25 Market for Spills on Land, By Product Type, 2014-2022 (USD Million)
Table 26 Market for Spills on Land, By Service Type, 2014-2022 (USD Million)
Table 27 North America Emergency Spill Response Product Market for Spills on Land, By Product Type, 2014-2022 (USD Million)
Table 28 North America Market for Spills on Land, By Service Type, 2014-2022 (USD Million)
Table 29 Europe Market for Spills on Land, By Product Type, 2014-2022 (USD Million)
Table 30 Europe Market for Spills on Land, By Service Type, 2014-2022 (USD Million)
Table 31 Asia-Pacific Market for Spills on Land, By Product Type, 2014-2022 (USD Million)
Table 32 Asia-Pacific Market for Spills on Land, By Service Type, 2014-2022 (USD Million)
Table 33 RoW Market for Spills on Land, By Product Type, 2014-2022 (USD Million)
Table 34 RoW Market for Spills on Land, By Service Type, 2014-2022 (USD Million)
Table 35 Market for Spills on Sea, By Type, 2014-2022 (USD Billion)
Table 36 Market for Spills on Sea, By Product Type, 2014-2022 (USD Million)
Table 37 Market for Spills on Sea, By Service Type, 2014-2022 (USD Million)
Table 38 North America Emergency Spill Response Product Market for Spills on Sea, By Product Type, 2014-2022 (USD Million)
Table 39 North America Market for Spills on Sea, By Service Type, 2014-2022 (USD Million)
Table 40 Europe Market for Spills on Sea, By Product Type, 2014-2022 (USD Million)
Table 41 Europe Market for Spills on Sea, By Service Type, 2014-2022 (USD Million)
Table 42 Asia-Pacific Market for Spills on Sea, By Product Type, 2014-2022 (USD Million)
Table 43 Asia-Pacific Market for Spills on Sea, By Service Type, 2014-2022 (USD Million)
Table 44 RoW Market for Spills on Sea, By Product Type, 2014-2022 (USD Million)
Table 45 RoW Market for Spills on Sea, By Service Type, 2014-2022 (USD Million)
Table 46 Market, By Vertical, 2014-2022 (USD Million)
Table 47 Market for Transportation Vertical, By Region, 2014-2022 (USD Million)
Table 48 Market for Chemical Vertical, By Region, 2014-2022 (USD Million)
Table 49 Market for Oil & Gas Vertical, By Region, 2014-2022 (USD Million)
Table 50 Market for Ports & Harbors Vertical, By Region, 2014-2022 (USD Million)
Table 51 Market for Government Vertical, By Region, 2014-2022 (USD Million)
Table 52 Market for Industrial Facilities Vertical, By Region, 2014-2022 (USD Million)
Table 53 Market, By Region, 2014–2022 (USD Billion)
Table 54 North America Market, By Country, 2014–2022 (USD Million)
Table 55 Market in North America, 2014–2022 (USD Million)
Table 56 North America Market, By Product Type, 2014–2022 (USD Million)
Table 57 North America Market, By Service Type, 2014–2022 (USD Million)
Table 58 Europe Market, By Country, 2014–2022 (USD Million)
Table 59 Europe Market, 2014–2022 (USD Million)
Table 60 Europe Market, By Product Type, 2014–2022 (USD Million)
Table 61 Europe Market, By Service Type, 2014–2022 (USD Million)
Table 62 APAC Market, By Country, 2014–2022 (USD Million)
Table 63 APAC Market, 2014–2022 (USD Million)
Table 64 APAC Market, By Product Type, 2014–2022 (USD Million)
Table 65 APAC Market, By Service Type, 2014–2022 (USD Million)
Table 66 RoW Market, By Region, 2014–2022 (USD Million)
Table 67 RoW Market, 2014–2022 (USD Million)
Table 68 RoW Market, By Product Type, 2014–2022 (USD Million)
Table 69 RoW Market, By Service Type, 2014–2022 (USD Million)
Table 70 Market: Company Ranking, 2015
Table 71 Emergency Spill Response Products Market: Company Ranking, 2015
Table 72 Emergency Spill Response Services Market: Company Ranking, 2015
Table 73 Most Significant Mergers & Acquisitions in Market
Table 74 Most Significant New Product Launches in the Market
Table 75 Recent Partnerships, Joint Ventures and Collaborations in the Market
List of Figures (65 Figures)
Figure 1 Market Segmentation
Figure 2 Emergency Spill Response Market: Research Design
Figure 3 Value Chain – Emergency Spill Response
Figure 4 Bottom-Up Approach to Arrive at the Market Size
Figure 5 Top-Down Approach to Arrive at the Market Size
Figure 6 Data Triangulation
Figure 7 Assumptions of the Research Study
Figure 8 Market, By Vertical (2016)
Figure 9 Skimmers Expected to Be the Largest Product Type Segment During the Forecast Period
Figure 10 North America Held the Largest Share of the Market in 2015
Figure 11 Increasing Focus of Government Agencies on Protecting the Environment From Spills is Expected to Fuel Growth of the Market During the Forecast Period
Figure 12 Government Segment Expected to Hold the Largest Market Size During the Forecast Period
Figure 13 Government Vertical and North America Region Held the Leading Segments of Market
Figure 14 Manpower Training Services Segment Expected to Grow at the Highest Rate During the Forecast Period
Figure 15 Oil Spills Estimated to Be the Largest Spill Material Segment During the Forecast Period
Figure 16 Spills on Sea Expected to Be the Largest Spill Environment Segment of the Market During the Forecast Period.
Figure 17 North America Accounted for the Largest Share of the Market
Figure 18 Market Segmentation
Figure 19 Market Segmentation: By Type
Figure 20 Market Segmentation: By Vertical
Figure 21 Market Segmentation: By Spill Material
Figure 22 Market Segmentation: By Environment
Figure 23 Market Segmentation, By Region
Figure 24 Drivers, Restraints, Opportunities, and Challenges in the Market
Figure 25 Increasing Global Sea Trade Between 1970 and 2015 (Million of Tons)
Figure 26 The Number of Spills on Sea Between 1970 and 2015 (Thousand Units)
Figure 27 Value Chain Analysis of the Market
Figure 28 Porter’s Five Forces Analysis of the Market
Figure 29 Porter’s Five Forces Analysis: Market, 2015
Figure 30 Market: Threat of New Entrants
Figure 31 Market: Threat of Substitutes
Figure 32 Market: Bargaining Power of Suppliers
Figure 33 Market: Bargaining Power of Buyers
Figure 34 Market: Intensity of Competitive Rivalry
Figure 35 Market, By Type
Figure 36 Market, By Booms
Figure 37 Oil Booms Expected to Have the Largest Market Size ,By Type, in the Forecast Period
Figure 38 Skimmers Expected to Be the Largest Segment of the Market During the Forecast Period
Figure 39 Market, By Spill Material
Figure 40 Skimmers Segment Projected to Lead the Market for Oil Spills From 2016 to 2022
Figure 41 Market, By Spill Environment
Figure 42 The Skimmers Segment is Anticipated to Lead the Market for Spills on LAN, 2016 vs 2022
Figure 43 The Skimmers Segment is Projected to Lead the Market for Spills on Sea, 2016 vs 2022
Figure 44 Market, By Vertical
Figure 45 The Government Vertical Segment is Projected to Lead the Market During the Forecast Period
Figure 46 The North America Market for Government Vertical is Expected to Account for the Largest Market Share in 2016 and 2022
Figure 47 Norway Expected to Grow at the Highest CAGR During the Forecast Period
Figure 48 North America is Projected to Be the Largest Market for By 2022
Figure 49 North America Market Snapshot
Figure 50 Mexico Was the Largest Market for Market During the Forecast Period
Figure 51 Europe Market Snapshot
Figure 52 Norway Expected Tobe the Largest Market By 2022
Figure 53 APAC Market Snapshot
Figure 54 India is Projected to Be the Largest Market for By 2022
Figure 55 Companies Adopted Mergers & Acquisitions as Key Growth Strategies From 2014 to 2016
Figure 56 Market Evaluation Framework
Figure 57 Battle for Market Share: Mergers & Acquisitions is the Key Strategy
Figure 58 Oil Spill Response Ltd.: SWOT Analysis
Figure 59 Marine Well Containment Company: SWOT Analysis
Figure 60 Polyeco Group: SWOT Analysis
Figure 61 Vikoma International Ltd.: SWOT Analysis
Figure 62 Desmi A/S.: SWOT Analysis
Figure 63 Veolia Environnement S.A.: Company Snapshot
Figure 64 Clean Harbors, Inc.: Company Snapshot
Figure 65 US Ecology, Inc.: Company Snapshot
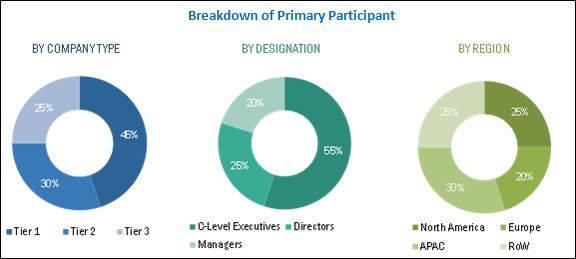
The research methodology used to estimate and forecast the emergency spill response market begins with capturing data on key vendor revenues through secondary research. The secondary sources considered for the research include major players’ annual reports, presentations, press releases, news articles, journals, publications from associations such as U.S. Environmental Protection Agency (EPA), International Tanker Owners Pollution Federation Limited (ITOPF), National Oceanic and Atmospheric Administration (NOAA), Spill Control Association of America (SCAA), International Marine Contractors Association (IMCA), and databases such as Factiva and Hoovers. The vendor offerings have also been taken into consideration to determine the market segmentation. The bottom-up procedure has been employed to arrive at the overall market size of the global market from the revenue of the key players in the market. After arriving at the overall emergency spill response market size, the total market has been split into several segments and subsegments, which have then been verified through primary research by conducting extensive interviews with key people such as CEOs, VPs, directors, and executives. The data triangulation and market breakdown procedures have been employed to complete the overall market engineering process and arrive at the exact statistics for all segments and subsegments. The breakdown of profiles of primary is depicted in the below figure:
To know about the assumptions considered for the study, download the pdf brochure
The ecosystem of the emergency spill response market includes Murrenhil Corporation (Canada), Crucial, Inc.(U.S.), FOILEX Engineering AB (Sweden), Miko Marine AS (Norway), Vikoma International Ltd (U.K.), Fast Engineering Limited (Ireland), Markleen AS (Norway), Universal Remediation, Inc. (U.S.), and Kepner Plastics Fabricators, Inc.(U.S.). The companies involved in providing spill response solutions include Crucial, Inc. (U.S.), DESMI A/S (Denmark), Parker Systems, Inc.(U.S.), AllMaritim AS (Norway), Clean Harbors, Inc. (U.S.), Veolia Environnement S.A. (France), and Polyeco Group (UAE). The companies involved in providing spill response services include Briggs Marine & Environmental Services (U.K.), Fender & Spill Response Services LLC (UAE), QualiTech, Inc. (U.S.), SL Ross Environmental Research Ltd (Canada), Oil Spill Response Limited (U.K.), Gallagher Marine Systems, Inc. (U.S.), Marine Well Containment Company (U.S.), and OSRA International Limited (U.K.).
“This study answers several questions for the stakeholders, primarily which market segments to focus on in the next five years for prioritizing efforts and investments.”
Scope of the Report:
|
Report Metric |
Details |
|
Base year |
2015 |
|
Forecast period |
2016–2022 |
|
Units |
Value (USD) |
|
Segments covered |
Type, End User, Offerings, and Region |
|
Geographic regions covered |
North America, APAC, Europe, and RoW |
|
Companies covered |
Veolia Environnement S.A. (France), Polyeco Group (Greece), Elastec, Inc. (U.S.), Markleen A/S (Norway), Clean Harbors, Inc. (U.S.). US Ecology, Inc. (U.S.), Oil Spill Response Ltd (U.K.), Marine Well Containment Company (U.S.), Vikoma International Ltd (U.K.), DESMI A/S (Denmark), and Adler and Allan Limited (U.K.) |
Target Audience:
- Environmental Protection Agencies
- Emergency Spill Response Containment Manufacturers
- Oil Producing Companies
- Chemical & Hazardous Material Manufacturers
- Logistics and Transportation Companies
- Emergency Spill Response Service Providers
- Product Distributors and Vendors
- Spill Tracking & Surveillance Companies
- Environment Management Organizations
- Environment Regulatory Bodies and Agencies
Scope of the Report:
The emergency spill response market covered in this report has been segmented as follows:
Emergency Spill Response Market, by Type:
-
Products
- Booms
- Skimmers
- Dispersants & Dispersant Products
- In-Situ Burning Products
- Sorbents
- Transfer Products
- Radio Communication Products
- Vacuum Products
-
Services
- Product Rental Services
- Waste Management Services
- Manpower Training Services
- Transportation and Disposal Services
- Spill Response Drill & Exercise Services
- Tracking & Surveillance Services
- Risk Assessments & Analysis
- Other Services (Oiled Wildlife Services; Contingency Plan Development & Implementation Services; and Soil, Water, and Site Remediation Services)
Market, by Spill Material:
- Oil
- Chemical and Hazardous Materials
Market, by Spill Environment:
- Spills on Land
- Spills on Sea
Market, by Vertical:
- Transportation
- Chemical
- Oil & Gas
- Ports & Harbors
- Government
- Industrial Facilities
Market, by Region:
-
North America
- U.S.
- Canada
- Mexico
-
Europe
- Germany
- France
- U.K.
- Norway
- Ireland
-
APAC
- India
- China
- Malaysia
- Indonesia
- Australia
-
Rest of the World
- The Middle East & Africa
- South America
Available Customizations:
- Product matrix which gives a detailed comparison of product portfolio of each company
- Detailed analysis and profiling of additional market players


Growth opportunities and latent adjacency in Emergency Spill Response Market
We are interested in understanding the various services offered in the emergency spill response market. What % does the rental services contribute? Are there any smart products associated with these?
How do you look towards the oil & gas vertical of this market? What are the major impacting factors for this market?
We are looking at global market and specified geographical market for chemical and hazardous material spill cleanup kit market. How is it in the African and the Asia region?
Which materials and environments have you considered in the scope of the report? Has the regional analysis specific to the Middle East provided in the report?