
Environmental Remediation Market Size, Share, Trends and Growth

Environmental Remediation Market Size, Share & Trends by Environmental Medium (Soil, Groundwater), Site Type (Private, Public), Technology (Air Sparging, Soil Washing, Chemical Treatment, Bioremediation, Electrokinetic Remediation, Excavation) - Global Forecast to 2030


Environmental Remediation Market Size, Share & Trends
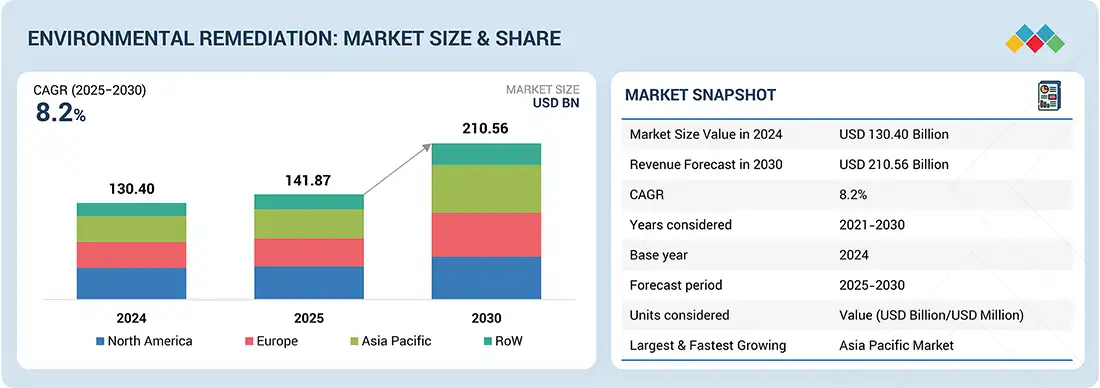
According to Marketsandmarkets, the environmental remediation market size is projected to reach USD 210.56 billion in 2030 from USD 141.87 billion in 2025, growing at a CAGR of 8.2% during the forecast period. Environmental remediation refers to the application of technologies and processes to remove, contain, or neutralize pollutants from soil, water, and other environmental media, restoring them to safe and usable conditions. The growth is propelled by tightening global environmental regulations, increasing industrial and urban contamination, and the urgent push for sustainable land and water management. Furthermore, heightened public awareness and rising government as well as private investments in eco-innovative remediation solutions are accelerating adoption worldwide.
MARKET SNAPSHOT TABLE
| REPORT METRIC | DETAILS |
|---|---|
| Market Size in 2025 (Value) | USD 141.87 Billion |
| Market Forecast in 2030 (Value) | USD 210.56 Billion |
| Growth Rate | CAGR of 8.2% from 2025–2030 |
| Years Considered | 2021–2030 |
| Base Year | 2024 |
| Forecast Period | 2025–2030 |
| Units Considered | Value (USD Billion) |
| Report Coverage | Revenue forecast, company ranking, competitive landscape, growth factors, and trends |
| Top Companies |
|
| Growth Driver |
|
| Segments Covered |
|
| Regional Scope | North America, Europe, Asia Pacific, Rest of the World |
Market Size & Forecast
KEY TAKEAWAYS
- The North America environmental remediation market accounted for a 32.6% revenue share in 2024.
- By environmental medium, the groundwater segment is expected to register the highest CAGR of 9.8%.
- By site type, the private segment is expected to dominate the market.
- By technology, the bioremediation segment is projected to grow at the fastest rate from 2025 to 2030.
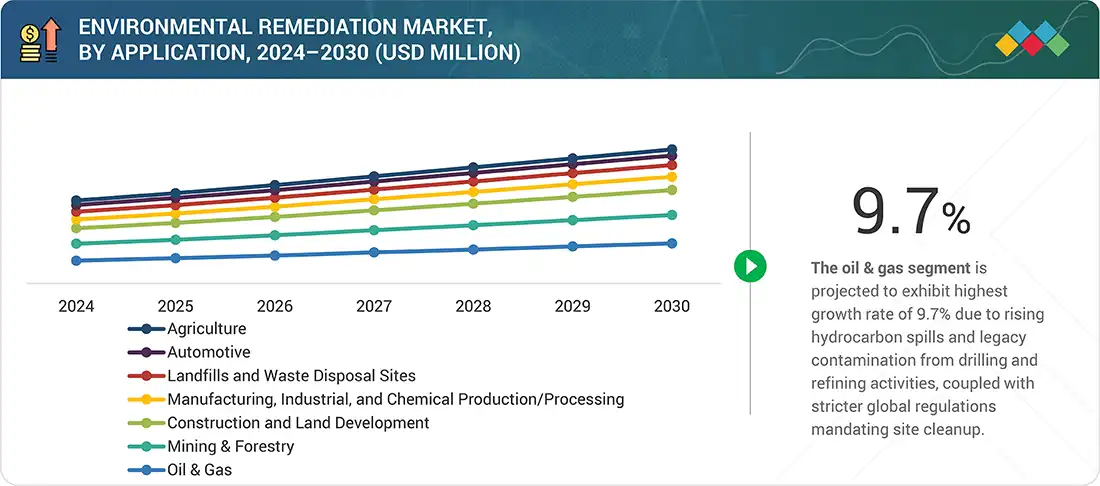
- By application, the oil & gas segment is expected to dominate the market, growing at the highest CAGR of 9.7%.
- CLEAN HARBORS, INC., WSP, AECOM were identified as some of the star players in the environmental remediation market, given their strong market share and product footprint.
- DEME Group NV., Bechtel Corporation, and Fluor Corporation, among others, have distinguished themselves among startups and SMEs by securing strong footholds in specialized niche areas, underscoring their potential as emerging market leaders
The environmental remediation market share is set for strong growth, underpinned by rising industrial pollution, regulatory enforcement, and increasing emphasis on ESG compliance. Advancements in bioremediation, sustainable soil treatment, and smart monitoring are transforming the industry toward greener, cost-efficient solutions. As governments and corporations intensify commitments to net-zero and sustainable land use, environmental remediation is evolving into a critical enabler of industrial responsibility and resilient urban development.
Source: Secondary Research, Interviews with Experts, MarketsandMarkets Analysis
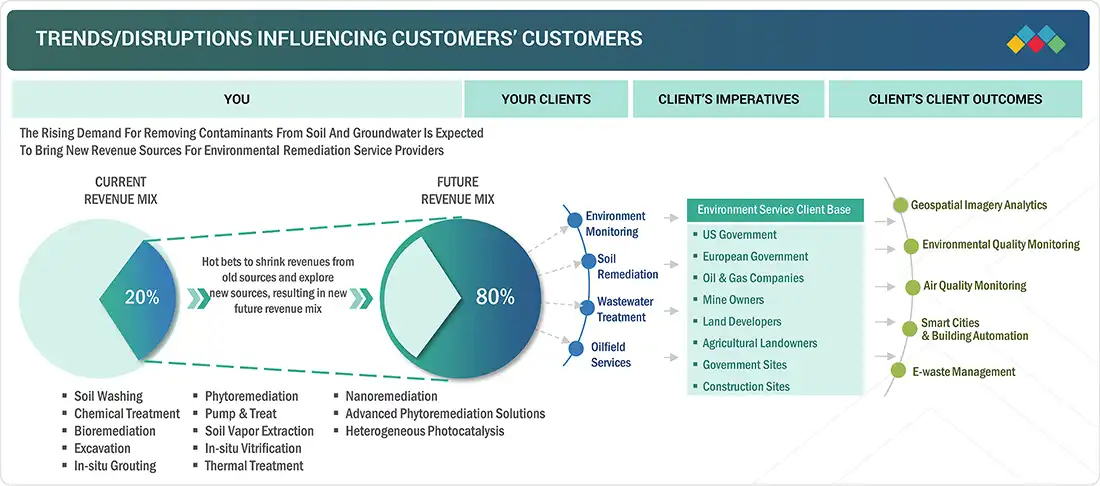
TRENDS & DISRUPTIONS IMPACTING CUSTOMERS' CUSTOMERS
As the population grows, oil and gas consumption rises rapidly, leading to higher emissions of methane, benzene, ethylbenzene, n-hexane, and other volatile organic compounds into the environment. This increase will drive greater demand for remediation technologies in the oil and gas sector. The use of nanomaterials and nanotechnologies enhances the detection and cleanup of environmental contaminants. These nanomaterials also hold strong potential for treatment methods for contaminated water, soil, and sediment. Such advances are anticipated to generate new revenue streams for companies in the environmental remediation industry.
Source: Secondary Research, Interviews with Experts, MarketsandMarkets Analysis
MARKET DYNAMICS
Level
-
Enhanced regulatory frameworks for environmental remediation

-
Growing focus on development of environment-friendly industries

Level
-
Slow implementation of environmental protection regulations

-
High cost of excavation equipment

Level
-
Development of advanced remediation technologies

-
Continuous demand generation from oil & gas industry

Level
-
Inconsistencies in government regulations in many countries

-
Technical and non-technical challenges at complex sites

Source: Secondary Research, Interviews with Experts, MarketsandMarkets Analysis
Driver: Rapid population growth and industrialization in developing countries
The increasing pace of population growth and industrialization in developing economies is a key driver of the environmental remediation market. As urban areas expand and industrial centers grow to meet rising demands for housing, infrastructure, and economic activity, the amount of pollutants entering soil, water, and air has risen significantly. This has prompted both government and private organizations to invest substantial funds in regional efforts to clean urban and industrial environments.
Restraint: High-cost of excavation equipment
The significant capital investment needed for excavation equipment remains a barrier for firms providing environmental remediation services, especially small and mid-sized remediation companies. Excavation is often a vital part of remediation, especially for projects with heavily contaminated soil, buried hazardous materials, or complex subsurface conditions. However, the cost of specialized machinery such as excavators, bulldozers, loaders, and vacuum trucks is often a barrier.
Opportunity: Development of advanced remediation technologies
Advances in remediation technologies create significant opportunities for the growth of the environmental remediation market. New methods, such as nanoremediation, in-situ chemical oxidation and reduction, genetically modified microbe-based bioremediation, and electrokinetic remediation, are expanding and increasing the range of site cleanups. These innovative solutions are effective at significant sites and hard-to-reach contaminated areas, such as groundwater aquifers, mining-affected sites, and densely populated urban areas.
Challenge: Inconsistencies in government regulations in many countries
Developing countries are increasingly focusing on environmental protection initiatives to tackle rising concerns about pollution and rapid industrialization. However, there is inconsistency among rules and policies across different emerging nations concerning the adoption of environmental protection equipment and technologies. Such inconsistency is a major barrier to market growth, creating operational and compliance difficulties for remediation companies, especially those working on multinational projects or seeking to expand technology use internationally.
Environmental Remediation Market: COMMERCIAL USE CASES ACROSS INDUSTRIES
| COMPANY | USE CASE DESCRIPTION | BENEFITS |
|---|---|---|
|
|
Executed demolition, environmental remediation, and ecological enhancement of the former Pirbright Institute site, managing radiological, chemical, and biological hazards while preparing the land for residential redevelopment | Safe clearance of contaminated structures, removal of hazards, enhanced biodiversity (bat houses, reptile habitats), strong community engagement, and delivery of a sustainable brownfield redevelopment |
|
|
Conducted remediation and enabling works at Lombard Square, including demolition, soil remediation, asbestos and UXO removal, bioremediation, groundwater cleanup using the FabEx system, and reuse of remediated soil onsite | Over 38,000 m³ of soil remediated and reused, reduced offsite disposal costs, adaptive contamination management, timely project completion, regulatory approval, and delivery of ready-to-build development platforms |
|
|
Designed and deployed a rapid-response mobile PFAS water treatment system in Katherine using proprietary SORBIX ion exchange resin technology, followed by a permanent large-scale facility | Emergency system operational in 4 months, >2.3 billion liters of contaminated water treated, immediate restoration of safe drinking water for 10,000 residents, and long-term resilience through a 10 ML/d permanent facility |
Logos and trademarks shown above are the property of their respective owners. Their use here is for informational and illustrative purposes only.
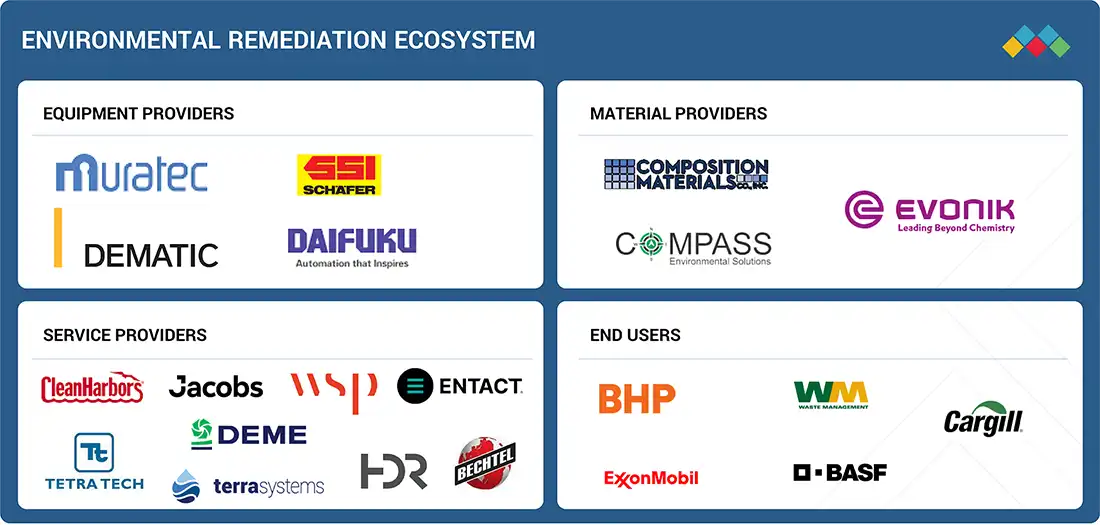
MARKET ECOSYSTEM
The environmental remediation market is highly competitive, with the presence of some major companies, such as CLEAN HARBORS, INC. (US), AECOM (US), Tetra Tech, Inc. (US), WSP (Canada), and Jacobs Solutions Inc. (US). These companies have created a competitive ecosystem by investing in R&D activities to provide highly efficient and reliable environmental remediation services and solutions. Various soil and groundwater remediation service providers offer a wide range of technologies to remove pollutants, such as soil washing, chemical treatment, bioremediation, excavation, in situ grouting, phytoremediation, pump and treat, soil vapor extraction, in situ vitrification, and thermal treatment. These technologies are used in a range of applications such as mining, oil & gas, manufacturing, chemical processing, waste disposal sites, and construction and land development.
Logos and trademarks shown above are the property of their respective owners. Their use here is for informational and illustrative purposes only.
MARKET SEGMENTS
Source: Secondary Research, Interviews with Experts, MarketsandMarkets Analysis
Environmental Remediation Market, By Environmental Medium
Soil remediation dominated the environmental remediation market due to widespread contamination from industrial waste, agricultural chemicals, and construction activities. Rising demand for urban land redevelopment and stricter soil quality regulations have further accelerated adoption. Governments and private developers are increasingly prioritizing soil cleanup to enable safe reuse of brownfield sites and promote sustainable land management.
Environmental Remediation Market, By Site Type
Private sites accounted for the largest share of the market, driven by industrial facility cleanups, real estate redevelopment projects, and corporate sustainability commitments. Growing pressure on enterprises to meet ESG compliance and enhance land asset value is fueling investment in remediation activities. Redeveloping contaminated private properties into residential and commercial hubs continues to be a strong market driver.
Environmental Remediation Market, By Technology
Bioremediation is expected to grow at the highest rate, supported by its cost-effectiveness, scalability, and eco-friendly profile. The rising preference for sustainable cleanup solutions, coupled with advances in microbial and enzymatic treatment technologies, is propelling adoption. Increasing government and industry initiatives to minimize reliance on chemical-based methods are further boosting the use of bioremediation.
Environmental Remediation Market, By Application
The oil & gas sector will continue to dominate the market, owing to frequent hydrocarbon spills, leakages, and soil and groundwater contamination across upstream and downstream operations. Regulatory frameworks mandating site restoration and rising public scrutiny of fossil fuel impacts are driving remediation demand. Companies are increasingly adopting advanced solutions to address legacy contamination and ensure compliance with environmental standards.
REGION
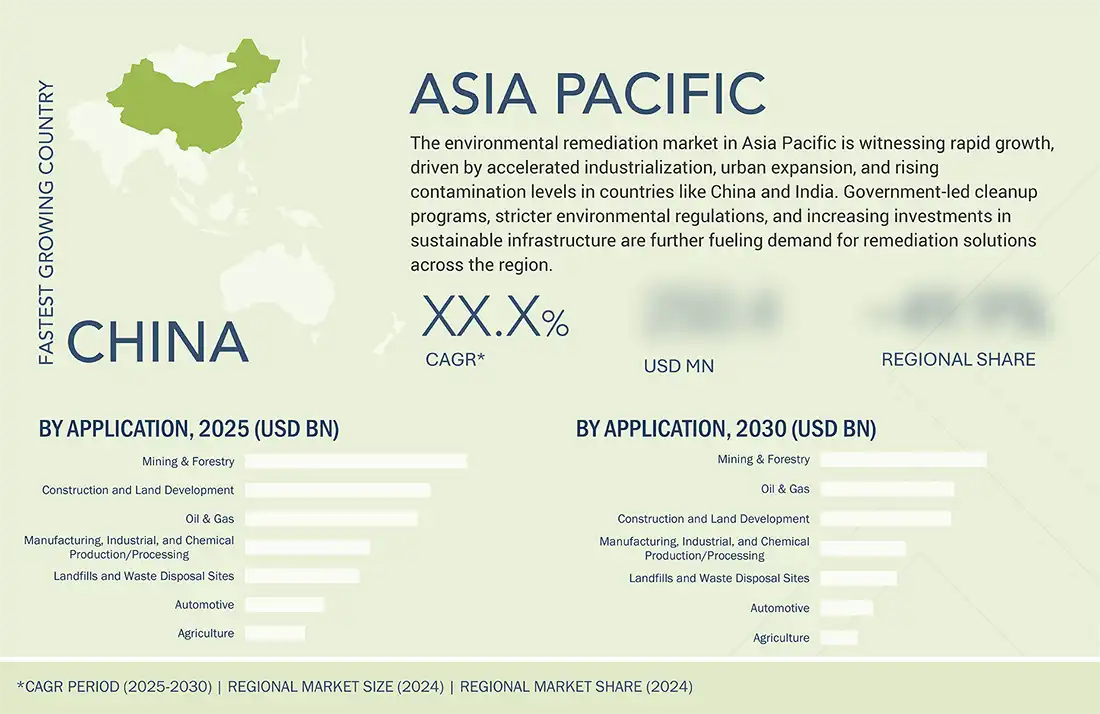
Asia Pacific to be fastest-growing region in global environmental remediation market during forecast period
Asia Pacific is projected to witness the fastest growth in the environmental remediation market, fueled by rapid industrialization, urban expansion, and high levels of pollution in countries like China and India. Government-backed cleanup programs, stricter environmental enforcement, and rising awareness of sustainable land and water use are accelerating adoption. Additionally, growing foreign investments in infrastructure and real estate are further strengthening demand for remediation solutions.
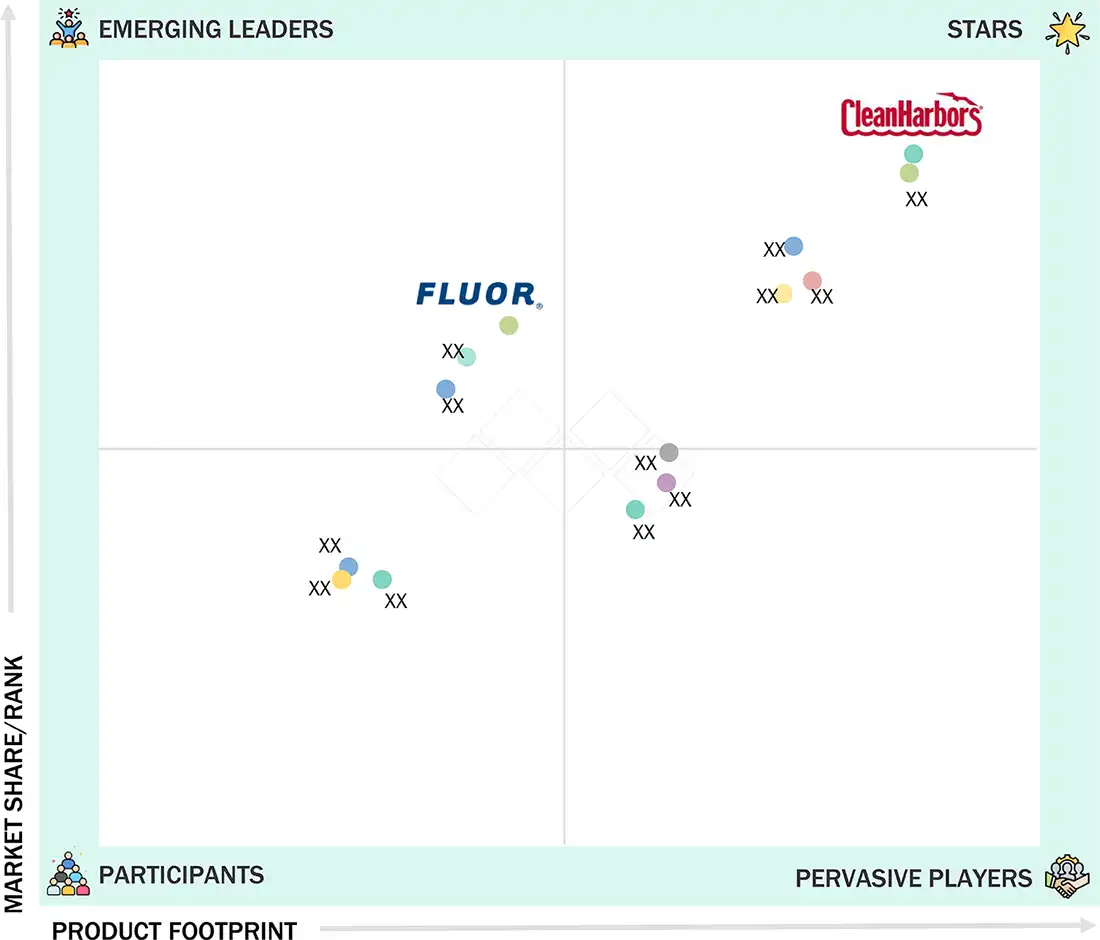
Environmental Remediation Market: COMPANY EVALUATION MATRIX
In the environmental remediation companies matrix, Clean Harbors (Star) leads with a strong market presence, comprehensive service portfolio, and proven expertise in large-scale hazardous waste management and site cleanups, driving adoption across industrial, municipal, and government sectors. Fluor Corporation (Emerging Leader) is gaining traction with integrated engineering, procurement, and construction (EPC)-driven remediation solutions, leveraging its global project execution capabilities. While Clean Harbors dominates with scale and established regulatory partnerships, Fluor demonstrates strong growth potential to advance toward the leaders’ quadrant by expanding its environmental services footprint.
Source: Secondary Research, Interviews with Experts, MarketsandMarkets Analysis
KEY MARKET PLAYERS
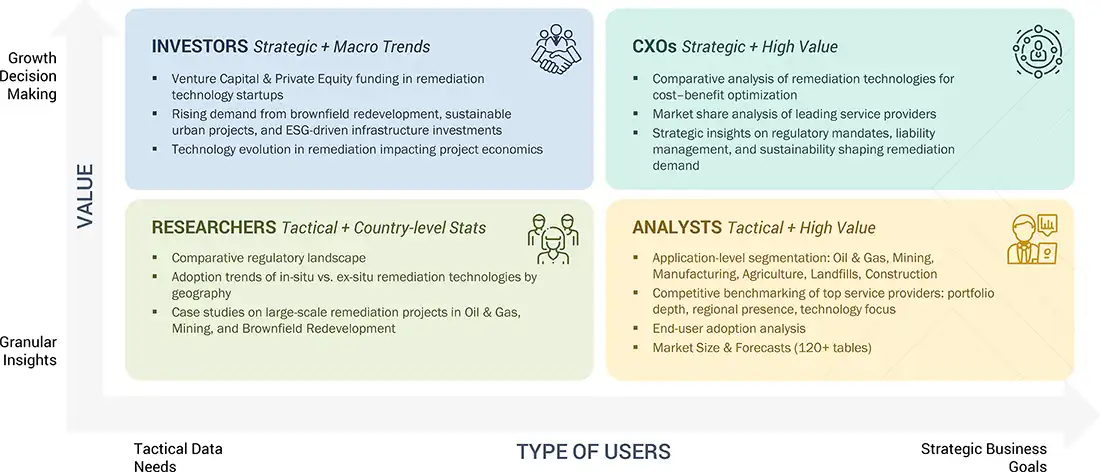
WHAT IS IN IT FOR YOU: Environmental Remediation Market REPORT CONTENT GUIDE
DELIVERED CUSTOMIZATIONS
We have successfully delivered the following deep-dive customizations:
| CLIENT REQUEST | CUSTOMIZATION DELIVERED | VALUE ADDS |
|---|---|---|
| Global Oil & Gas Company | • Comparative benchmarking of remediation technologies (bioremediation, chemical treatment, thermal desorption) for hydrocarbon spill cleanups • Cost–benefit analysis of in-situ vs. ex-situ methods • Regional regulatory frameworks for site restoration | • Optimized technology selection for diverse contamination scenarios • Reduced cleanup costs through efficient method deployment • Enhanced compliance with global environmental standards |
| Real Estate Developer (Brownfield Redevelopment) | • Feasibility study on remediation approaches for contaminated urban lands • Analysis of soil stabilization and reuse practices • Case studies of successful residential & commercial brownfield conversions | • Accelerated land redevelopment approvals • Increased asset value through safe land reuse • Strengthened ESG positioning with sustainable site cleanup |
| Government Environmental Agency | • National mapping of contaminated sites and priority remediation zones • Assessment of public-private partnership (PPP) models for large-scale cleanups • Evaluation of eco-innovative solutions (phytoremediation, permeable reactive barriers) | • Improved policy formulation and budget allocation • Faster project delivery through PPP models • Adoption of low-carbon, eco-friendly remediation practices |
| Mining & Metals Company | • Lifecycle analysis of remediation needs across active and closed mining sites • Technology roadmap for acid mine drainage (AMD) and heavy metal contamination treatment • Benchmarking of global best practices in mining remediation | • Mitigated long-term environmental liabilities • Reduced operational risks and regulatory penalties • Enhanced corporate reputation through sustainable mining practices |
| Investment & Private Equity Firm | • Market opportunity assessment of remediation technology providers • Identification of high-growth startups in eco-friendly remediation solutions • Five-year revenue projections by technology and application segment | • Informed investment decisions in green technologies • Diversified portfolio with sustainable infrastructure assets • Strengthened ROI through entry into a high-growth ESG-driven market |
RECENT DEVELOPMENTS
- May 2025 : Jacobs Solutions Inc. (US) secured a USD 1.5 billion, 10-year IDIQ Multiple Award Task Order Contract (MATOC) from the US Air Force Civil Engineer Center to provide environmental architecture and engineering services. The contract includes restoration, planning, conservation, and quality work across Air Force and DoD sites.
- June 2024 : AECOM (US) and Aquatech (US) partnered to accelerate the deployment of DE-FLUORO, AECOM’s proprietary PFAS destruction technology. This collaboration combines AECOM’s top-ranked environmental expertise with Aquatech’s process and electrochemical technology capabilities, enabling full-service commercialization of PFAS treatment.
- May 2024 : Terra Systems (US) partnered with Allonnia (US) to distribute its 1,4 D-Stroy in situ bioremediation solution across North America. Terra Systems will deploy the technology at contaminated groundwater sites in the US and Canada, with Allonnia providing technical support.
- April 2024 : CLEAN HARBORS, INC. (US) introduced its “Total PFAS Solution,” the industry’s first customizable end-to-end service for managing PFAS contamination. Covering lab analysis, filtration, removal, and destruction, the solution helps industries and government agencies with scalable, cradle-to-grave services.
- February 2024 : Bechtel Corporation (US) and Extrakt Process Solutions (US) formed a strategic partnership to commercialize Extrakt's TNS solid-liquid separation technology. This partnership aims to tackle mine tailings, dewatering, and product recovery challenges in the energy and mining sectors.
Table of Contents
 Exclusive indicates content/data unique to MarketsandMarkets and not available with any competitors.
Methodology
The study involved four main activities to estimate the current size of the environmental remediation market. Extensive secondary research gathered information on the market, peer markets, and parent markets. The next step was to verify these findings, assumptions, and size estimates with industry experts across the value chain through primary research. Both top-down and bottom-up approaches were used to calculate the overall market size. Following that, market segmentation and data triangulation techniques were applied to estimate the market size of segments and subsegments.
Secondary Research
The secondary research process involved reviewing various secondary sources to gather the necessary information for this study. These sources included annual reports, press releases, and investor presentations from companies; white papers; journals and accredited publications; and articles from reputable authors, websites, directories, and databases. The secondary research aimed to gather vital information about the industry’s supply chain, the market’s value chain, the complete pool of key players, market segmentation based on industry trends (down to the most detailed level), regional markets, and significant developments from both market and technology perspectives. The collected secondary data was analyzed to determine the overall market size and was further validated through primary research.
Primary Research
Extensive primary research was conducted after acquiring knowledge about the current scenario of the environmental remediation market through secondary research. Several interviews with experts from the demand and supply sides were carried out across four major regions: North America, Europe, Asia Pacific, and RoW. This primary data was gathered through questionnaires, emails, and telephone interviews.

Note: Other designations include technology heads, media analysts, sales managers, marketing managers, and product managers.
The three tiers of the companies are based on their total revenues as of 2024 - Tier 1: >USD 1 billion, Tier 2: USD 500 million–1 billion, and Tier 3: USD 500 million.
To know about the assumptions considered for the study, download the pdf brochure
Market Size Estimation
In the complete market engineering process, top-down and bottom-up approaches, along with several data triangulation methods, were used to estimate and forecast the overall market segments and subsegments listed in this report. Key players in the market were identified through secondary research, and their market shares in the respective regions were determined through primary and secondary research. This process includes studying the annual and financial reports of leading market players and conducting extensive interviews for key insights-both quantitative and qualitative-with industry experts such as CEOs, VPs, directors, and marketing executives. All percentage shares, splits, and breakdowns were calculated using secondary sources and verified through primary sources. All factors influencing the markets covered in this research were carefully considered, examined in detail, verified through primary research, and analyzed to produce the final quantitative and qualitative data. This data was consolidated and enriched with detailed inputs and analysis from MarketsandMarkets and presented in this report.
Environmental Remediation Market : Top-Down and Bottom-Up Approach

Data Triangulation
After arriving at the overall market size, the market was split into several segments and subsegments using the market size estimation processes explained above. Data triangulation and market breakdown procedures were employed to complete the entire market engineering process and determine the exact statistics of each market segment and subsegment. The data was triangulated by studying various factors and trends from the demand and supply sides in the environmental remediation market.
Market Definition
Environmental remediation refers to the process of removing, reducing, or neutralizing pollutants and contaminants from soil, groundwater, surface water, or sediments to restore the environment to a safe and usable state. It involves a variety of technologies and methods, such as excavation, bioremediation, chemical treatment, and pump-and-treat systems to address contamination caused by industrial activities, waste disposal, oil spills, and other sources. The goal is to protect human health, support ecological recovery, and enable safe land and water use for future development.
Key Stakeholders
- Heavy equipment manufacturers and providers
- Chemical solution providers
- Original equipment manufacturers (OEMs)
- Environmental technology and service providers
- Environmental service contractors
- Market research and consulting firms
- Associations, organizations, forums, standards, and alliances related to the environmental remediation industry
- Technology investors
- Governments and financial institutions
- Venture capitalists, private equity firms, and start-up companies
- End users
Report Objectives
- To define, describe, and forecast the environmental remediation market, in terms of value, based on environmental medium, site type, technology, application, and region
- To forecast the market size, in terms of value, about four major regions—North America, Europe, Asia Pacific (APAC), and Rest of the World (RoW)
- To provide detailed information regarding the major factors influencing the growth of the market (drivers, restraints, opportunities, and challenges)
- To provide an analysis of the value chain, ecosystem, regulations, patent & trade scenario, technological landscape, pricing, key conferences & events, case studies, key stakeholders & buying criteria, and the impact of the 2025 US tariffs; to conduct Porter’s Five Forces analysis on the market
- To analyze the micromarkets with respect to individual growth trends, prospects, and contributions to the total market
- To provide a detailed overview of the value chain of environmental remediation services
- To analyze the opportunities in the market for various stakeholders by identifying the high-growth segments of the market
- To profile the key players and comprehensively analyze their market position in terms of ranking and core competencies, along with detailing the competitive landscape of the market
- To analyze competitive developments in the environmental remediation market, such as product launches and developments, partnerships, contracts, joint ventures, expansion, and research and development
- To analyze the impact of the macroeconomic outlook for each region
Available customizations:
With the given market data, MarketsandMarkets offers customizations according to the specific requirements of companies. The following customization options are available for the report:
Regional Analysis
- Further country-wise breakdown for the environmental remediation market, Further breakdown of the environmental remediation market in the application-specific market
Company Information:
- Detailed analysis and profiling of market players and additional market players (up to five)
Key Questions Addressed by the Report
What is the current size of the Environmental Remediation Market?
The global Environmental Remediation Market was valued at USD 130.40 billion in 2024 and is estimated to reach USD 141.87 billion in 2025.
What is the projected market size of the Environmental Remediation Market by 2030?
The market is projected to reach USD 210.56 billion by 2030, driven by increasing environmental regulations, industrial contamination cleanup, and sustainable land management initiatives.
What is the CAGR of the Environmental Remediation Market during the forecast period?
The Environmental Remediation Market is expected to grow at a CAGR of 8.2% from 2025 to 2030.
What are the major growth drivers of the Environmental Remediation Market?
Key growth drivers include stricter environmental regulations, rising industrial and urban pollution, increasing ESG commitments, growing government investments, and demand for sustainable remediation technologies.
Which environmental medium segment is expected to grow the fastest?
The groundwater remediation segment is projected to register the highest CAGR of 9.8% during the forecast period due to increasing concerns over water contamination and groundwater quality.
Which technology trend is shaping the Environmental Remediation Market?
Bioremediation is the fastest-growing technology segment, driven by its eco-friendly nature, cost-effectiveness, and advancements in microbial and enzymatic treatment solutions.
Which region currently dominates the Environmental Remediation Market?
North America accounted for 32.6% of the global market revenue in 2024, supported by strong regulatory frameworks, environmental cleanup programs, and advanced remediation technologies.
Which region is expected to witness the highest growth during the forecast period?
Asia Pacific is expected to be the fastest-growing regional market due to rapid industrialization, urbanization, government-backed cleanup initiatives, and increasing environmental awareness in countries such as China and India.
Who are the leading companies operating in the Environmental Remediation Market?
Major market participants include Clean Harbors, Inc., WSP Global Inc., AECOM, Jacobs Solutions Inc., and Tetra Tech, Inc.
What opportunities are highlighted in the Environmental Remediation Market report?
Major opportunities include the development of advanced remediation technologies, growing demand from the oil & gas sector, adoption of nanotechnology-based remediation solutions, and increasing investments in brownfield redevelopment and sustainable infr
Need a Tailored Report?
Customize this report to your needs
Get 10% FREE Customization
Customize This ReportPersonalize This Research
- Triangulate with your Own Data
- Get Data as per your Format and Definition
- Gain a Deeper Dive on a Specific Application, Geography, Customer or Competitor
- Any level of Personalization
Let Us Help You
- What are the Known and Unknown Adjacencies Impacting the Environmental Remediation Market
- What will your New Revenue Sources be?
- Who will be your Top Customer; what will make them switch?
- Defend your Market Share or Win Competitors
- Get a Scorecard for Target Partners

Custom Market Research Services
We Will Customise The Research For You, In Case The Report Listed Above Does Not Meet With Your Requirements
Get 10% Free CustomisationTESTIMONIALS

Tetsuya Ohhira
Business Development Manager-Technology Business
Nikon Corporation,
Leading Japanese MNC specializing in optics and imaging productswww.nikon.com
MarketsandMarkets™ response
is quick. Their attitude is flexible and positive. Analyst Insights are globally considered and
significant. Client Services quickly respond to our inquiry and demand. Their wide range of global
surveys help us make our strategic plan.
We hope Knowledge Store will be easier to search
for a report.
VP - Marketing & Business Development
Leading Provider of Process Control Solutions
We engaged with MarketsandMarkets on a study to perform an analysis and recommend a Go-To-Market strategy for metrology and process control in the semiconductor market. The study was tailored to our targets and needs with well-defined milestones. Our overall experience with the MarketsandMarkets team was very good throughout the project in all aspects including the analysis methodologies used, the quality and depth of primary and secondary data sets, the professionalism and flexibility of the team and the ability to meet the target schedule and milestones. We want to thank MarketsandMarkets team for a job well done.
Growth opportunities and latent adjacency in Environmental Remediation Market


Jay
Apr, 2026
How do regulatory inconsistencies across countries affect expansion?.
Wayne
Apr, 2026
Does it help in risk assessment for investment decisions?.
Roger
Feb, 2019
I am looking to see the market size for the reagents used in situ chemical oxidation in remediation, particularly persulfate and permanganate oxidants. My interest is more historical than projected..
Shamanth
Jun, 2017
We want Bioremediation, soil and groundwater contaminated with chlorinated solvents and hexavalent chromium, Bio stimulation, Bio Augmentation, India market..
Peter
Dec, 2019
I'm developing a software tool and want to understand if it's applicable to the environmental remediation industry and we can generate revenue through it..
Michael
Sep, 2022
Working to understand the remediation market - post Covid. .
Anda
Aug, 2017
We want environmental Remediation Market, By Technology, By Application Numbers..