This study embarked on a comprehensive process to ascertain the current size of the progressing cavity pump market. It commenced with an exhaustive secondary research phase, aimed at gathering data on the market, related sectors, and the broader industry landscape. Subsequently, the collected data, assumptions, and calculations underwent rigorous validation through primary research, involving consultations with industry experts spanning the entire value chain. The assessment of the overall market size was conducted through tailored analyses for each country. Following this, a meticulous examination of the market took place, with the data cross-referenced to estimate the sizes of various segments and sub-segments within the market. This two-phased approach, integrating both secondary and primary research methodologies, enhances the reliability and accuracy of the study's findings.
Secondary Research
Throughout this research study, an extensive array of secondary sources was leveraged, encompassing directories, databases, and reputable references such as Hoover's, Bloomberg BusinessWeek, Factiva, World Bank, the US Department of Energy (DOE), and the International Energy Agency (IEA). These sources played a pivotal role in acquiring crucial data necessary for conducting a comprehensive analysis of the global progressing cavity pump market. Encompassing technical, market-oriented, and commercial perspectives, these secondary sources significantly enriched the breadth and depth of the study. Additionally, supplementary secondary sources included annual reports, press releases, investor presentations, whitepapers, authoritative publications, articles authored by esteemed experts, information from industry associations, trade directories, and various database repositories. The utilization of a diverse range of secondary sources ensures a robust and well-informed foundation for the research study.
Primary Research
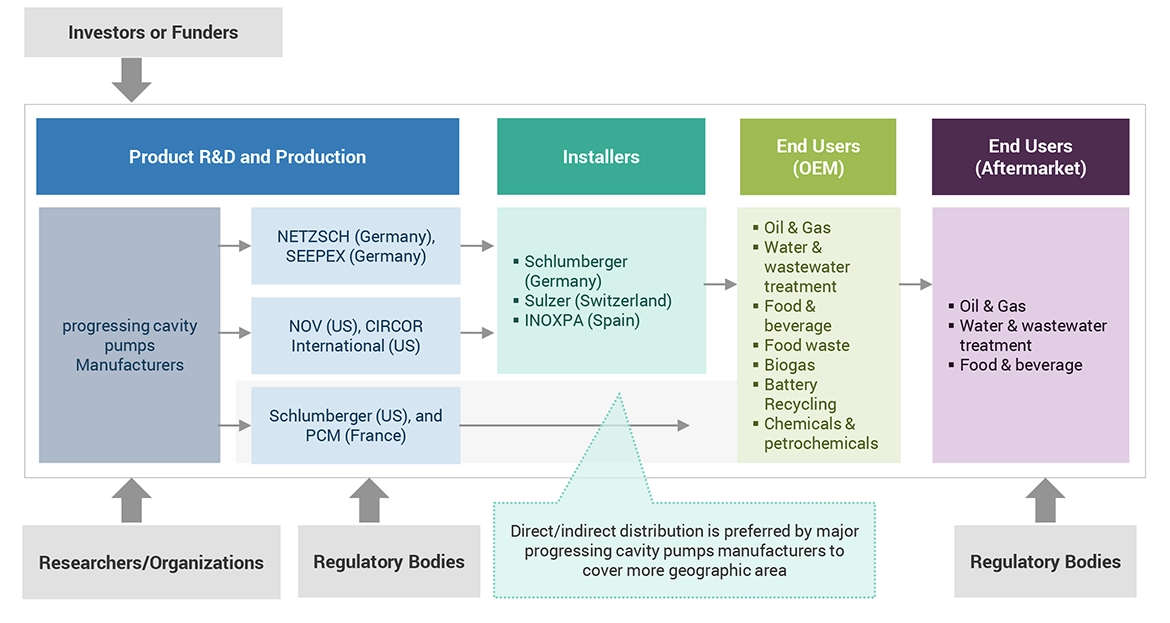
The progressing cavity pump market encompasses numerous stakeholders across its supply chain, including component manufacturers, product manufacturers/assemblers, service providers, distributors, and end-users. Industrial end-users are the primary drivers of market demand, with increasing requirements from transmission and distribution utilities also contributing significantly to market growth. On the supply side, a notable trend is the heightened demand for contracts from the industrial sector, alongside a significant prevalence of mergers and acquisitions among major industry players. To attain a comprehensive understanding of the market, both qualitatively and quantitatively, a diverse array of primary sources from both the supply and demand sides were interviewed. The breakdown provided below delineates the primary respondents who played a pivotal role in offering insights for the research study.

To know about the assumptions considered for the study, download the pdf brochure
Market Size Estimation
Bottom-up & Top down methodology was used to carefully assess and validate the market size for progressive cavity pumps. The dimensions of different market subsegments were determined with rigor using this procedure. The following are the main phases of the research process.
This methodology examined regional and national production data for all varieties of progressive cavity pumps.
In-depth secondary and primary research was carried out in order to fully comprehend the worldwide market environment for different kinds of cavity pumps.
Leading authorities on the development of progressive cavity pump systems, including significant OEMs and Tier I suppliers, were questioned in several primary interviews.
Qualitative elements including market drivers, limitations, opportunities, and challenges are taken into consideration when projecting and estimating market size.
Global Progressing cavity pump Market Size: Bottom-Up Approach

To know about the assumptions considered for the study, Request for Free Sample Report
Global Progressing cavity pump Market Size: Top-Down Approach

Data Triangulation
Using the previously mentioned approaches, which included segmenting the market into many segments and sub-segments, was the process of determining the total market size. Methods of data triangulation and market segmentation were used as appropriate to complete the thorough market analysis and acquire precise statistics for each market segment and subsegment. Data triangulation involved a detailed analysis of many variables and patterns from the supply and demand sides of the cavity pump industry environment.
Market Definition
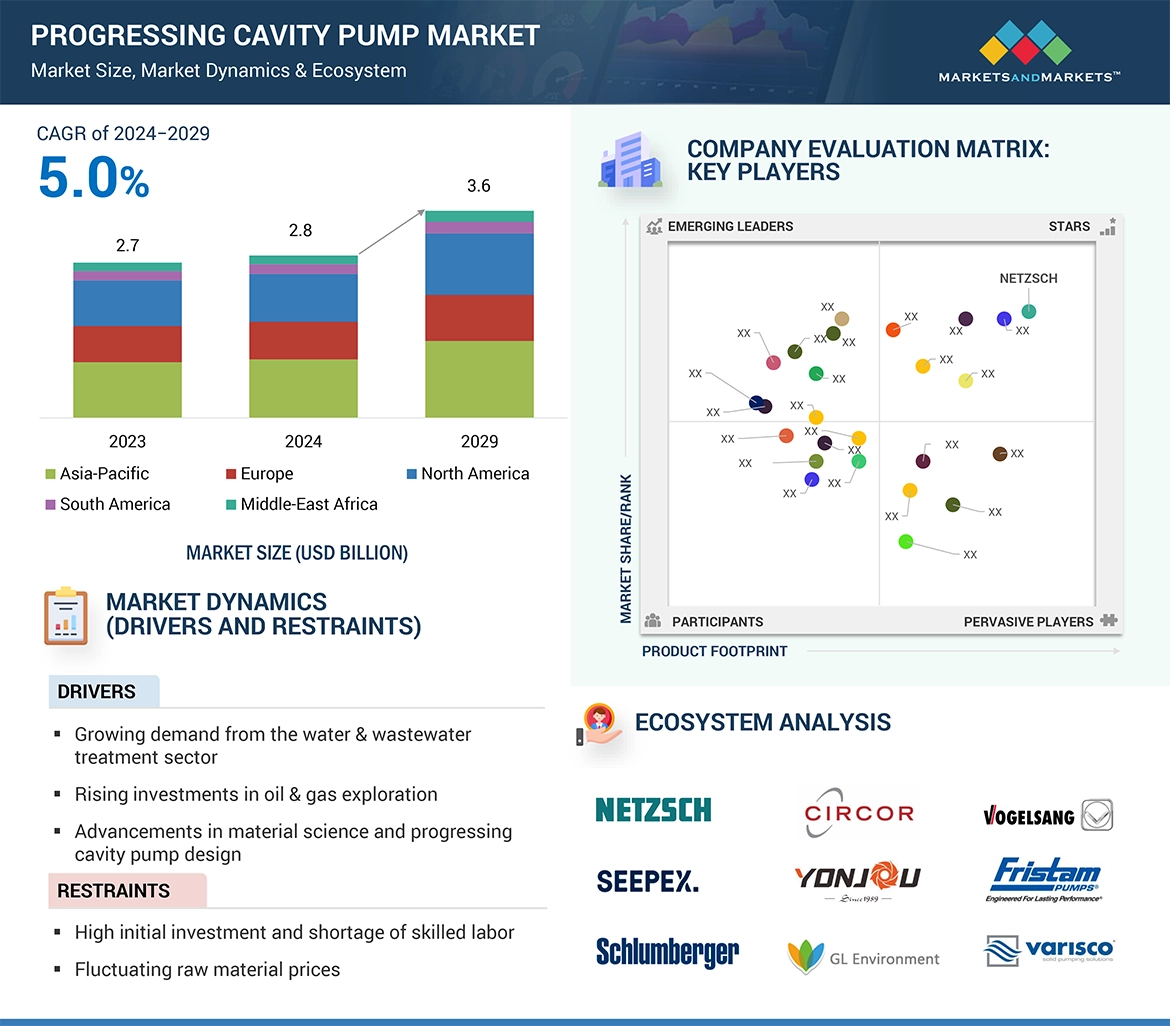
The progressing cavity pump market encompasses the production, distribution, and utilization of progressing cavity pumps, a type of positive displacement pump characterized by a helical rotor rotating inside a fixed stator. These pumps are widely employed across various industries for the efficient handling of viscous, abrasive, and shear-sensitive fluids, making them indispensable in applications ranging from oil and gas extraction to water and wastewater treatment, food and beverage processing, chemicals and petrochemicals, mining, and construction. Key components of the market include manufacturers of pump components and complete systems, assemblers, service providers offering maintenance and repair services, distributors facilitating the supply chain, and end-users spanning industrial sectors with diverse fluid handling requirements. Market dynamics encompass factors such as technological advancements, regulatory landscape, industrial expansion, infrastructure development, and environmental considerations, all of which influence the demand for progressing cavity pumps and shape market trends on a global scale.
Key Stakeholders
-
Government Utility Providers
-
Independent Power Producers
-
Pump manufacturers
-
Power equipment and garden tool manufacturers
-
Consulting companies in the energy & power sector
-
Distribution utilities
-
Government and research organizations
-
Organizations, forums, and associations
-
Raw material suppliers
-
State and national regulatory authorities
-
Pump manufacturers, distributors, and suppliers
-
Pump original equipment manufacturers (OEMs)
Objectives of the Study
-
The progressing cavity pump market will be defined, characterised, segmented, and projected using parameters such as power rating, pumping capacity, end-user industry, product type & stage type.
-
To project market sizes for the key nations in each of the following five regions: North America, South America, Europe, Asia Pacific, the Middle East, and Africa.
-
To offer thorough insights into the elements influencing the industry's prospects, problems, opportunities, and constraints.
-
To strategically examine each subsegment's growth trends, future potential, and overall market share.
-
To assess the competitive environment for business executives and the market prospects for possible purchasers.
-
To develop strategic profiles for the top businesses after carefully examining their market shares and fundamental strengths.
-
To keep an eye on and assess competitive changes, including alliances, contracts for sales, the introduction of new products, contracts, joint ventures, expansions, and investments, in the cavity pump market as it develops.
-
This research assesses the market for advancing cavity pumps.
Available Customization
With the given market data, MarketsandMarkets offers customizations based on the company’s specific needs. The following customization options are available for the report:
Product Analysis
-
Product Matrix, which provides a detailed comparison of the product portfolio of each company
Company Information
-
Detailed analyses and profiling of additional market players (up to 5)


Growth opportunities and latent adjacency in Progressing Cavity Pump Market