[166 Pages Report] The global ethylene carbonate market size is estimated to be valued at USD 290 million in 2021 and projected to reach USD 389 million by 2026, at a CAGR of 6.1%, during the same period. The demand for ethylene carbonate is driven mainly by its growing demand in lithium battery electrolyte and lubricant applications.
To know about the assumptions considered for the study, download the pdf brochure
Ethylene carbonate is primarily used as a raw material for the production of lubricants. It is also used as a solvent for many polymers, resins, plasticizers, and adhesives & sealants. It is also used as an electrolyte in various batteries such as lithium-ion batteries. Thus, the impact of COVID-19 on major end-use industries, such as plastics, battery manufacturing, and construction, is expected to directly impact the ethylene carbonate market.
Drivers: Growing demand in lithium battery electrolyte and lubricant applications
The growing demand for ethylene carbonate in lithium-ion battery electrolytes is due to the widespread use of lithium-ion batteries in electric vehicles. Currently, there is a huge dependence on oil as fuel in the transportation system; almost 70% of the oil is being used in transport vehicles. This dependency has led to rising concerns among both environmentalists and economists. Increasing awareness about environmental issues has led to the adoption of electric vehicles. The widespread use of electric vehicles in countries such as the US, France, China, Japan, Germany, and the UK has inevitably led to the rising adoption of Li-ion batteries, which, in turn, is increasing the demand for ethylene carbonate. Lubricants are widely used in the transportation and manufacturing industries. They are used in automotive engines for collecting, cleaning, and cooling the engine. They help in reducing the wear and tear of engines caused by the friction of metallic parts. Ethylene carbonate is used as a reactive intermediate in the production of lubricants and greases.
Restraints: Volatility in raw material prices
Ethylene is among the most produced organic compounds. It is an acute building block for the petrochemical industry. It is produced in steam-cracking units from a variety of petroleum-based feedstocks, including naphtha. Ethylene is used in manufacturing several major derivatives, such as ethylene oxide, which are further required to produce ethylene carbonate.
The price and availability of raw materials are key factors considered for determining the cost structure of the final product. The raw materials used for manufacturing ethylene carbonates include ethane and propane. Most of these materials are crude oil-based derivatives that are vulnerable to fluctuations in commodity prices. This creates volatility in the raw material prices of ethylene carbonate.
Opportunities: Emergence of lithium-sulfur batteries
The energy storing capacity of lithium-sulfur batteries is leading to their growing demand. These batteries can store ten times higher energy than lithium-ion batteries. Ethylene carbonate is used as an electrolyte in lithium-sulfur batteries. Lithium-sulfur batteries are considered promising next-generation batteries for electric vehicles. This is because they have sulfur cathode that is cheap and easily available and has low toxic impact on the environment compared to lithium-ion batteries. This is expected to increase the demand for ethylene carbonate in lithium-sulfur batteries.
Challenges: Fluctuating oil & gas prices
The increasing global demand for crude oil and the unrest in the Middle East are major factors responsible for fluctuating prices of ethylene carbonate. The ethylene carbonate market is also affected by high transport costs, driven by rising fuel prices and high manufacturing costs, resulting from increased energy costs. Manufacturers of ethylene carbonate have responded to the increase in manufacturing cost by ensuring that the rise in prices is asymmetrically shared, with end-users paying the majority share. Hence, the fluctuating oil & gas prices act as a challenge for the ethylene carbonate market.
Based on the form, the solid segment is expected to be the most significant contributor in the ethylene carbonate market during the forecast period.
Based on the form, the solid segment is estimated to have the highest market share during the forecast period. Ethylene carbonate, at room temperature, is a transparent crystalline solid and is used in the same form in most applications. This solid form organic compound is used as a solvent for lubricants, as a crosslinking agent in the super absorber polymer production, in the separation of gas washing process and oil fields, and as an intermediate in the synthesis of polycarbonate diol. It is also used in various other things such as plasticizers, resist strip solvents, fiber processing agents, soil hardening agents, organic solvents, raw materials for organic synthesis, medical products, solid battery electrolytes, and solid capacitor electrolytes. The solid form of ethylene carbonate accounts for a larger share due to its usage in more applications compared to liquid form.
Based on the application, the lubricant segment is expected to be the most significant contributor in the ethylene carbonate market during the forecast period.
Based on the application, the lubricant segment is estimated to have the highest market share during the forecast period. The growth in this segment is attributed to its growing usage in industrial, oil & gas, and automotive end-use industry. In the automotive sector, lubricants are used as cooling and cleaning agents. The factors mentioned above are expected to drive demand during the forecast period.
By end-use industry, the automotive segment is expected to be the most significant contributor in the ethylene carbonate market during the forecast period.
Based on the end-use industry, the automotive segment is expected to account for the largest share of the market in 2021. The growth in this segment is attributed to due to different requirements by manufacturers, such as reduced emissions of volatile organic compounds (VOCs) and durable protective surface coating on vehicles. Moreover, the rising demand for electric vehicles will also drive the demand for ethylene carbonate. These factors are expected to drive demand during the forecast period.
APAC is expected to account for the largest market size during the forecast period
APAC is the largest and fastest-growing ethylene carbonate market, owing to its increasing usage in various end-use industries, such as oil & gas, automotive, industrial, and medical. Furthermore, the growing population, rising disposable income, and economic growth in China and Taiwan are augmenting the market growth. These factors are expected to fuel the demand for ethylene carbonate in the region during the forecast period.
The major vendors in the ethylene carbonate market include Linde Oriental Union Chemical Corporation (Taiwan), Huntsman (US), BASF (Germany), Mitsubishi Chemical (Japan), Toagosei Co., Ltd. (Japan), Asahi Kasei (Japan), New Japan Chemical Co. Ltd (Japan), Shandong Shida Shenghua Chemical Group (China), Zibo Donghai Industries Co. Ltd. (China), and Shandong Senjie Cleantech Co. Ltd (China).
Report Metric |
Details |
Market size available for years |
20182026 |
Base year considered |
2020 |
Forecast period |
20212026 |
Unit considered |
Value (USD Million), Volume (Tons) |
Segments covered |
Form, Application, End-Use Industry, and Region |
Regions covered |
North America, APAC, Europe, South America, and Middle East & Africa |
Companies covered |
Oriental Union Chemical Corporation (Taiwan), Huntsman (US), BASF (Germany), Mitsubishi Chemical (Japan), Toagosei Co., Ltd. (Japan), Asahi Kasei (Japan), New Japan Chemical Co. Ltd (Japan), Shandong Shida Shenghua Chemical Group (China), Zibo Donghai Industries Co. Ltd. (China), Shandong Senjie Cleantech Co. Ltd (China), Otto Chemie Pvt Ltd (India), Tokyo Chemical Industry Co. Ltd (Japan), Panax Etec (South Korea), Alchem Chemical Company (US), RX Marine International (India), Vizag Chemical International (India), Empower Materials (US), Liaoning Oxiranchem Inc. (China) Zhengzhou Meiya Chemical Products Co., Ltd. (China), Shandong Lixing Chemicals Co. Ltd. (China), Parsol Chemicals Pvt. Ltd. (India), Fujifilm Wako Pure Chemical Corporation (Japan), Taixing Taida Fine Chemical Co. Ltd (China), and Alfa Aesar (Germany) |
This research report categorizes the ethylene carbonate market based on form, application, end-use industry, and region.
By Form
By Application
By End-Use Industry:
By Region:
What is ethylene carbonate? What are its applications?
Ethylene carbonate is a cyclic ester made from the reaction of propylene, ethylene oxide, and butylene oxide with carbon dioxide. It is used as a polar solvent or a cross-linking agent in the production and synthesis of superabsorber polymer for various applications such as lubricants, greases, lithium-ion batteries, and oil field solutions.
Who are the major players involved in this market?
Oriental Union Chemical Corporation (Taiwan), Huntsman (US), BASF (Germany), Mitsubishi Chemical (Japan), Toagosei Co., Ltd. (Japan), Asahi Kasei (Japan), New Japan Chemical Co. Ltd (Japan), Shandong Shida Shenghua Chemical Group (China), Zibo Donghai Industries Co. Ltd. (China), and Shandong Senjie Cleantech Co. Ltd (China) are the major manufacturers in the DMC market.
What is the biggest challenge for the growth of ethylene carbonate market?
Fluctuations in oil & gas prices is the biggest challenge for the growth of ethylene carbonate market
Which region is likely to support ethylene carbonate market growth? Why?
Asia Pacific region will be supporting the growth of ethylene carbonate market, owing to its increasing usage in various end-use industries, such as oil & gas, automotive, industrial, and medical. Furthermore, the growing population, rising disposable income, and economic growth in China and Taiwan are augmenting the market growth.
Which application leads the growth of ethylene carbonate market?
The lithium battery electrolyte segment would assist growth for the ethylene carbonate market.
Which end-use industry accounts for the major share of the ethylene carbonate market?
The automotive industry accounted for the largest share of ethylene carbonate market. .
To speak to our analyst for a discussion on the above findings, click Speak to Analyst
TABLE OF CONTENTS
1 INTRODUCTION (Page No. - 24)
1.1 OBJECTIVES OF THE STUDY
1.2 MARKET DEFINITION
1.3 INCLUSIONS & EXCLUSIONS
TABLE 1 ETHYLENE CARBONATE MARKET, BY FORM: INCLUSIONS & EXCLUSIONS
TABLE 2 ETHYLENE CARBONATE MARKET, BY REGION: INCLUSIONS & EXCLUSIONS
1.4 MARKET SCOPE
1.4.1 ETHYLENE CARBONATE MARKET SEGMENTATION
1.4.2 YEARS CONSIDERED FOR THE STUDY
1.5 CURRENCY
1.6 UNIT CONSIDERED
1.7 LIMITATIONS
1.8 STAKEHOLDERS
1.9 SUMMARY OF CHANGES
2 RESEARCH METHODOLOGY (Page No. - 28)
2.1 RESEARCH DATA
FIGURE 1 ETHYLENE CARBONATE MARKET: RESEARCH DESIGN
2.1.1 SECONDARY DATA
2.1.1.1 Key data from secondary sources
2.1.2 PRIMARY DATA
2.1.2.1 Key data from primary sources
2.1.2.2 Key insights
2.1.2.3 List of participating companies for primary research
2.1.2.4 Breakdown of primary interviews
2.2 BASE NUMBER CALCULATION
2.2.1 SUPPLY-SIDE APPROACH
2.2.2 DEMAND-SIDE APPROACH - 1
2.2.3 DEMAND SIDE APPROACH - 2
2.3 MARKET SIZE ESTIMATION
2.3.1 MARKET SIZE ESTIMATION METHODOLOGY: BOTTOM-UP APPROACH
2.3.2 MARKET SIZE ESTIMATION METHODOLOGY: TOP-DOWN APPROACH
2.4 DATA TRIANGULATION
FIGURE 2 ETHYLENE CARBONATE MARKET: DATA TRIANGULATION
2.5 ASSUMPTIONS
2.6 LIMITATIONS & RISK ASSESSMENT
TABLE 3 LIMITATIONS & ASSOCIATED RISK
3 EXECUTIVE SUMMARY (Page No. - 38)
FIGURE 3 LUBRICANTS APPLICATION TO DOMINATE THE OVERALL ETHYLENE CARBONATE MARKET
FIGURE 4 AUTOMOTIVE INDUSTRY TO DOMINATE THE ETHYLENE CARBONATE MARKET
FIGURE 5 APAC DOMINATED THE ETHYLENE CARBONATE MARKET IN 2020
4 PREMIUM INSIGHTS (Page No. - 41)
4.1 ATTRACTIVE OPPORTUNITIES IN THE ETHYLENE CARBONATE MARKET
FIGURE 6 GROWING USAGE OF ETHYLENE CARBONATE IN VARIOUS APPLICATIONS TO DRIVE THE MARKET
4.2 ETHYLENE CARBONATE MARKET, BY REGION
FIGURE 7 APAC TO BE LARGEST MARKET BETWEEN 2021 AND 2026
4.3 ETHYLENE CARBONATE MARKET IN APAC, BY COUNTRY AND APPLICATION
FIGURE 8 CHINA ACCOUNTED FOR LARGEST SHARE IN APAC
4.4 ETHYLENE CARBONATE MARKET: MAJOR COUNTRIES
FIGURE 9 CHINA TO BE FASTEST GROWING MARKET BETWEEN 2021 AND 2026
5 MARKET OVERVIEW (Page No. - 43)
5.1 INTRODUCTION
5.2 MARKET DYNAMICS
FIGURE 10 DRIVERS, RESTRAINTS, OPPORTUNITIES, AND CHALLENGES IN THE ETHYLENE CARBONATE MARKET
5.2.1 DRIVERS
5.11.1.1 Shift in the automotive industry
5.11.1.2 Most impacted regions
5.2.2 RESTRAINTS
5.11.1.3 Customers perspective on growth outlook
5.11.2.1 Impact of COVID-19 on the plastic industry: demand side
5.2.3 OPPORTUNITIES
5.11.2.2 Impact of COVID-19 on the plastic industry: supply-side
5.11.5.1 Impact on construction of new facilities
5.2.4 CHALLENGES
5.2.1.1 Growing demand in lithium-ion battery electrolyte and lubricant applications
FIGURE 11 FLUCTUATION IN PRICES OF CRUDE OIL, 2000-2020
5.3 PORTERS FIVE FORCES ANALYSIS
FIGURE 12 ETHYLENE CARBONATE MARKET: PORTERS FIVE FORCES ANALYSIS
TABLE 4 PORTER'S FIVE FORCES ANALYSIS
5.3.1 BARGAINING POWER OF SUPPLIERS
5.3.2 THREAT OF NEW ENTRANTS
5.3.3 THREAT OF SUBSTITUTES
5.3.4 BARGAINING POWER OF BUYERS
5.3.5 INTENSITY OF COMPETITIVE RIVALRY
5.4 MACROECONOMIC OVERVIEW & TRENDS
5.4.1 TRENDS & FORECAST OF GDP
TABLE 5 GLOBAL GDP PER CAPITA, USD BILLION (20132019)
FIGURE 13 TRENDS & FORECAST OF GDP OF 25 COUNTRIES, USD BILLION (2019)
5.4.2 TRENDS OF OIL & NATURAL GAS PRICES
TABLE 6 OIL & GAS PRICES GLOBALLY, USD/BBL (20132020)
FIGURE 14 ANNUAL CRUDE OIL PRICE FLUCTUATION (20152020)
FIGURE 15 QUARTERLY CRUDE OIL PRICE FLUCTUATION (2020)
5.4.3 INDUSTRY OUTLOOK
5.2.1.2 Massive industrial growth in APAC and Africa
FIGURE 16 ELECTRIC VEHICLE SALES, 20102020
5.5 TECHNOLOGY ANALYSIS
5.6 SUPPLY CHAIN ANALYSIS
5.7 ECOSYSTEM/MARKET MAP OF ETHYLENE CARBONATE
FIGURE 17 ECOSYSTEM/MARKET MAP OF ETHYLENE CARBONATE
TABLE 7 ETHYLENE CARBONATE MARKET: ECOSYSTEM
5.8 AVERAGE SELLING PRICE TREND
TABLE 8 AVERAGE PRICES OF ETHYLENE CARBONATE, BY REGION (USD/TON)
5.9 PATENT ANALYSIS
5.9.1 INTRODUCTION
FIGURE 18 PUBLICATION TRENDS (2012-2020)
5.9.2 INSIGHTS
FIGURE 19 TREND ANALYSIS AND GRAPHICAL REPRESENTATION
5.9.3 TOP ASSIGNEES
5.10 COVID-19 IMPACT ON ETHYLENE CARBONATE MARKET
FIGURE 20 IMPACT OF COVID-19 IN 2020 (Q1) ON DIFFERENT COUNTRIES
FIGURE 21 THREE SCENARIO-BASED ANALYSIS OF COVID-19 IMPACT ON GLOBAL ECONOMY
5.11 IMPACT OF COVID-19 ON THE END-USE INDUSTRIES OF ETHYLENE CARBONATE
5.11.1 IMPACT ON AUTOMOTIVE INDUSTRY
5.2.2.1 Volatility in raw material prices
5.2.2.2 Use of highly toxic raw materials production of ethylene carbonate
5.2.3.1 Emergence of lithium-sulfur batteries
5.11.2 IMPACT OF COVID-19 ON PLASTIC INDUSTRY
5.2.3.2 Increase in use of bio-based plasticizers
5.2.4.1 Fluctuating oil & gas prices
5.11.3 IMPACT ON BATTERY MANUFACTURING INDUSTRY
5.11.4 COVID-19 IMPACT ON INDUSTRIAL SECTOR
5.11.5 IMPACT ON CONSTRUCTION INDUSTRY
5.4.3.1 Electric Vehicles (EVs)
5.12 TRENDS/ DISRUPTIONS IMPACTING CUSTOMERS BUSINESS
FIGURE 22 REVENUE SHIFT & NEW REVENUE POCKETS FOR ETHYLENE CARBONATE MANUFACTURERS
5.13 TRADE DATA STATISTICS
FIGURE 23 GLOBAL TRADE ROUTES FOR ETHYLENE CARBONATE
5.14 CASE STUDY ANALYSIS
5.15 TARIFF AND REGULATORY LANDSCAPE
6 ETHYLENE CARBONATE MARKET, BY FORM (Page No. - 68)
6.1 INTRODUCTION
FIGURE 24 SOLID FORM TO DOMINATE THE ETHYLENE CARBONATE MARKET
TABLE 9 ETHYLENE CARBONATE MARKET SIZE, BY FORM, 20182026 (TON)
6.2 SOLID
6.2.1 USAGE IN MULTIPLE APPLICATIONS TO DRIVE DEMAND
6.3 LIQUID
6.3.1 GROWING USE IN LITHIUM-ION BATTERY ELECTROLYTES TO DRIVE DEMAND
7 ETHYLENE CARBONATE MARKET, BY APPLICATION (Page No. - 71)
7.1 INTRODUCTION
FIGURE 25 LUBRICANTS TO BE THE LARGEST APPLICATION DURING THE FORECAST PERIOD
TABLE 10 ETHYLENE CARBONATE MARKET SIZE, BY APPLICATION, 20182026 (USD MILLION)
TABLE 11 ETHYLENE CARBONATE MARKET SIZE, BY APPLICATION, 20182026 (USD TON)
7.2 SURFACE COATINGS
7.2.1 INCREASE IN USE OF SURFACE COATINGS IN END-USE INDUSTRIES TO DRIVE DEMAND
TABLE 12 SURFACE COATINGS: ETHYLENE CARBONATE MARKET SIZE, BY REGION, 20182026 (USD MILLION)
TABLE 13 SURFACE COATINGS: ETHYLENE CARBONATE MARKET SIZE, BY REGION, 20182026 (TON)
7.3 PLASTICIZERS
7.3.1 INCREASED DEMAND FOR PLASTICIZERS IN APAC TO BOOST THE MARKET
TABLE 14 PLASTICIZERS: ETHYLENE CARBONATE MARKET SIZE, BY REGION, 20182026 (USD MILLION)
TABLE 15 PLASTICIZERS: ETHYLENE CARBONATE MARKET SIZE, BY REGION, 20182026 (TON)
7.4 LUBRICANTS
7.4.1 INCREASED USE IN VARIOUS INDUSTRIES EXPECTED TO DRIVE DEMAND
TABLE 16 LUBRICANTS: ETHYLENE CARBONATE MARKET SIZE, BY REGION, 20182026 (USD MILLION)
TABLE 17 LUBRICANTS: ETHYLENE CARBONATE MARKET SIZE, BY REGION, 20182026 (TON)
7.5 LITHIUM BATTERY ELECTROLYTES
7.5.1 INCREASING DEMAND FOR ELECTRIC VEHICLES EXPECTED TO DRIVE DEMAND
TABLE 18 LITHIUM BATTERY ELECTROLYTE: ETHYLENE CARBONATE MARKET SIZE, BY REGION, 20182026 (USD MILLION)
TABLE 19 LITHIUM BATTERY ELECTROLYTE: ETHYLENE CARBONATE MARKET SIZE, BY REGION, 20182026 (TON)
7.6 OTHERS
TABLE 20 OTHERS: ETHYLENE CARBONATE MARKET SIZE, BY REGION, 20182026 (USD MILLION)
TABLE 21 OTHERS: ETHYLENE CARBONATE MARKET SIZE, BY REGION, 20182026 (TON)
8 ETHYLENE CARBONATE MARKET, BY END-USE (Page No. - 78)
8.1 INTRODUCTION
FIGURE 26 AUTOMOTIVE INDUSTRY TO DOMINATE THE ETHYLENE CARBONATE MARKET
TABLE 22 ETHYLENE CARBONATE MARKET SIZE, BY END-USE INDUSTRY, 20182026 (USD MILLION)
TABLE 23 ETHYLENE CARBONATE MARKET SIZE, BY END-USE INDUSTRY, 20182026 (TON)
8.2 AUTOMOTIVE
8.2.1 USE OF ETHYLENE CARBONATE IN LITHIUM-ION BATTERIES TO DRIVE DEMAND
TABLE 24 AUTOMOTIVE: ETHYLENE CARBONATE MARKET SIZE, BY REGION, 20182026 (USD MILLION)
TABLE 25 AUTOMOTIVE: ETHYLENE CARBONATE MARKET SIZE, BY REGION, 20182026 (TON)
8.3 OIL & GAS
8.3.1 INCREASED USAGE OF LUBRICANTS IN EQUIPMENT TO DRIVE DEMAND
TABLE 26 OIL & GAS: ETHYLENE CARBONATE MARKET SIZE, BY REGION, 20182026 (USD MILLION)
TABLE 27 OIL & GAS: ETHYLENE CARBONATE MARKET SIZE, BY REGION, 20182026 (TON)
8.4 PERSONAL CARE & HYGIENE
8.4.1 INCREASE IN PER CAPITA SPENDING POWER TO DRIVE DEMAND
TABLE 28 PERSONAL CARE & HYGIENE: ETHYLENE CARBONATE MARKET SIZE, BY REGION, 20182026 (USD MILLION)
TABLE 29 PERSONAL CARE & HYGIENE: ETHYLENE CARBONATE MARKET SIZE, BY REGION, 20182026 (TON)
8.5 INDUSTRIAL
8.5.1 DEMAND FOR ETHYLENE CARBONATE AS LUBRICANT STABILIZER PROJECTED TO BE STEADY
TABLE 30 INDUSTRIAL: ETHYLENE CARBONATE MARKET SIZE, BY REGION, 20182026 (USD MILLION)
TABLE 31 INDUSTRIAL: ETHYLENE CARBONATE MARKET SIZE, BY REGION, 20182026 (TON)
8.6 MEDICAL
8.6.1 INCREASED USAGE IN MEDICAL DIAGNOSIS AS NANOPARTICLES TO DRIVE DEMAND
TABLE 32 MEDICAL: ETHYLENE CARBONATE MARKET SIZE, BY REGION, 20182026 (USD MILLION)
TABLE 33 MEDICAL: ETHYLENE CARBONATE MARKET SIZE, BY REGION, 20182026 (TON)
8.7 OTHERS
TABLE 34 OTHER END-USE INDUSTRIES: ETHYLENE CARBONATE MARKET SIZE, BY REGION, 20182026 (USD MILLION)
TABLE 35 OTHER END-USE INDUSTRIES: ETHYLENE CARBONATE MARKET SIZE, BY REGION, 20182026 (TON)
9 ETHYLENE CARBONATE MARKET, BY REGION (Page No. - 86)
9.1 INTRODUCTION
FIGURE 27 CHINA TO GROW AT THE HIGHEST RATE DURING THE FORECAST PERIOD
TABLE 36 ETHYLENE CARBONATE MARKET SIZE, BY REGION, 20182026 (USD MILLION)
TABLE 37 ETHYLENE CARBONATE MARKET SIZE, BY REGION, 20182026 (TON)
TABLE 38 ETHYLENE CARBONATE MARKET SIZE, BY APPLICATION, 20182026 (USD MILLION)
TABLE 39 ETHYLENE CARBONATE MARKET SIZE, BY APPLICATION, 20182026 (TON)
TABLE 40 ETHYLENE CARBONATE MARKET SIZE, BY END-USE INDUSTRY, 20182026 (USD MILLION)
TABLE 41 ETHYLENE CARBONATE MARKET SIZE, BY END-USE INDUSTRY, 20182026 (TONS)
9.2 APAC
FIGURE 28 APAC: ETHYLENE CARBONATE MARKET SNAPSHOT
TABLE 42 APAC: ETHYLENE CARBONATE MARKET SIZE, BY COUNTRY, 20182026 (USD MILLION)
TABLE 43 APAC: ETHYLENE CARBONATE MARKET SIZE, BY COUNTRY, 20182026 (TON)
TABLE 44 APAC: ETHYLENE CARBONATE MARKET SIZE, BY APPLICATION, 20182026 (USD MILLION)
TABLE 45 APAC: ETHYLENE CARBONATE MARKET SIZE, BY APPLICATION, 20182026 (TON)
TABLE 46 APAC: ETHYLENE CARBONATE MARKET SIZE, BY END-USE INDUSTRY, 20182026 (USD MILLION)
TABLE 47 APAC: ETHYLENE CARBONATE MARKET SIZE, BY END-USE INDUSTRY, 20182026 (TONS)
9.2.1 CHINA
9.2.1.1 High demand for electric vehicles to drive the market
9.2.1.2 Impact of COVID-19 on China
TABLE 48 CHINA: ETHYLENE CARBONATE MARKET SIZE, BY APPLICATION, 20182026 (USD MILLION)
TABLE 49 CHINA: ETHYLENE CARBONATE MARKET SIZE, BY APPLICATION, 20182026 (TON)
9.2.2 JAPAN
9.2.2.1 Rising demand for lithium-ion batteries to drive the market
9.2.2.2 Impact of COVID-19 on Japan
TABLE 50 JAPAN: ETHYLENE CARBONATE MARKET SIZE, BY APPLICATION, 20182026 (USD MILLION)
TABLE 51 JAPAN: ETHYLENE CARBONATE MARKET SIZE, BY APPLICATION, 20182026 (TON)
9.2.3 SOUTH KOREA
9.2.3.1 Demand from the automotive industry to drive the market
TABLE 52 SOUTH KOREA: ETHYLENE CARBONATE MARKET SIZE, BY APPLICATION, 20182026 (USD MILLION)
TABLE 53 SOUTH KOREA: ETHYLENE CARBONATE MARKET SIZE, BY APPLICATION, 20182026 (TON)
9.2.4 TAIWAN
9.2.4.1 Increasing export of ethylene carbonate to drive the market
TABLE 54 TAIWAN: ETHYLENE CARBONATE MARKET SIZE, BY APPLICATION, 20182026 (USD MILLION)
TABLE 55 TAIWAN: ETHYLENE CARBONATE MARKET SIZE, BY APPLICATION, 20182026 (TON)
9.2.5 REST OF APAC
TABLE 56 REST OF APAC: ETHYLENE CARBONATE MARKET SIZE, BY APPLICATION, 20182026 (USD MILLION)
TABLE 57 REST OF APAC: ETHYLENE CARBONATE MARKET SIZE, BY APPLICATION, 20182026 (TON)
9.3 NORTH AMERICA
FIGURE 29 NORTH AMERICA: ETHYLENE CARBONATE MARKET SNAPSHOT
TABLE 58 NORTH AMERICA: ETHYLENE CARBONATE MARKET SIZE, BY COUNTRY, 20182026 (USD MILLION)
TABLE 59 NORTH AMERICA: ETHYLENE CARBONATE MARKET SIZE, BY COUNTRY, 20182026 (TON)
TABLE 60 NORTH AMERICA: ETHYLENE CARBONATE MARKET SIZE, BY APPLICATION, 20182026 (USD MILLION)
TABLE 61 NORTH AMERICA: ETHYLENE CARBONATE MARKET SIZE, BY APPLICATION, 20182026 (TON)
TABLE 62 NORTH AMERICA: ETHYLENE CARBONATE MARKET SIZE, BY END-USE INDUSTRY, 20182026 (USD MILLION)
TABLE 63 NORTH AMERICA: ETHYLENE CARBONATE MARKET SIZE, BY END-USE INDUSTRY, 20182026 (TONS)
9.3.1 US
9.3.1.1 Increase in production of battery electrolyte to drive the market
9.3.1.2 Impact of COVID-19 on US
TABLE 64 US: ETHYLENE CARBONATE MARKET SIZE, BY APPLICATION, 20182026 (USD MILLION)
TABLE 65 US: ETHYLENE CARBONATE MARKET SIZE, BY APPLICATION, 20182026 (TON)
9.3.2 CANADA
9.3.2.1 Economic expansions to drive the market
TABLE 66 CANADA: ETHYLENE CARBONATE MARKET SIZE, BY APPLICATION, 20182026 (USD MILLION)
TABLE 67 CANADA: ETHYLENE CARBONATE MARKET SIZE, BY APPLICATION, 20182026 (TON)
9.3.3 MEXICO
9.3.3.1 Growing automobile manufacturing facilities to drive the market
TABLE 68 MEXICO: ETHYLENE CARBONATE MARKET SIZE, BY APPLICATION, 20182026 (USD MILLION)
TABLE 69 MEXICO: ETHYLENE CARBONATE MARKET SIZE, BY APPLICATION, 20182026 (TON)
9.4 EUROPE
FIGURE 30 EUROPE: ETHYLENE CARBONATE MARKET SNAPSHOT
TABLE 70 EUROPE: ETHYLENE CARBONATE MARKET SIZE, BY COUNTRY, 20182026 (USD MILLION)
TABLE 71 EUROPE: ETHYLENE CARBONATE MARKET SIZE, BY COUNTRY, 20182026 (TON)
TABLE 72 EUROPE: ETHYLENE CARBONATE MARKET SIZE, BY APPLICATION, 20182026 (USD MILLION)
TABLE 73 EUROPE: ETHYLENE CARBONATE MARKET SIZE, BY APPLICATION, 20182026 (TON)
TABLE 74 EUROPE: ETHYLENE CARBONATE MARKET SIZE, BY END-USE INDUSTRY, 20182026 (USD MILLION)
TABLE 75 EUROPE: ETHYLENE CARBONATE MARKET SIZE, BY END-USE INDUSTRY, 20182026 (TON)
9.4.1 GERMANY
9.4.1.1 Increased investments in electric vehicles to drive the market
9.4.1.2 COVID-19 impact on Germany
TABLE 76 GERMANY: ETHYLENE CARBONATE MARKET SIZE, BY APPLICATION, 20182026 (USD MILLION)
TABLE 77 GERMANY: ETHYLENE CARBONATE MARKET SIZE, BY APPLICATION, 20182026 (TON)
9.4.2 UK
9.4.2.1 Growing demand for lithium battery electrolyte and lubricant applications to drive the market
9.4.2.2 COVID-19 impact on UK
TABLE 78 UK: ETHYLENE CARBONATE MARKET SIZE, BY APPLICATION, 20182026 (USD MILLION)
TABLE 79 UK: ETHYLENE CARBONATE MARKET SIZE, BY APPLICATION, 20182026 (TON)
9.4.3 FRANCE
9.4.3.1 Demand from chemical industry to drive the market
TABLE 80 FRANCE: ETHYLENE CARBONATE MARKET SIZE, BY APPLICATION, 20182026 (USD MILLION)
TABLE 81 FRANCE: ETHYLENE CARBONATE MARKET SIZE, BY APPLICATION, 20182026 (TON)
9.4.4 ITALY
9.4.4.1 Increased investments in the chemical industry to drive the market
TABLE 82 ITALY: ETHYLENE CARBONATE MARKET SIZE, BY APPLICATION, 20182026 (USD MILLION)
TABLE 83 ITALY: ETHYLENE CARBONATE MARKET SIZE, BY APPLICATION, 20182026 (TON)
9.4.5 TURKEY
9.4.5.1 Growth in the automotive industry to drive the market
TABLE 84 TURKEY: ETHYLENE CARBONATE MARKET SIZE, BY APPLICATION, 20182026 (USD MILLION)
TABLE 85 TURKEY: ETHYLENE CARBONATE MARKET SIZE, BY APPLICATION, 20182026 (TON)
9.4.6 RUSSIA
9.4.6.1 Demand from oil & gas and automotive industries to drive the market
TABLE 86 RUSSIA: ETHYLENE CARBONATE MARKET SIZE, BY APPLICATION, 20182026 (USD MILLION)
TABLE 87 RUSSIA: ETHYLENE CARBONATE MARKET SIZE, BY APPLICATION, 20182026 (TON)
9.4.7 REST OF EUROPE
TABLE 88 REST OF EUROPE: ETHYLENE CARBONATE MARKET SIZE, BY APPLICATION, 20182026 (USD MILLION)
TABLE 89 REST OF EUROPE: ETHYLENE CARBONATE MARKET SIZE, BY APPLICATION, 20182026 (TON)
9.5 MIDDLE EAST & AFRICA
TABLE 90 MIDDLE EAST & AFRICA: ETHYLENE CARBONATE MARKET SIZE, BY COUNTRY, 20182026 (USD MILLION)
TABLE 91 MIDDLE EAST & AFRICA: ETHYLENE CARBONATE MARKET SIZE, BY COUNTRY, 20182026 (TON)
TABLE 92 MIDDLE EAST & AFRICA: ETHYLENE CARBONATE MARKET SIZE, BY APPLICATION, 20182026 (USD MILLION)
TABLE 93 MIDDLE EAST & AFRICA: ETHYLENE CARBONATE MARKET SIZE, BY APPLICATION, 20182026 (TON)
TABLE 94 MIDDLE EAST & AFRICA: ETHYLENE CARBONATE MARKET SIZE, BY END-USE INDUSTRY, 20182026 (USD MILLION)
TABLE 95 MIDDLE EAST & AFRICA: ETHYLENE CARBONATE MARKET SIZE, BY END-USE INDUSTRY, 20182026 (TON)
9.5.1 UAE
9.5.1.1 Increasing applications in automotive industry to drive the market
TABLE 96 UAE: ETHYLENE CARBONATE MARKET SIZE, BY APPLICATION, 20182026 (USD MILLION)
TABLE 97 UAE: ETHYLENE CARBONATE MARKET SIZE, BY APPLICATION, 20182026 (TON)
9.5.2 SAUDI ARABIA
9.5.2.1 Rising chemical exports expected to drive the market
TABLE 98 SAUDI ARABIA: ETHYLENE CARBONATE MARKET SIZE, BY APPLICATION, 20182026 (USD MILLION)
TABLE 99 SAUDI ARABIA: ETHYLENE CARBONATE MARKET SIZE, BY APPLICATION, 20182026 (TON)
9.5.3 SOUTH AFRICA
9.5.3.1 Demand from medical industry to drive the market
TABLE 100 SOUTH AFRICA: ETHYLENE CARBONATE MARKET SIZE, BY APPLICATION, 20182026 (USD MILLION)
TABLE 101 SOUTH AFRICA: ETHYLENE CARBONATE MARKET SIZE, BY APPLICATION, 20182026 (TON)
9.5.4 REST OF MIDDLE EAST & AFRICA
TABLE 102 REST OF MIDDLE EAST & AFRICA: ETHYLENE CARBONATE MARKET SIZE, BY APPLICATION, 20182026 (USD MILLION)
TABLE 103 REST OF MIDDLE EAST & AFRICA: ETHYLENE CARBONATE MARKET SIZE, BY APPLICATION, 20182026 (TON)
9.6 SOUTH AMERICA
TABLE 104 SOUTH AMERICA: ETHYLENE CARBONATE MARKET SIZE, BY COUNTRY, 20182026 (USD MILLION)
TABLE 105 SOUTH AMERICA: ETHYLENE CARBONATE MARKET SIZE, BY COUNTRY, 20182026 (TON)
TABLE 106 SOUTH AMERICA: ETHYLENE CARBONATE MARKET SIZE, BY APPLICATION, 20182026 (USD MILLION)
TABLE 107 SOUTH AMERICA: ETHYLENE CARBONATE MARKET SIZE, BY APPLICATION, 20182026 (TON)
TABLE 108 SOUTH AMERICA: ETHYLENE CARBONATE MARKET SIZE, BY END-USE INDUSTRY, 20182026 (USD MILLION)
TABLE 109 SOUTH AMERICA: ETHYLENE CARBONATE MARKET SIZE, BY END-USE INDUSTRY, 20182026 (TON)
9.6.1 BRAZIL
9.6.1.1 Automotive industry to drive the market
TABLE 110 BRAZIL: ETHYLENE CARBONATE MARKET SIZE, BY APPLICATION, 20182026 (USD MILLION)
TABLE 111 BRAZIL: ETHYLENE CARBONATE MARKET SIZE, BY APPLICATION, 20182026 (TON)
9.6.2 ARGENTINA
9.6.2.1 Manufacturing industry to drive the market
TABLE 112 ARGENTINA: ETHYLENE CARBONATE MARKET SIZE, BY APPLICATION, 20182026 (USD MILLION)
TABLE 113 ARGENTINA: ETHYLENE CARBONATE MARKET SIZE, BY APPLICATION, 20182026 (TON)
9.6.3 REST OF SOUTH AMERICA
TABLE 114 REST OF SOUTH AMERICA: ETHYLENE CARBONATE MARKET SIZE, BY APPLICATION, 20182026 (USD MILLION)
TABLE 115 REST OF SOUTH AMERICA: ETHYLENE CARBONATE MARKET SIZE, BY APPLICATION, 20182026 (TON)
10 COMPETITIVE LANDSCAPE (Page No. - 127)
10.1 OVERVIEW
FIGURE 31 COMPANIES ADOPTED ORGANIC & INORGANIC GROWTH STRATEGIES BETWEEN JANUARY 2016 & DECEMBER 2020
10.2 MARKET SHARE ANALYSIS/MARKET RANKING OF KEY PLAYERS
FIGURE 32 RANKING OF ETHYLENE CARBONATE MANUFACTURERS IN 2019
10.2.1 MARKET SHARE ANALYSIS OF KEY PLAYERS
TABLE 116 ETHYLENE CARBONATE: DEGREE OF COMPETITION
10.2.2 REVENUE ANALYSIS OF SOME LEADING COMPANIES IN ETHYLENE CARBONATE MARKET, 20152019
10.3 KEY MARKET DEVELOPMENTS
TABLE 117 ETHYLENE CARBONATE: DEALS, JANUARY 2017 - JANUARY 2021
TABLE 118 ETHYLENE CARBONATE: OTHERS, JANUARY 2017 - JANUARY 2021
10.4 COMPANY EVALUATION QUADRANT MATRIX DEFINITIONS AND METHODOLOGY, 2020
10.4.1 STARS
10.4.2 EMERGING LEADERS
10.4.3 PERVASIVE
10.4.4 PARTICIPANTS
FIGURE 33 ETHYLENE CARBONATE MARKET: COMPETITIVE LANDSCAPE MAPPING, 2020
10.5 COMPETITIVE BENCHMARKING
10.5.1 STRENGTH OF PRODUCT PORTFOLIOS
10.5.2 BUSINESS STRATEGY EXCELLENCE
TABLE 119 COMPANY PRODUCT FOOTPRINT
TABLE 120 COMPANY APPLICATION FOOTPRINT
TABLE 121 COMPANY END-USE INDUSTRY FOOTPRINT
TABLE 122 COMPANY REGION FOOTPRINT
10.6 SME MATRIX, 2020
10.6.1 PROGRESSIVE COMPANIES
10.6.2 STARTING BLOCKS
10.6.3 DYNAMIC COMPANIES
10.6.4 RESPONSIVE COMPANIES
FIGURE 34 ETHYLENE CARBONATE MARKET: SME COMPETITIVE LEADERSHIP MAPPING, 2020
11 COMPANY PROFILES (Page No. - 138)
11.1 KEY PLAYERS
(Business Overview, Products Offered, Winning imperatives, Current focus and strategies, Threat from competition, Right to win)*
11.1.1 ORIENTAL UNION CHEMICAL CORPORATION
FIGURE 35 ORIENTAL UNION CHEMICAL CORPORATION: COMPANY SNAPSHOT
11.1.2 BASF SE
FIGURE 36 BASF SE: COMPANY SNAPSHOT
11.1.3 MITSUBISHI CHEMICAL HOLDINGS
FIGURE 37 MITSUBISHI CHEMICAL HOLDINGS: COMPANY SNAPSHOT
11.1.4 HUNTSMAN CORPORATION
FIGURE 38 HUNTSMAN CORPORATION: COMPANY SNAPSHOT
11.1.5 TOAGOSEI
FIGURE 39 TOAGOSEI: COMPANY SNAPSHOT
11.1.6 ASAHI KASEI
FIGURE 40 ASAHI KASEI: COMPANY SNAPSHOT
11.1.7 NEW JAPAN CHEMICAL CO. LTD.
FIGURE 41 NEW JAPAN CHEMICAL: COMPANY SNAPSHOT
11.1.8 ZIBO DONGHAI INDUSTRIES CO. LTD.
TABLE 123 ZIBO DONGHAI INDUSTRIES CO. LTD.: BUSINESS OVERVIEW
11.1.9 SHANDONG SHIDA SHENGHUA CHEMICAL GROUP
TABLE 124 SHANDONG SHIDA SHENGHUA CHEMICAL GROUP: BUSINESS OVERVIEW
11.1.10 SHANDONG SENJEI CLEANTECH CO. LTD
TABLE 125 SHANDONG SENJIE CLEANTECH CO. LTD: BUSINESS OVERVIEW
11.2 ADDITIONAL COMPANIES
11.2.1 ALCHEM CHEMICAL COMPANY
11.2.2 PANAX ETEC
11.2.3 ALFA AESAR
11.2.4 SHANDONG LIXING CHEMICALS CO. LTD.
11.2.5 TOKYO CHEMICAL INDUSTRY
11.2.6 EMPOWER MATERIALS
11.2.7 LIAONING OXIRANCHEM INC.
11.2.8 TAIXING TAIDA FINE CHEMICAL CO. LTD
11.2.9 PARSOL CHEMICALS PVT. LTD
11.2.10 ZHENGZHOU MEIYA CHEMICAL PRODUCTS CO. LTD.
11.2.11 OTTO CHEMIE PVT. LTD.
11.2.12 VIZAG CHEMICAL INTERNATIONAL
11.2.13 FUJIFILM WAKO PURE CHEMICAL CORPORATION
11.2.14 RX MARINE INTERNATIONAL
*Details on Business Overview, Products Offered, Winning imperatives, Current focus and strategies, Threat from competition, Right to win might not be captured in case of unlisted companies.
12 APPENDIX (Page No. - 159)
12.1 DISCUSSION GUIDE
12.2 KNOWLEDGE STORE: MARKETSANDMARKETS SUBSCRIPTION PORTAL
12.3 AVAILABLE CUSTOMIZATIONS
12.4 RELATED REPORTS
12.5 AUTHOR DETAILS
The study involved four major activities in estimating the current size of the ethylene carbonate market. Exhaustive secondary research was done to collect information on the market, peer market, and parent market. The next step was to validate these findings, assumptions, and sizing with industry experts across the value chain through primary research. Both top-down and bottom-up approaches were employed to estimate the total market size. After that, market breakdown and data triangulation were used to estimate the market size of segments and subsegments.
In the secondary research process, various secondary sources such as Hoovers, Bloomberg Businessweek, Factiva, World Bank, and Industry Journals have been referred to, to identify and collect information for this study. These secondary sources included annual reports, press releases & investor presentations of companies; white papers; certified publications; articles by recognized authors; and databases.
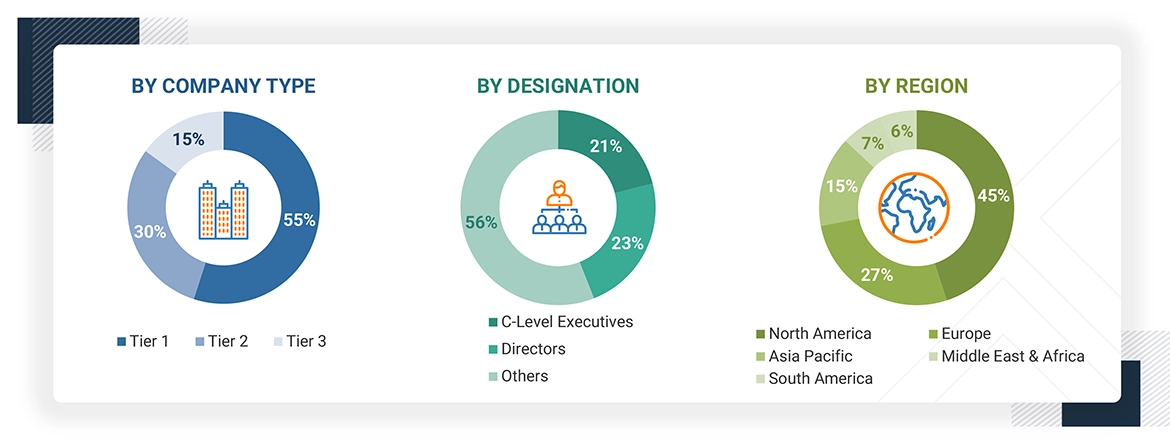
The ethylene carbonate market comprises several stakeholders, such as raw material suppliers, end-product manufacturers, and regulatory organizations in the supply chain. Developments in the ethylene carbonate industry characterize the demand side. The supply side is characterized by market consolidation activities undertaken by the manufacturers. Various primary sources from both the supply and demand sides of the market were interviewed to obtain qualitative and quantitative information. Following is the breakdown of primary respondents:
To know about the assumptions considered for the study, download the pdf brochure
Both top-down and bottom-up approaches were used to estimate and validate the total size of the ethylene carbonate market. These methods were also used extensively to determine the size of various subsegments in the market. The research methodology used to estimate the market size includes the following:
After arriving at the overall market size-using the market size estimation processes as explained above-the market was split into several segments and subsegments. To complete the overall market engineering process and arrive at the exact statistics of each market segment and subsegment, the data triangulation, and market breakdown procedures were employed, wherever applicable. The data was triangulated by studying various factors and trends from both the demand and supply sides in the Ethylene carbonate market.
With the given market data, MarketsandMarkets offers customizations according to the specific needs of the companies.
The following customization options are available for the report:
Product Analysis
Regional Analysis
Company Information
Benchmarking the rapid strategy shifts of the Top 100 companies in the Ethylene Carbonate Market
Request For Special Pricing
Growth opportunities and latent adjacency in Ethylene Carbonate Market