Global Ethylene Oxide and Ethylene Glycol Market

Global Ethylene Oxide and Ethylene Glycol Market by Applications, by Geography, Raw Materials, Price Trends and Forecasts (2011-2016)

Report Code: CH 1613 Dec, 2011, by marketsandmarkets.com

[248 Pages Report] Ethylene oxide and ethylene glycol are bulk chemicals that are experiencing strong market growth. Much of this growth is due to a strong demand in the downstream applications of ethylene oxide and ethylene glycol. Ethylene oxide is witnessing strong surge in demand in its end-user applications especially in ethylene glycol and ethoxylates whereas ethylene glycol’s end-user applications witnessing significant growth are polyester fibers and PET resin that are growing strongly in most parts of the world.

This study estimates the global market of ethylene oxide and ethylene glycol by the end of 2016. Asia-Pacific is the most dominant market for both ethylene oxide and ethylene glycol owing to significant domestic demand and is expected to be the fastest growing market in the next five years. With the huge market potential and growing demand, the market is likely to witness considerable growth. The growth in the ethylene glycol market is also being fuelled by the strong demand of PET fibers in the Asia-Pacific region where it is extensively used in the textile industry. Another factor driving MEG growth is the strong global demand for PET bottle resin that is used in the food and beverages industry owing to its advantages over glass used in carbonated drinks, water bottles, and food containers.

The market is anticipated to continue penetrating the key applications such as polyester fibers and PET resin. The growth of the market is also largely attributed to the significant demand from the Asia-Pacific region, especially China that has a huge textile and fibers industry. The polyester fibers and PET resin applications of ethylene glycol are growing strongly at present.

This market research study provides detailed qualitative and quantitative analysis of the global ethylene oxide and ethylene glycol market. The report provides a comprehensive review of major market drivers, restraints, opportunities, winning imperatives, challenges, and key issues in the market. The market is further segmented and forecasted for major geographic regions, North America, Europe, Asia-Pacific, and Rest of the World that include key growth regions such as China and India. Major countries with the market volumes and revenues are covered for each of the region. Competitive scenario and market share of the top players in the market has been discussed in detail. The top players of the industry are profiled in detail with their recent developments and other strategic industry activities. Major research and development activities have studied in detail in the patent analysis section.

Market has been further segmented on the basis of applications. The major applications for ethylene oxide including ethylene glycol, ethoxylates, ethanolamines, and glycol ethers have been discussed in detail in the report. Market share for major market participants has been calculated on the basis of announced production capacities and is described in detail for both ethylene oxide and ethylene glycol. The global existing production capacities and proposed production capacities with the top suppliers have been provided in detail in the report.

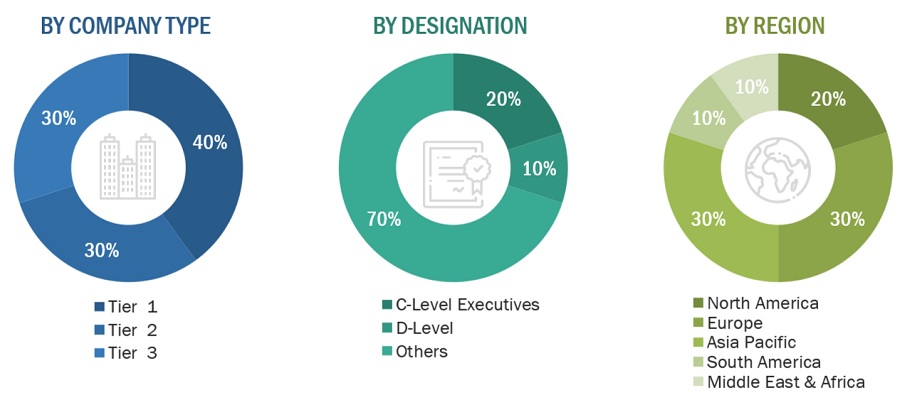
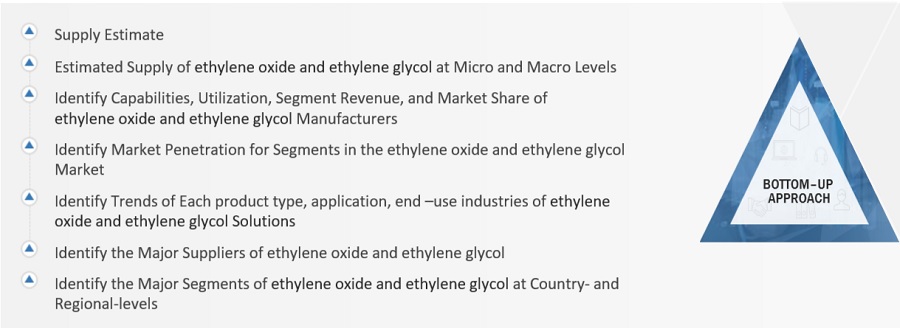
We have used various secondary sources such as encyclopedia, directories, and databases to identify and collect information useful for this extensive commercial study of EO and EG. The primary sources – selected experts from related industries and selected suppliers have been interviewed to obtain and verify critical information as well as to assess the future prospects. We have also profiled leading players of this industry with their recent developments, financial performance, and other strategic industry activities. Key participants in the global ethylene oxide and ethylene glycol market include The Dow Chemical (U.S.), SABIC (Saudi Arabia), Shell Group (The Netherlands), Formosa Plastics Group (Taiwan), Huntsman Corporation (U.S.), BASF (Germany), Sinopec (China), and Reliance Industries Ltd. (India).

Get online access to the report on the World's First Market Intelligence Cloud

  • Easy to Download Historical Data & Forecast Numbers
  • Company Analysis Dashboard for high growth potential opportunities
  • Research Analyst Access for customization & queries
  • Competitor Analysis with Interactive dashboard
  • Latest News, Updates & Trend analysis
Request Sample

Scope of the Report

This research report categorizes the Global Market for ethylene oxide and ethylene glycol on the basis of applications, raw materials and geography; forecasting volumes and revenues and analyzing trends in each of the submarkets:

On the basis of applications: The EO market is segmented on the basis of applications as ethylene glycol, ethoxylates, ethanolamines, glycol ethers and other applications. ethylene glycol application is further segmented on the basis of its applications such as polyester fibers, PET resin, automotive antifreeze, and others.

On the basis of raw materials: Ethylene with its market share by applications, ethylene bulk prices, global demand for ethylene and so on.

On the basis of geography: North America, Europe, Asia-Pacific, and ROW and key countries in every region.

Ethylene oxide is a bulk industrial chemical, used for a wide range of applications including many consumer products and non-consumer chemicals and intermediates. Ethylene oxide is primarily used to make other chemicals such as ethylene glycol, surface active agents, ethanolamines, glycol ethers, polyols etc. The derivatives of ethylene oxide, especially ethylene glycol are widely used to produce polyester fibers for clothing and furniture, for the production of bottles in the plastics industry, automotive coolants, detergents and surfactants, etc. The largest application for ethylene oxide is ethylene glycol, accounting for over 72% of the ethylene oxide demand globally.

The global market for ethylene oxide in terms of revenue was estimated to be worth $27,430.0 million in 2010 and is expected to reach $39,865.3 million by 2016, growing at a CAGR of 6.0% from 2011 to 2016. Asia-Pacific and North America dominate the global ethylene oxide market, together accounting for 64.1% of the global ethylene oxide demand in 2010. North America and Western Europe are mature markets and are expected to grow at a sluggish rate. However, Asia-Pacific, Eastern and Central Europe, Middle East and South America are expected to drive the demand for ethylene oxide in the coming decade as end-use applications such as polyester fibers and PET resin are still developing and expecting robust growth.

The global market for ethylene glycol in terms of revenue was estimated to be worth $23,620.3 million in 2010 and is expected to reach $37,524.8 million by 2016, growing at a CAGR of 7.7% from 2011 to 2016. Monoethylene glycol (MEG) is the most important of the commercially available ethylene glycols and accounts for over 90% of the overall ethylene glycol production.


Ethylene Glycol Market Share, by Geography, 2010

Ethylene Glycol Market, Ethylene Glycol Market

Source: ICIS, Shell, RIL, Chemical Week Magazine, Primary Interviews, MarketsandMarkets

Asia-Pacific dominates the global ethylene glycol market, accounting for 65.3% of the overall consumption in 2010. North America and Europe are the second and third largest EG consuming regions, accounting for 14.8% and 12.8% of the overall market in 2010. North America and Europe are mature markets having stagnant polyester fibers demand. Growth in these markets is expected to be driven by the growing PET bottle resin market and automotive antifreeze market.

Polyester fibers and PET resin are the dominant applications for ethylene glycol market, together accounting for 83.6% of the overall ethylene glycol demand in 2010. Monoethylene glycol (MEG) is the most widely produced ethylene glycol. Diethylene glycol (DEG) and triethylene glycol (TEG) are produced as byproducts in the manufacture of MEG.

Asia-Pacific is expected to be the fastest growing market for ethylene glycol, owing to huge demand for polyester fibers in China and India. The demand for ethylene glycol by volume in Asia-Pacific is expected to grow at a CAGR of 6.3% from 2011 to 2016.

Key participants in the global ethylene oxide and ethylene glycol market include The Dow Chemical (U.S.), SABIC (Saudi Arabia), Shell Group (The Netherlands), Huntsman Corporation (U.S.), BASF (Germany), Sinopec (China), and Reliance Industries Ltd. (India).

TABLE OF CONTENTS

1 INTRODUCTION  
  1.1 KEY TAKE-AWAYS  
  1.2 REPORT DESCRIPTION  
  1.3 RESEARCH METHODOLOGY  
    1.3.1 MARKET SIZE  
    1.3.2 KEY DATA POINTS FROM SECONDARY SOURCES  
    1.3.3 KEY DATA POINTS FROM PRIMARY SOURCES  
    1.3.4 ASSUMPTIONS MADE FOR THIS REPORT  
    1.3.5 LIST OF MAJOR COMPANIES COVERED DURING PRIMARIES  
    1.3.6 LIST OF SECONDARY SOURCES USED  
    1.3.7 STAKEHOLDERS  
  1.4 KEY QUESTIONS ANSWERED  
 
2 EXECUTIVE SUMMARY  
 
3 MARKET OVERVIEW  
  3.1 INTRODUCTION  
  3.2 VALUE CHAIN ANALYSIS  
    3.2.1 ETHOXYLATES  
    3.2.2 ETHANOLAMINES  
    3.2.3 GLYCOL ETHERS  
  3.3 BURNING ISSUES  
    3.3.1 OVERCAPACITY IN THE ETHYLENE GLYCOL MARKET  
  3.4 WINNING IMPERATIVE  
    3.4.1 FOCUS ON AGREEMENTS, COLLABORATIONS & GEOGRAPHIC EXPANSION  
  3.5 MARKET DYNAMICS  
    3.5.1 DRIVERS  
      3.5.1.1 Strong demand for polyester fibers and PET resin  
      3.5.1.2 Growing demand for antifreeze  
    3.5.2 RESTRAINTS  
      3.5.2.1 Rising crude oil prices  
      3.5.2.2 Regulatory scenario  
    3.5.3 OPPORTUNITIES  
      3.5.3.1 Growing Asia-Pacific market  
      3.5.3.2 Growing non-ionic surfactant demand  
  3.6 RAW MATERIAL ANALYSIS  
    3.6.1 ETHYLENE GLYCOL PRODUCTION FROM MOLASSES  
  3.7 PORTER’S FIVE FORCES ANALYSIS  
    3.7.1 DEGREE OF COMPETITION  
    3.7.2 BUYER POWER  
    3.7.3 THREAT OF NEW ENTRANTS  
    3.7.4 THREAT OF SUBSTITUTES  
    3.7.5 SUPPLIER POWER  
  3.8 MARKET SHARE ANALYSIS  
  3.9 PATENT ANALYSIS  
 
4 ETHYLENE OXIDE MARKET  
  4.1 INTRODUCTION  
  4.2 GLOBAL ETHYLENE OXIDE MARKET  
  4.3 GLOBAL ETHYLENE OXIDE MARKET, BY APPLICATIONS  
    4.3.1 ETHYLENE GLYCOL  
    4.3.2 ETHOXYLATES  
      4.3.2.1 Surfactants  
        4.3.2.1.1 Linear Alkylbenzene (LAB) Overview  
    4.3.3 ETHANOLAMINES  
    4.3.4 GLYCOL ETHERS  
    4.3.5 OTHERS  
  4.4 ETHYLENE OXIDE MARKET, BY GEOGRAPHY  
    4.4.1 NORTH AMERICA  
      4.4.1.1 U.S.  
    4.4.2 EUROPE  
      4.4.2.1 Germany  
      4.4.2.2 U.K.  
      4.4.2.3 France  
    4.4.3 ASIA-PACIFIC  
      4.4.3.1 China  
      4.4.3.2 Japan  
      4.4.3.3 India  
    4.4.4 REST OF THE WORLD (ROW)  
      4.4.4.1 Brazil  
 
5 ETHYLENE GLYCOL MARKET  
  5.1 INTRODUCTION  
  5.2 MARKET OVERVIEW  
  5.3 GLOBAL ETHYLENE GLYCOL MARKET, BY APPLICATIONS  
    5.3.1 POLYESTER FIBERS  
    5.3.2 PET RESIN  
    5.3.3 AUTOMOTIVE ANTIFREEZE  
    5.3.4 OTHERS  
  5.4 ETHYLENE GLYCOL MARKET, BY GEOGRAPHY  
    5.4.1 NORTH AMERICA  
      5.4.1.1 U.S.  
    5.4.2 EUROPE  
      5.4.2.1 Germany  
      5.4.2.2 U.K.  
      5.4.2.3 France  
    5.4.3 ASIA-PACIFIC  
      5.4.3.1 China  
      5.4.3.2 Japan  
      5.4.3.3 India  
    5.4.4 REST OF THE WORLD (ROW)  
      5.4.4.1 Brazil  
 
6 COMPETITIVE LANDSCAPE  
  6.1 INTRODUCTION  
 
7 COMPANY PROFILES  
  7.1 AKZONOBEL N.V.  
    7.1.1 OVERVIEW  
    7.1.2 FINANCIALS  
    7.1.3 PRODUCTS & SERVICES  
    7.1.4 STRATEGY  
    7.1.5 DEVELOPMENTS  
  7.2 BASF SE  
    7.2.1 OVERVIEW  
    7.2.2 FINANCIALS  
    7.2.3 PRODUCTS & SERVICES  
    7.2.4 STRATEGY  
    7.2.5 DEVELOPMENTS  
  7.3 CHINA PETROLEUM & CHEMICAL CORPORATION (SINOPEC)  
    7.3.1 OVERVIEW  
    7.3.2 FINANCIALS  
    7.3.3 PRODUCTS & SERVICES  
    7.3.4 STRATEGY  
    7.3.5 DEVELOPMENTS  
  7.4 CLARIANT AG  
    7.4.1 OVERVIEW  
    7.4.2 FINANCIALS  
    7.4.3 PRODUCTS & SERVICES  
    7.4.4 STRATEGY  
    7.4.5 DEVELOPMENTS  
  7.5 EXXON MOBIL CORPORATION  
    7.5.1 OVERVIEW  
    7.5.2 FINANCIALS  
    7.5.3 PRODUCTS & SERVICES  
    7.5.4 STRATEGY  
    7.5.5 DEVELOPMENTS  
  7.6 FORMOSA PLASTICS GROUP  
    7.6.1 OVERVIEW  
    7.6.2 FINANCIALS  
    7.6.3 PRODUCTS & SERVICES  
    7.6.4 STRATEGY  
    7.6.5 DEVELOPMENTS  
  7.7 HONAM PETROCHEMICAL CORPORATION  
    7.7.1 OVERVIEW  
    7.7.2 FINANCIALS  
    7.7.3 PRODUCTS & SERVICES  
    7.7.4 STRATEGY  
    7.7.5 DEVELOPMENTS  
  7.8 HUNTSMAN CORPORATION  
    7.8.1 OVERVIEW  
    7.8.2 FINANCIALS  
    7.8.3 PRODUCTS & SERVICES  
    7.8.4 STRATEGY  
    7.8.5 DEVELOPMENTS  
  7.9 INEOS OXIDE  
    7.9.1 OVERVIEW  
    7.9.2 FINANCIALS  
    7.9.3 PRODUCTS & SERVICES  
    7.9.4 STRATEGY  
    7.9.5 DEVELOPMENTS  
  7.10 KUWAIT PETROLEUM CORPORATION  
    7.10.1 OVERVIEW  
    7.10.2 FINANCIALS  
    7.10.3 PRODUCTS & SERVICES  
    7.10.4 STRATEGY  
    7.10.5 DEVELOPMENTS  
  7.11 LYONDELLBASELL INDUSTRIES  
    7.11.1 OVERVIEW  
    7.11.2 FINANCIALS  
    7.11.3 PRODUCTS & SERVICES  
    7.11.4 STRATEGY  
    7.11.5 DEVELOPMENTS  
  7.12 RELIANCE INDUSTRIES LIMITED  
    7.12.1 OVERVIEW  
    7.12.2 FINANCIALS  
    7.12.3 PRODUCTS & SERVICES  
    7.12.4 STRATEGY  
    7.12.5 DEVELOPMENTS  
  7.13 ROYAL DUTCH SHELL PLC  
    7.13.1 OVERVIEW  
    7.13.2 FINANCIALS  
    7.13.3 PRODUCTS & SERVICES  
    7.13.4 STRATEGY  
    7.13.5 DEVELOPMENTS  
  7.14 SAUDI BASIC INDUSTRIES CORPORATION  
    7.14.1 OVERVIEW  
    7.14.2 FINANCIALS  
    7.14.3 PRODUCTS & SERVICES  
    7.14.4 STRATEGY  
    7.14.5 DEVELOPMENTS  
  7.15 SINOPEC SHANGHAI PETROCHEMICAL COMPANY LIMITED  
    7.15.1 OVERVIEW  
    7.15.2 FINANCIALS  
    7.15.3 PRODUCTS & SERVICES  
    7.15.4 STRATEGY  
    7.15.5 DEVELOPMENTS  
  7.16 THE DOW CHEMICAL COMPANY  
    7.16.1 OVERVIEW  
    7.16.2 FINANCIALS  
    7.16.3 PRODUCTS & SERVICES  
    7.16.4 STRATEGY  
    7.16.5 DEVELOPMENTS  
  7.17 ULTRAPAR PARTICIPACOES SA  
    7.17.1 OVERVIEW  
    7.17.2 FINANCIALS  
    7.17.3 PRODUCTS & SERVICES  
    7.17.4 STRATEGY  
    7.17.5 DEVELOPMENTS  
 
APPENDIX   
- U.S. PATENTS  
- EUROPE PATENTS  
- JAPAN PATENTS  


LIST OF TABLES   
    
TABLE 1 GLOBAL ETHYLENE OXIDE MARKET VOLUME (KILO TONS) & REVENUE, 2009 – 2016 ($MILLION)  
TABLE 2 GLOBAL ETHYLENE GLYCOL MARKET VOLUME (KILO TONS) & REVENUE ($MILLION), 2009 – 2016  
TABLE 3 CRUDE OIL PRICES, 2009 – 2016 ($/BARREL)  
TABLE 4 ETHYLENE BULK PRICES, 2009 – 2016 ($/TON)  
TABLE 5 NORTH AMERICA: ETHYLENE OXIDE MAJOR CAPACITY, 2010 (KILO TONS/YEAR)   
TABLE 6 NORTH AMERICA: ETHYLENE GLYCOL MAJOR CAPACITY, 2010 (KILO TONS/YEAR)   
TABLE 7 EUROPE: ETHYLENE OXIDE MAJOR CAPACITY, 2010 (KILO TONS/YEAR)  
TABLE 8 EUROPE: ETHYLENE GLYCOL MAJOR CAPACITY, 2010 (KILO TONS/YEAR)  
TABLE 9 ASIA-PACIFIC: ETHYLENE OXIDE MAJOR CAPACITY, 2010 (KILO TONS/YEAR)   
TABLE 10 ASIA-PACIFIC: ETHYLENE GLYCOL MAJOR CAPACITY, 2010 (KILO TONS/YEAR)   
TABLE 11 GLOBAL EO/EG MAJOR PROPOSED CAPACITY, 2012 – 2015 (KILO TONS/YEAR)   
TABLE 12 GLOBAL ETHYLENE OXIDE MARKET VOLUME (KILO TONS) & REVENUE ($MILLION), 2009 – 2016  
TABLE 13 ETHYLENE OXIDE BULK PRICES, 2009 – 2016 ($/TON)  
TABLE 14 ETHYLENE OXIDE MARKET FOR ETHYLENE GLYCOL APPLICATION, BY VOLUME (KILO TONS) & REVENUE ($MILLION), 2009 – 2016   
TABLE 15 ETHYLENE OXIDE MARKET FOR ETHOXYLATES APPLICATION, BY VOLUME (KILO TONS) & BY REVENUE ($MILLION), 2009 – 2016   
TABLE 16 GLOBAL SURFACTANTS MARKET REVENUE, BY GEOGRAPHY, 2009 – 2016 ($MILLION)   
TABLE 17 GLOBAL SURFACTANTS MARKET REVENUE, BY APPLICATIONS, 2009 – 2016 ($MILLION)   
TABLE 18 LAB MAJOR PRODUCTION CAPACITY, 2010 (KILO TONS/YEAR)  
TABLE 19 ETHYLENE OXIDE MARKET FOR ETHANOLAMINES APPLICATION, BY VOLUME (KILO TONS) & BY REVENUE ($MILLION), 2009 – 2016   
TABLE 20 ETHYLENE OXIDE MARKET FOR GLYCOL ETHERS, BY VOLUME (KILO TONS) & BY REVENUE ($MILLION), 2009 – 2016   
TABLE 21 ETHYLENE OXIDE MARKET FOR OTHER APPLICATIONS, BY VOLUME (KILO TONS) & BY REVENUE ($MILLION), 2009 – 2016  
TABLE 22 NORTH AMERICA: ETHYLENE OXIDE MARKET, BY VOLUME (KILO TONS) & BY REVENUE ($MILLION), 2009 – 2016  
TABLE 23 U.S: ETHYLENE OXIDE MARKET VOLUME, BY APPLICATIONS, 2009 – 2016 (KILO TONS)   
TABLE 24 U.S: ETHYLENE OXIDE MARKET REVENUE, BY APPLICATIONS, 2009 – 2016 ($MILLION)   
TABLE 25 EUROPE: ETHYLENE OXIDE MARKET, BY VOLUME (KILO TONS) & BY REVENUE ($MILLION), 2009 – 2016   
TABLE 26 GERMANY: ETHYLENE OXIDE MARKET VOLUME, BY APPLICATIONS, 2009 – 2016 (KILO TONS)  
TABLE 27 GERMANY: ETHYLENE OXIDE MARKET REVENUE, BY APPLICATIONS, 2009 – 2016 ($MILLION)  
TABLE 28 U.K: ETHYLENE OXIDE MARKET VOLUME, BY APPLICATIONS, 2009 – 2016 (KILO TONS)   
TABLE 29 U.K: ETHYLENE OXIDE MARKET REVENUE, BY APPLICATIONS, 2009 – 2016 ($MILLION)   
TABLE 30 FRANCE: ETHYLENE OXIDE MARKET VOLUME, BY APPLICATIONS, 2009 – 2016 (KILO TONS)   
TABLE 31 FRANCE: ETHYLENE OXIDE MARKET REVENUE, BY APPLICATIONS, 2009 – 2016 ($MILLION)   
TABLE 32 ASIA-PACIFIC: ETHYLENE OXIDE MARKET, BY VOLUME (KILO TONS) & BY REVENUE ($MILLION), 2009 – 2016  
TABLE 33 CHINA: ETHYLENE OXIDE MARKET VOLUME, BY APPLICATIONS, 2009 – 2016 (KILO TONS)   
TABLE 34 CHINA: ETHYLENE OXIDE MARKET REVENUE, BY APPLICATIONS, 2009 – 2016 ($MILLION)   
TABLE 35 JAPAN: ETHYLENE OXIDE MARKET VOLUME, BY APPLICATIONS, 2009 – 2016 (KILO TONS)   
TABLE 36 JAPAN: ETHYLENE OXIDE MARKET REVENUE, BY APPLICATIONS, 2009 – 2016 ($MILLION)   
TABLE 37 INDIA: ETHYLENE OXIDE MARKET VOLUME, BY APPLICATIONS, 2009 – 2016 (KILO TONS)   
TABLE 38 INDIA: ETHYLENE OXIDE MARKET REVENUE, BY APPLICATIONS, 2009 – 2016 ($MILLION)   
TABLE 39 ROW: ETHYLENE OXIDE MARKET VOLUME (KILO TONS) & REVENUE ($MILLION), 2009 – 2016  
TABLE 40 BRAZIL: ETHYLENE OXIDE MARKET VOLUME, BY APPLICATIONS, 2009 – 2016 (KILO TONS)   
TABLE 41 BRAZIL: ETHYLENE OXIDE MARKET REVENUE, BY APPLICATIONS, 2009 – 2016 ($MILLION)   
TABLE 42 GLOBAL ETHYLENE GLYCOL MARKET VOLUME (KILO TONS) & REVENUE ($MILLION), 2009 – 2016  
TABLE 43 ETHYLENE GLYCOL BULK PRICES, 2009 – 2016 ($/TON)  
TABLE 44 ETHYLENE GLYCOL MARKET FOR POLYESTER FIBERS, BY VOLUME (KILO TONS) & BY REVENUE ($MILLION), 2009 – 2016   
TABLE 45 ETHYLENE GLYCOL MARKET FOR PET RESIN, BY VOLUME (KILO TONS) & BY REVENUE ($MILLION), 2009 – 2016  
TABLE 46 ETHYLENE GLYCOL MARKET FOR AUTOMOTIVE ANTIFREEZE, BY VOLUME (KILO TONS) & BY REVENUE ($MILLION), 2009 – 2016   
TABLE 47 ETHYLENE GLYCOL MARKET FOR OTHER APPLICATIONS, BY VOLUME (KILO TONS) & BY REVENUE ($MILLION), 2009 – 2016  
TABLE 48 NORTH AMERICA: ETHYLENE GLYCOL MARKET VOLUME (KILO TONS) & REVENUE ($MILLION), 2009 – 2016  
TABLE 49 U.S: ETHYLENE GLYCOL MARKET VOLUME, BY APPLICATIONS, 2009 – 2016 (KILO TONS)   
TABLE 50 U.S: ETHYLENE GLYCOL MARKET REVENUE, BY APPLICATIONS, 2009 – 2016 ($MILLION)   
TABLE 51 EUROPE: ETHYLENE GLYCOL MARKET VOLUME (KILO TONS) & REVENUE ($MILLION), 2009 – 2016  
TABLE 52 GERMANY: ETHYLENE GLYCOL MARKET VOLUME, BY APPLICATIONS, 2009 – 2016 (KILO TONS)  
TABLE 53 GERMANY: ETHYLENE GLYCOL MARKET REVENUE, BY APPLICATIONS, 2009 – 2016 ($MILLION)  
TABLE 54 U.K: ETHYLENE GLYCOL MARKET VOLUME, BY APPLICATIONS, 2009 – 2016 (KILO TONS)   
TABLE 55 U.K: ETHYLENE GLYCOL MARKET REVENUE, BY APPLICATIONS, 2009 – 2016 ($MILLION)   
TABLE 56 FRANCE: ETHYLENE GLYCOL MARKET VOLUME, BY APPLICATIONS, 2009 – 2016 (KILO TONS)   
TABLE 57 FRANCE: ETHYLENE GLYCOL MARKET REVENUE, BY APPLICATIONS, 2009 – 2016 ($MILLION)  
TABLE 58 ASIA-PACIFIC: ETHYLENE GLYCOL MARKET VOLUME (KILO TONS) & REVENUE ($MILLION), 2009 – 2016  
TABLE 59 CHINA: ETHYLENE GLYCOL MARKET VOLUME, BY APPLICATIONS, 2009 – 2016 (KILO TONS)   
TABLE 60 CHINA: ETHYLENE GLYCOL MARKET REVENUE, BY APPLICATIONS, 2009 – 2016 ($MILLION)   
TABLE 61 CHINA BULK MEG PRICES, 2009 – 2016 ($/TON)  
TABLE 62 JAPAN: ETHYLENE GLYCOL MARKET VOLUME, BY APPLICATIONS, 2009 – 2016 (KILO TONS)   
TABLE 63 JAPAN: ETHYLENE GLYCOL MARKET REVENUE, BY APPLICATIONS, 2009 – 2016 ($MILLION)   
TABLE 64 INDIA: ETHYLENE GLYCOL MARKET VOLUME, BY APPLICATIONS, 2009 – 2016 (KILO TONS)   
TABLE 65 INDIA: ETHYLENE GLYCOL MARKET REVENUE, BY APPLICATIONS, 2009 – 2016 ($MILLION)   
TABLE 66 ROW: ETHYLENE GLYCOL MARKET VOLUME (KILO TONS) & REVENUE ($MILLION), 2009 – 2016  
TABLE 67 BRAZIL: ETHYLENE GLYCOL MARKET VOLUME, BY APPLICATIONS, 2009 – 2016 (KILO TONS)   
TABLE 68 BRAZIL: ETHYLENE GLYCOL MARKET REVENUE, BY APPLICATIONS, 2009 – 2016 ($MILLION)  
TABLE 69 AGREEMENTS & COLLABORATIONS, JUNE 2008 – NOVEMBER 2011  
TABLE 70 MERGERS & ACQUISITIONS, JUNE 2008 – NOVEMBER 2011  
TABLE 71 GEOGRAPHIC & OPERATIONAL EXPANSIONS, JUNE 2008 – NOVEMBER 2011   
TABLE 72 AKZONOBEL N.V.: TOTAL REVENUE, BY SEGMENTS, 2009 – 2010 ($MILLION)  
TABLE 73 BASF SE: TOTAL REVENUE, BY SEGMENTS, 2009 – 2016 ($MILLION)  
TABLE 74 CHINA PETROLEUM & CHEMICAL CORPORATION: TOTAL REVENUE, BY SEGMENTS, 2009 – 2010 ($MILLION)   
TABLE 75 CLARIANT AG: TOTAL REVENUE, BY SEGMENTS, 2009 – 2010 ($MILLION)  
TABLE 76 EXXON MOBIL CORPORATION: TOTAL REVENUE, BY SEGMENTS, 2009 – 2010 ($MILLION)   
TABLE 77 FORMOSA PLASTICS: TOTAL REVENUE, BY SEGMENTS, 2009 – 2016 ($MILLION)  
TABLE 78 HUNTSMAN CORPORATION: TOTAL REVENUE, BY SEGMENTS, 2009 – 2010 ($MILLION)   
TABLE 79 LYONDELLBASELL INDUSTRIES: TOTAL REVENUE, BY SEGMENTS, 2009 – 2010 ($MILLION)   
TABLE 80 RELIANCE INDUSTRIES LIMITED: TOTAL REVENUE, BY SEGMENTS, 2009 – 2010 ($MILLION)  
TABLE 81 ROYAL DUTCH SHELL PLC: TOTAL REVENUE, BY SEGMENTS, 2009 – 2010 ($MILLION)   
TABLE 82 SAUDI BASIC INDUSTRIES CORPORATION: TOTAL REVENUE, BY SEGMENTS, 2009 – 2010 ($MILLION)   
TABLE 83 SINOPEC SHANGHAI PETROCHEMICAL COMPANY LIMITED: TOTAL REVENUE, BY SEGMENTS, 2009 – 2010 ($MILLION)  
TABLE 84 DOW CHEMICAL: TOTAL REVENUE, BY SEGMENTS, 2009 – 2010 ($MILLION)  
TABLE 85 ULTRAPAR PARTICIPACOES SA: TOTAL REVENUE, BY SEGMENTS, 2009 – 2010 ($MILLION)   
    
     
LIST OF FIGURES   
    
FIGURE 1 VALUE CHAIN ANALYSIS  
FIGURE 2 IMPACT OF MAJOR DRIVERS ON ETHYLENE OXIDE & ETHYLENE GLYCOL MARKET  
FIGURE 3 IMPACT OF MAJOR RESTRAINTS ON ETHYLENE OXIDE & ETHYLENE GLYCOL MARKET  
FIGURE 4 GLOBAL PET RECYCLING RATES, 2010  
FIGURE 5 GLOBAL PLASTIC CONSUMPTION, BY GEOGRAPHY, 2009 – 2016 (MILLION TONS)  
FIGURE 6 SURFACTANTS DEMAND, BY GEOGRAPHY, 2009 – 2016 ($MILLION)  
FIGURE 7 ETHYLENE MARKET SHARE, BY APPLICATIONS, 2010  
FIGURE 8 PORTER’S FIVE FORCES ANALYSIS  
FIGURE 9 NORTH AMERICA: ETHYLENE OXIDE MARKET SHARE, BY COMPANY, 2010  
FIGURE 10 EUROPE: ETHYLENE OXIDE MARKET SHARE, BY COMPANY, 2010  
FIGURE 11 EUROPE: ETHYLENE GLYCOL MARKET SHARE, BY COMPANY, 2010  
FIGURE 12 CHINA: ETHYLENE OXIDE MARKET SHARE, BY COMPANY, 2010  
FIGURE 13 PATENT ANALYSIS, BY GEOGRAPHY, JANUARY 2008 – SEPTEMBER 2011  
FIGURE 14 PATENT TRENDS, BY GEOGRAPHY, JANUARY 2008 – SEPTEMBER 2011  
FIGURE 15 PATENT ANALYSIS, BY COMPANY, JANUARY 2008 – SEPTEMBER 2011 (%)
FIGURE 16 ETHYLENE OXIDE MARKET SHARE, BY APPLICATIONS, 2010  
FIGURE 17 GLOBAL SURFACTANTS MARKET SHARE, BY GEOGRAPHY, 2010  
FIGURE 18 GLOBAL SURFACTANTS MARKET SHARE, BY APPLICATIONS, 2010  
FIGURE 19 GLOBAL SURFACTANTS MARKET SHARE, BY TYPES, 2010  
FIGURE 20 ETHYLENE OXIDE MARKET SHARE, BY GEOGRAPHY, 2010  
FIGURE 21 ETHYLENE GLYCOL MAJOR TYPES, 2010  
FIGURE 22 ETHYLENE GLYCOL MARKET SHARE, BY APPLICATIONS, 2010  
FIGURE 23 ETHYLENE GLYCOL MARKET SHARE, BY GEOGRAPHY, 2010  
FIGURE 24 MAJOR GROWTH STRATEGIES IN THE GLOBAL EO/EG MARKET, JUNE 2008 – NOVEMBER 2011   
FIGURE 25 GROWTH STRATEGIES, BY GEOGRAPHY, JUNE 2008 – NOVEMBER 2011  
FIGURE 26 GROWTH STRATEGIES, BY COMPANY, JUNE 2008 – NOVEMBER 2011


Request for detailed methodology, assumptions & how numbers were triangulated.

Please share your problem/objectives in greater details so that our analyst can verify if they can solve your problem(s).
9 7 5 0 4  
  • Select all
  • News-Letters with latest Market insights
  • Information & discussion on the relevant new products and services
  • Information & discussion on Market insights and Market information
  • Information & discussion on our events and conferences
    • Select all
    • Email Phone Professional and social network (Linkedin, etc)
Custom Market Research Services

We will customize the research for you, in case the report listed above does not meet with your exact requirements. Our custom research will comprehensively cover the business information you require to help you arrive at strategic and profitable business decisions.

Request Customization
Report Code
CH 1613
Published ON
Dec, 2011
Choose License Type
BUY NOW
  • SHARE
X
Request Customization
Speak to Analyst
Speak to Analyst
OR FACE-TO-FACE MEETING
PERSONALIZE THIS RESEARCH
  • Triangulate with your Own Data
  • Get Data as per your Format and Definition
  • Gain a Deeper Dive on a Specific Application, Geography, Customer or Competitor
  • Any level of Personalization
REQUEST A FREE CUSTOMIZATION
LET US HELP YOU!
  • What are the Known and Unknown Adjacencies Impacting the Global Ethylene Oxide and Ethylene Glycol Market
  • What will your New Revenue Sources be?
  • Who will be your Top Customer; what will make them switch?
  • Defend your Market Share or Win Competitors
  • Get a Scorecard for Target Partners
CUSTOMIZED WORKSHOP REQUEST
+1-888-600-6441
  • Call Us
  • +1-888-600-6441 (Corporate office hours)
  • +1-888-600-6441 (US/Can toll free)
  • +44-800-368-9399 (UK office hours)
CONNECT WITH US
ABOUT TRUST ONLINE
©2023 MarketsandMarkets Research Private Ltd. All rights reserved
DMCA.com Protection Status Website Feedback