
Battery Electrolyte Market

Battery Electrolyte Market by Battery Type (Lead-Acid and Lithium-Ion), Electrolyte Type (Liquid, Gel, Solid), End Use (EV, Consumer Electronics, Energy Storage), Material (Sulfuric Acid, Lithium Salts, Solvents), and Region - Global Forecast to 2030


OVERVIEW
Source: Secondary Research, Interviews with Experts, MarketsandMarkets Analysis
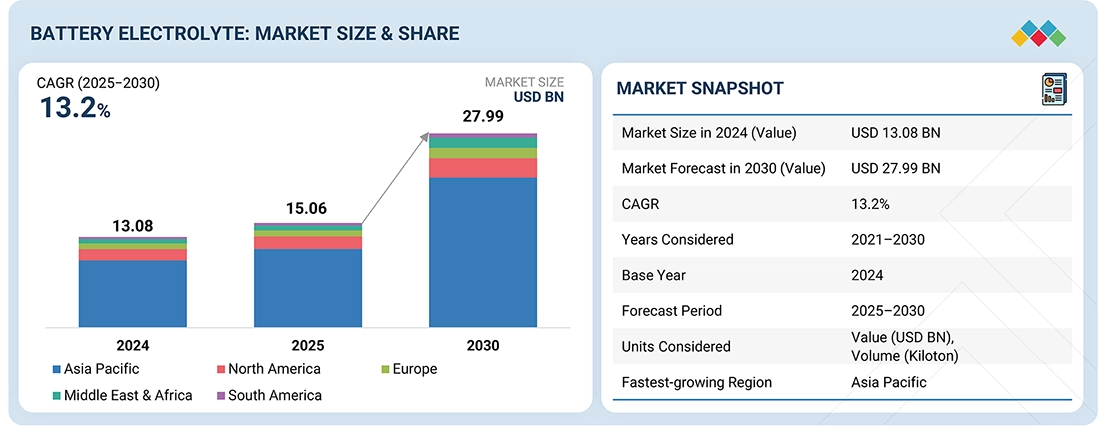
The global battery electrolyte market is expected to grow from USD 15.06 billion in 2025 to USD 27.99 billion by 2030, at a CAGR of 13.2% during the forecast period. Electrolytes are essential components in batteries, facilitating the flow of electric charge and enabling recharging. Their quality directly affects battery efficiency, safety, and longevity. Depending on the type, electrolytes can be liquid, solid, or gel, and they are used in batteries such as lithium-ion and lead-acid. They play a crucial role in applications ranging from electric vehicles and consumer electronics to energy storage. As electrification increases, along with the demand for cleaner energy and sustainable mobility, the global battery electrolyte market is growing rapidly.
KEY TAKEAWAYS
-
BY ELECTROLYTE TYPEKey Electrolyte types include liquid electrolyte, solid electrolyte, and gel electrolyte. The liquid electrolyte segment is expected to register the highest CAGR in the market during the forecast period. Liquid electrolytes offer high ionic conductivity and are compatible with essentially every electrode chemistry.
-
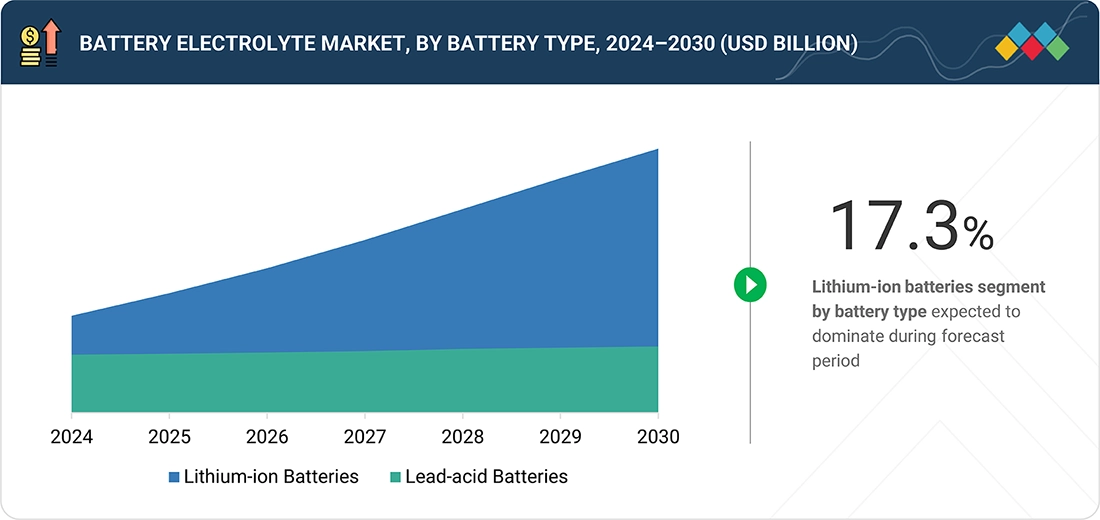
BY BATTERY TYPEThe battery types include lithium-ion and lead-acid. Lithium-ion is projected to be the fastest-growing segment in the market.
-
BY END-USEEnd uses include electric vehicles, consumer electronics, energy storage, and others. Electric vehicles is expected to be the largest segment, and energy storage is projected to register the highest CAGR during the forecast period.
-
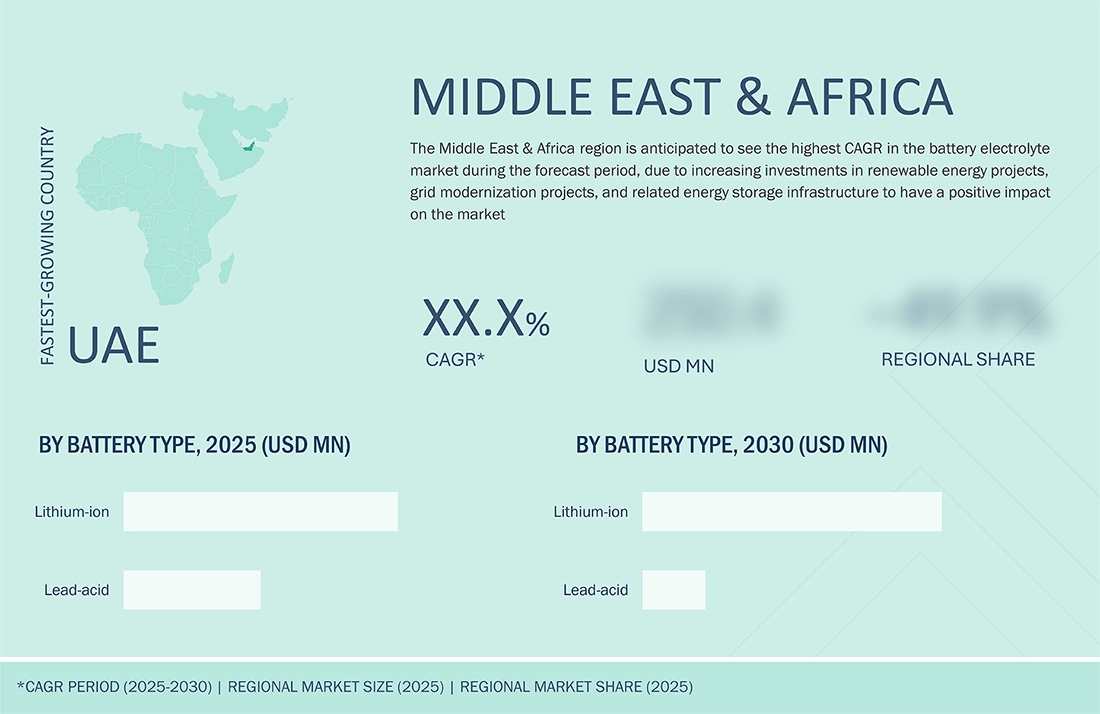
BY REGIONThe battery electrolytes market covers Europe, North America, Asia Pacific, the Middle East & Africa, and South America. Asia Pacific is the largest region and Middle East & Africa will register the highest CAGR in the market during the forecast period.
-
COMPETITIVE LANDSCAPEMitsubishi Chemical Group Corporation (Japan), CAPCHEM (China), Guangzhou Tinci Materials Technology Co., Ltd. (China), Enchem Co., Ltd. (South Korea), and Materials Co., Ltd. (China) are the leading manufacturers of battery electrolyte. They focus on expanding Zhangjiagang Guotai Huarong New Chemical's geographic reach to meet consumer demand. Besides expansions, the companies adopted agreements, joint ventures, and other strategies to gain new projects, strengthen their product and service portfolios, and access untapped markets.
Electrolytes are crucial in batteries because they enable the flow of electric charge, which allows recharging and directly influences the efficiency, safety, and lifespan of the device. The type and quality of electrolyte, whether liquid, solid, or gel, affect performance in batteries like lithium-ion and lead-acid, which are used in electric vehicles, consumer electronics, and energy storage systems. As demand for electrification, clean energy, and sustainable transportation rises, the battery electrolyte market is rapidly growing.
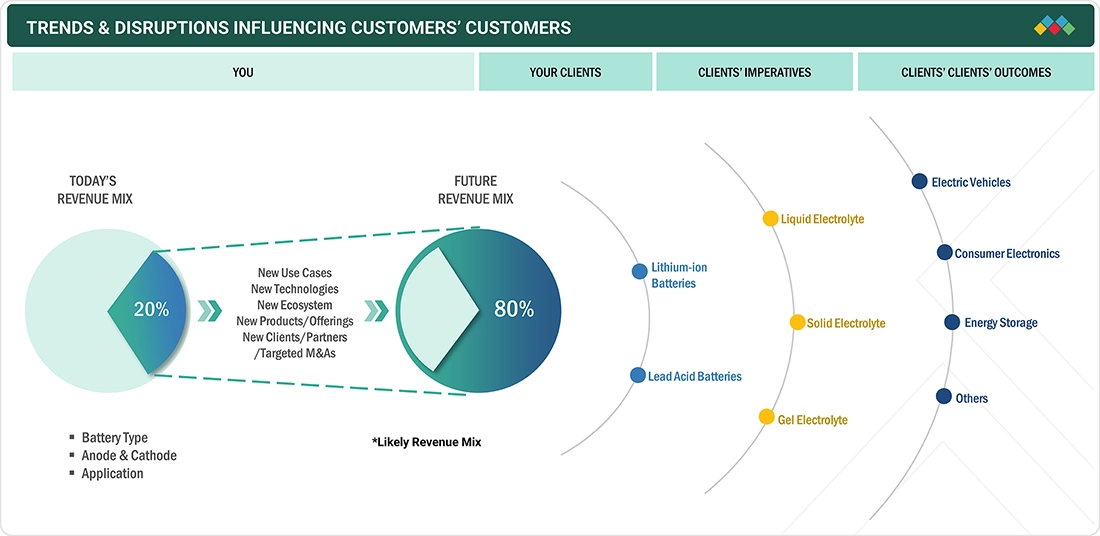
TRENDS & DISRUPTIONS IMPACTING CUSTOMERS' CUSTOMERS
The impact on consumers' business emerges from customer trends or disruptions. The battery electrolytes market is growing rapidly as demand for electric vehicles, renewable energy storage, and consumer electronics increases. Electrolytes, which enable charge transfer inside batteries, are critical for performance, safety, and durability. With advances in liquid, solid, and gel electrolytes, and their use in lithium-ion and lead-acid batteries, the market is shifting toward new technologies and applications, making electrolytes a key driver of next-generation energy solutions.
Source: Secondary Research, Interviews with Experts, MarketsandMarkets Analysis
MARKET DYNAMICS
Level
-
Growth of HEVs, PHEVs, and EVs to accelerate demand for lithium-ion batteries

-
Growing need for automation and battery-operated equipment in industries

Level
-
Safety issues related to storage and transportation of batteries

-
Inadequate charging infrastructure

Level
-
Increasing demand for grid energy storage systems owing to ongoing grid modernization

Level
-
Overheating issues of lithium-ion batteries

Source: Secondary Research, Interviews with Experts, MarketsandMarkets Analysis
Driver: Growth of HEVs, PHEVs, and EVs to accelerate demand for lithium-ion batteries
In the automotive sector, a discernible trend toward the utilization of sustainable and environmentally friendly fuels has become apparent. The global demand for electric vehicles, including battery electric vehicles (BEVs), plug-in hybrid electric vehicles (PHEVs), and hybrid electric vehicles (HEVs), has experienced a noteworthy increase in recent years. This expansion is primarily motivated by governmental support through policy reforms, subsidies, and regulations aimed at reducing carbon dioxide emissions. In regions such as Europe, North America, and select Asian countries, governments have commenced offering financial incentives. The majority of crude oil is consumed in the production of gasoline and diesel for transportation purposes. This substantial reliance on petroleum has elicited concern among economists and environmentalists alike, thereby accelerating the transition toward electric vehicles. Research conducted by the International Energy Agency (IEA) indicates that China has been instrumental in the rapid growth of EV sales. In 2021, China's vehicle sales surpassed global sales in 2020 by 3.3 million units. Electric vehicles in China tend to be smaller compared to those in other markets, with sales of electric two- and three-wheelers accounting for approximately fifty percent of the market. Furthermore, China is swiftly expanding its charging infrastructure in comparison to many other nations. The increasing adoption of EVs is facilitated by advancements in battery technology, lower maintenance costs for vehicle engines, and a reduction in pollution levels. Regulatory policies and government initiatives also play a pivotal role in fostering this growth. For instance, the United Kingdom has announced a ban on the sale of new gasoline and diesel vehicles beginning in 2040. France, China, and Germany—some of the largest automotive markets—have adopted similar measures to mitigate greenhouse gas emissions. Numerous companies are engaged in developing new and improved electric vehicles, which, in turn, will augment the demand for battery electrolytes used in EV batteries.
Restraints: Safety issues related to the storage and transportation of batteries
Acids and heavy metals like lead and mercury are among the hazardous substances found in batteries. Aviation and safety experts are concerned about the increasing number of fires and smoke incidents caused by passengers' devices' dead batteries on airlines. In some cases, a battery compartment fire has led to the grounding of an entire aircraft. The Federal Aviation Administration (FAA) reported about 18 incidents involving lithium-ion batteries on aircraft and at airports in 2017, compared to 31 incidents in 2016. In March 2017, an e-cigarette charger allegedly caught fire on a JetBlue flight from New York to San Francisco, prompting an emergency landing in Michigan. Due to fire hazard concerns, Samsung also recalled its Galaxy Note7 smartphone. Other battery types, such as nickel- and lead-based batteries, can catch fire due to the materials used in their cathodes, but lithium-ion batteries are subject to safety scans. Batteries should be stored away from combustible materials and in airtight containers. During a fire, it is also wise to keep sand and a Class D fire extinguisher nearby. Because batteries can retain residual charge, unplanned discharges are possible, which could cause harm or damage. All batteries should be handled as if they are charged and stored carefully unless properly labeled. Some batteries are small enough to be swallowed and should be kept out of children's reach. If local manufacturers do not properly label large lithium-based batteries, such as those used in automobiles, they may be mistaken for lead-acid batteries. Therefore, they must be correctly sorted and kept separate from spent lead-acid batteries during storage and transport, following safety rules established by local or national authorities.
Opportunity: Increasing demand for grid energy storage systems owing to ongoing grid modernization
Using renewable sources, wind and solar are becoming significantly more important. It is crucial to have the ability to store energy, as they only provide electricity with a significant build-up phase. Industrial batteries will play a vital role in grid modernization, offering load balancing, time shifting, and voltage/frequency regulation as well as backup power during outages. AES Corporation, with partners Mitsubishi and Fluence, is deploying large-scale Bulk Battery Energy Storage Systems (BESS) in India. Siemens' SIESTORAGE system provides highly flexible grid storage with intelligent modulation. Broad Reach Power has been building multi-stack battery storage projects in Texas to aid renewable integration and grid reliability. Industrial batteries, particularly lithium-ion and lead-acid types, are also increasingly used in data center UPS systems. This power delivery is robust and activates when grid services are down, ensuring uninterrupted operations for critical digital infrastructure. This reliable, long-lasting advanced battery is set to be an essential part of the world’s shift to cleaner energy and the pursuit of digital resilience, offering grid-level storage and behind-the-meter applications worldwide.
Challenge: Overheating issues of lithium-ion batteries
Lithium-ion batteries are used in consumer electronics, automobiles, electrical systems, commercial aviation, AGVs, forklifts, pallet trucks, and material handling equipment. They store a relatively large amount of energy in their volume but are susceptible to rapid heating and can even catch fire if there is a fault. There are many reasons overheating can occur. Lithium is highly volatile, and when in the battery, a disruption—such as a short circuit—can happen if the separator between the cathode and anode is damaged. This physical damage can cause the separator to melt and lead to overheating. If a battery leaks, the liquid reacts chemically with surrounding components, causing further overheating. Some overheating issues can also stem from software, as certain devices lack the capability to automatically disable charging when necessary, allowing charging to continue during use. This can lead to overcharging and battery expansion, which causes swelling—a major issue for lithium-ion battery manufacturers. All of these factors create barriers to market growth for these batteries and pose challenges related to the battery electrolyte.
Battery Electrolyte Market: COMMERCIAL USE CASES ACROSS INDUSTRIES
| COMPANY | USE CASE DESCRIPTION | BENEFITS |
|---|---|---|
 |
Development of advanced liquid electrolytes and solid electrolytes tailored for high-performance lithium-ion and next-generation batteries | Enhanced safety, improved thermal stability, higher energy density, and compatibility with EV and energy storage applications |
 |
Supplies lithium battery electrolytes, electrolyte additives, and ultra-pure electronic chemicals for EVs and portable electronics | Improved battery cycle life, stable electrochemical performance, and optimized energy efficiency |
 |
Leading producer of lithium battery electrolytes and additives used by global EV battery manufacturers | High ionic conductivity, superior battery stability, longer driving range, and improved charging performance |
 |
Production of liquid electrolytes and gel polymers for lithium-ion and solid-state batteries | Broad application in EVs and ESS, improved safety and energy performance, supports global EV battery supply chain |
 |
Manufactures advanced electrolytes and electrolyte additives widely used in lithium-ion batteries | Stable battery performance, long cycle life, enhanced safety, and cost-effective large-scale production |
Logos and trademarks shown above are the property of their respective owners. Their use here is for informational and illustrative purposes only.
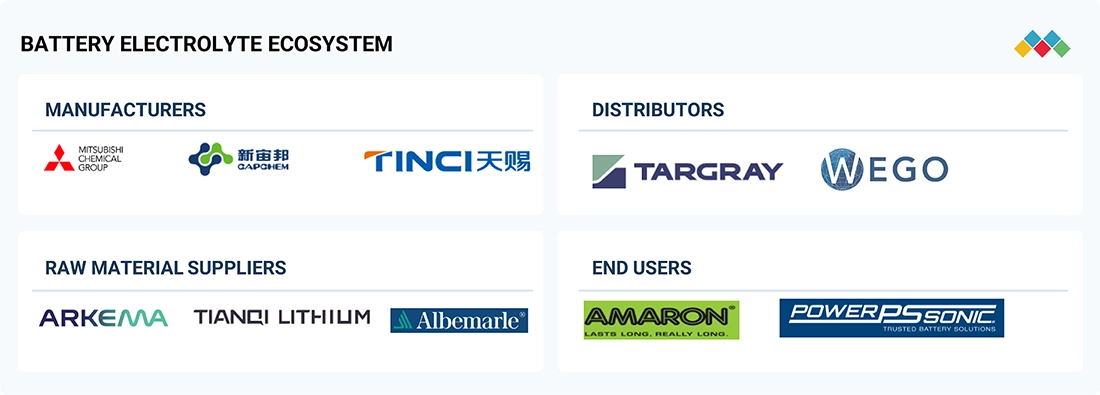
MARKET ECOSYSTEM
The battery electrolyte market ecosystem connects raw material suppliers (Arkema, Albemarle, Tianqi Lithium), manufacturers (Mitsubishi Chemical Group, Capchem, Tinci), and end users (Power Sonic, Amaron). Suppliers provide key inputs like lithium salts and solvents, which manufacturers process into advanced electrolyte solutions for electric vehicles, consumer electronics, and energy storage. End users drive demand for safer, more efficient batteries, while collaboration across the value chain promotes innovation, supply chain resilience, and market growth.
Logos and trademarks shown above are the property of their respective owners. Their use here is for informational and illustrative purposes only.
MARKET SEGMENTS
Source: Secondary Research, Interviews with Experts, MarketsandMarkets Analysis
Battery Electrolytes Market, By Battery Type
The lithium-ion segment, by battery type, is expected to achieve the highest CAGR in the battery electrolyte market based on value during the forecast period. This growth is driven by technological advancements, increasing electrification, and rising demand for high-performance energy storage systems. Compared to traditional batteries, lithium-ion technology offers higher energy density, a longer lifespan, faster charging times, and lighter weight. This makes it the preferred choice for various applications requiring advanced battery performance. The market's growth is heavily influenced by the booming electric vehicle (EV) industry, which depends on lithium-ion batteries for reliable and efficient power. Future growth in demand is likely due to government policies supporting zero-emissions vehicles, increased investments in EV manufacturing, and the expansion of EV charging infrastructure and stations. Additionally, the shift toward renewable energy sources is boosting the deployment of grid-scale energy storage systems using lithium-ion batteries to manage the fluctuating supply of electricity. Demand is also sustained by the widespread use of lithium-ion batteries in portable consumer electronics like mobile phones, laptops, and wearables. Furthermore, innovations in lithium-ion materials, chemistries, recycling capabilities, costs, and performance will continue to broaden their application across industries and further propel the growth of the battery electrolyte market.
Battery Electrolyte Market, By Electrolyte Type
The liquid electrolyte segment, by electrolyte type, is projected to register the highest CAGR in the battery electrolyte market, in terms of value, during the forecast period. Liquid electrolytes are the most commonly used in the battery electrolyte market, primarily employed in lithium-ion batteries for various applications, including electronic devices, electric vehicles, and large-scale energy storage systems. They provide high ionic conductivity and are compatible with virtually every electrode chemistry. This segment continues to hold the highest CAGR in the market due to ongoing advancements in solvent blends, lithium salt formulations, and functional additives that enhance safety, cycle life, and enable operation at higher voltage levels.
Battery Electrolyte Market, By End Use
The energy storage segment, by end use, is expected to register the highest CAGR in the battery electrolyte market, in terms of value, during the forecast period. The battery electrolyte market has been expanding aggressively, as the global focus shifts toward renewable energy, which is served well by the burgeoning energy storage segment, being the largest and fastest-growing end-use category in the industry on account of efficient grid balancing solutions. High-aperture lithium-ion and advanced lead-acid battery systems with high-performance electrolytes are being used more and more to store excess electricity from solar or wind power plants and help ensure long-term grid stability. Strengthened by government incentives, renewable integration mandates, and reduced product costs, utility-scale and commercial energy storage installations are on the rise while advancements in electrolyte formulations—providing enhanced density, longer cycle life, and safer operation—enable these systems to meet tough operational constraints.
REGION
Middle East & Africa to be fastest-growing region in global battery electrolyte market during forecast period
The Middle East & Africa battery electrolytes market is expected to achieve the highest CAGR during the forecast period, driven by rapid industrialization, especially the growth of the automotive and other key sectors, which are major consumers of battery electrolytes, and are expected to propel the regional market during this period.
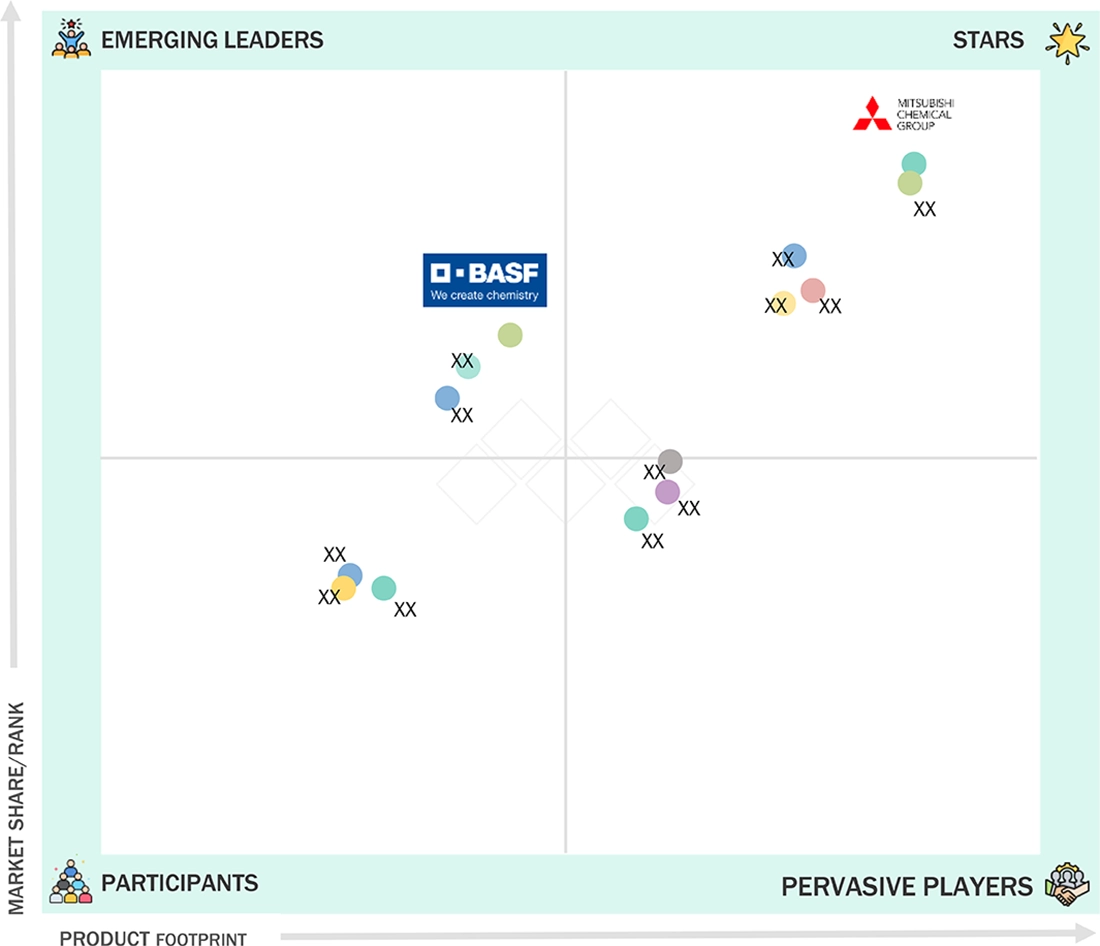
Battery Electrolyte Market: COMPANY EVALUATION MATRIX
In the battery electrolyte market matrix, BASF stands out as a star performer, holding a leading market share with a broad and advanced product footprint across key battery electrolyte segments. The company's strategic investments in chemical innovation and supply chain integration enable it to address industry demands for quality, performance, and sustainability. Mitsubishi Chemical Group, as an emerging leader, is steadily increasing its visibility through expanding product lines and technology advancements, supporting next-generation battery applications. Companies positioned as participants and pervasive players contribute to market dynamism with targeted offerings and specialized solutions, collectively driving growth and evolution within the battery electrolyte value chain.
Source: Secondary Research, Interviews with Experts, MarketsandMarkets Analysis
KEY MARKET PLAYERS
MARKET SCOPE
| REPORT METRIC | DETAILS |
|---|---|
| Market Size in 2024 (Value) | USD 13.08 BN |
| Market Forecast in 2030 (value) | USD 27.99 BN |
| Growth Rate | CAGR of 13.2% from 2025-2030 |
| Years Considered | 2021-2030 |
| Base Year | 2024 |
| Forecast Period | 2025-2030 |
| Units Considered | Value (USD Million/Billion), Volume (Kiloton) |
| Report Coverage | Revenue forecast, company ranking, competitive landscape, growth factors, and trends |
| Segments Covered |
|
| Regions Covered | North America, Asia Pacific, Europe, the Middle East & Africa, and South America |
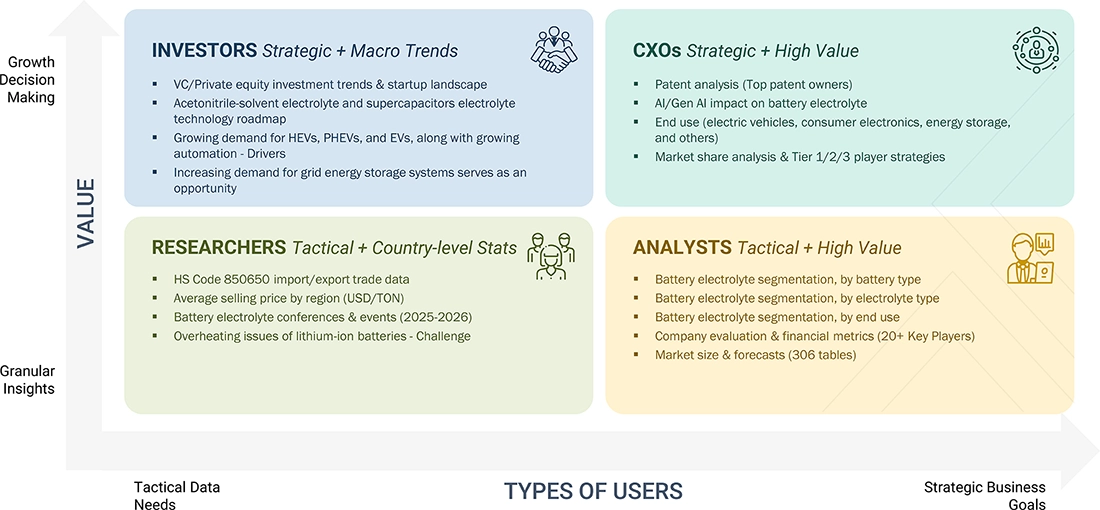
WHAT IS IN IT FOR YOU: Battery Electrolyte Market REPORT CONTENT GUIDE
DELIVERED CUSTOMIZATIONS
We have successfully delivered the following deep-dive customizations:
| CLIENT REQUEST | CUSTOMIZATION DELIVERED | VALUE ADDS |
|---|---|---|
| Leading EV OEM |
|
|
| Battery Material Manufacturer |
|
|
| Battery Cell Producer |
|
|
| Raw Material Supplier |
|
|
| Energy Storage Developer |
|
|
RECENT DEVELOPMENTS
- February 2025 : UBE Corporation?began constructing its first US-based plant in Waggaman, Louisiana, to produce dimethyl carbonate (DMC) and ethyl methyl carbonate (EMC), key electrolyte solvents for lithium-ion batteries used in BEVs, HEVs, and energy storage systems, as well as a developer for semiconductor manufacturing. UBE’s subsidiary UBE C1 Chemicals America will utilize its proprietary gas-phase nitrite process to deliver 100,000?t/y of DMC and 40,000?t/y of EMC with higher efficiency, purity, and fewer by-products. Scheduled to open in late 2026.
- October 2024 : NEI Corporation announced the launch of a new halide-based solid electrolyte, Lithium Indium Chloride (Li3InCl6), designed for next-generation solid-state lithium-ion batteries. The material offers high ionic conductivity, low electronic conductivity, and improved air stability, making it easier to handle and process. Available in research quantities, the product aims to support advancements in high-performance, safer lithium-ion energy storage systems.
- September 2024 : E-Lyte Innovations GmbH opened Germany’s first dedicated electrolyte production plant on September 13, 2024, in Kaiserslautern. Supported by nearly USD 8,86,880 in funding from the Federal Environment Ministry’s Environmental Innovation Program, the facility aims to produce high-performance electrolyte solutions for next-generation batteries and energy storage systems.
Table of Contents
 Exclusive indicates content/data unique to MarketsandMarkets and not available with any competitors.
Methodology
The research encompassed four primary actions in assessing the present market size of battery electrolytes. Comprehensive secondary research was conducted to gather information on the market, the peer market, and the parent market. The subsequent stage involved corroborating these findings, assumptions, and dimensions with industry specialists throughout the battery electrolyte value chain via primary research. The total market size is ascertained using both top-down and bottom-up methodologies. Subsequently, market segmentation analysis and data triangulation were employed to ascertain the dimensions of the market segments and subsegments.
Secondary Research
The research approach employed to assess and project the battery electrolyte market begins with the collection of revenue data from prominent suppliers using secondary research. In the course of the secondary research, many secondary sources, such as Hoovers, Bloomberg BusinessWeek, Factiva, the World Bank, and industry magazines, were utilized to identify and compile information for this study. The secondary sources comprised annual reports, press releases, and investor presentations from corporations; white papers; accredited periodicals; writings by esteemed authors; announcements from regulatory agencies; trade directories; and databases. Vendor offerings have been considered to ascertain market segmentation.
Primary Research
The battery electrolyte market comprises several stakeholders, such as manufacturers, suppliers, traders, associations, and regulatory organizations, in the supply chain. The demand side of this market is characterized by the development of electric vehicles, consumer electronics, energy storage, and other end-uses. Advancements in technology characterize the supply side. Various primary sources from both the supply and demand sides of the market were interviewed to obtain qualitative and quantitative information.
The following is the breakdown of the primary respondents:

To know about the assumptions considered for the study, download the pdf brochure
Market Size Estimation
Both the top-down and bottom-up approaches were used to estimate and validate the total size of the battery electrolyte market. These methods were also used extensively to determine the size of various subsegments in the market. The research methodology used to estimate the market size included the following:
- The key players were identified through extensive primary and secondary research
- The value chain and market size of the battery electrolyte market, in terms of value, were determined through primary and secondary research
- All percentage shares, splits, and breakdowns were determined using secondary sources and verified through primary sources
- All possible parameters that affect the market covered in this research study were accounted for, viewed in extensive detail, verified through primary research, and analyzed to obtain the final quantitative and qualitative data
- The research included the study of reports, reviews, and newsletters of top market players, along with extensive interviews for opinions from key leaders, such as CEOs, directors, and marketing executives
Global Battery Electrolyte Market Size: Bottom-up and Top-down Approach

Data Triangulation
After arriving at the overall market size using the market size estimation processes as explained above, the market was split into several segments and subsegments. To complete the overall market engineering process and arrive at the exact statistics of each market segment and subsegment, data triangulation and market breakdown procedures were employed, wherever applicable. The market size was calculated globally by summing up the country-level and regional-level data.
Market Definition
Batteries use electrolytes as a chemical source to produce electricity. Battery electrolytes are a solution inside batteries that allows electrical current to flow between the anode and the cathode. Electrolytes promote the movement of ions from the cathode to the anode on charge and, in reverse, on discharge. Ions are electrically charged atoms that have lost or gained electrons. An electrolyte can be in the form of a liquid, a solid, or a gel, depending on the type of battery it is used for, such as a lead-acid or lithium-ion battery. Batteries with this electrolyte are used in various industries such as automotive, consumer electronics, and energy storage.
Stakeholders
- Battery Electrolyte Manufacturers
- Battery Electrolyte Suppliers
- Battery Electrolyte Traders, Distributors, and Suppliers
- Investment Banks and Private Equity Firms
- Raw Material Suppliers
- Government and Research Organizations
- Consulting Companies/Consultants in the Chemicals and Materials Sectors
- Industry Associations
- Contract Manufacturing Organizations (CMOs)
- NGOs, Governments, Investment Banks, Venture Capitalists, and Private Equity Firms
Report Objectives
- To define, describe, and forecast the size of the global battery electrolyte market in terms of volume and value
- To provide detailed information regarding the key factors, such as drivers, restraints, opportunities, and challenges, influencing the growth of the global battery electrolyte market
- To analyze and forecast the size of various segments of the battery electrolyte market based on four major regions—North America, Asia Pacific, Europe, and the Rest of the World, along with key countries in each of these regions
- To analyze recent developments and competitive strategies, such as agreements, partnerships, product launches, and joint ventures, to draw the competitive landscape of the market
- To strategically profile the key players in the market and comprehensively analyze their core competencies
Key Questions Addressed by the Report
What is the critical driver for the battery electrolyte market?
The growing need for automation and battery-operated equipment in industries is a key driver for the battery electrolyte market.
Which region is expected to register the highest CAGR in the battery electrolyte market during the forecast period?
The battery electrolyte market in the Middle East & Africa is estimated to register the highest CAGR during the forecast period.
Which is the major end-use industry of battery electrolyte?
Electric vehicles are the major end-use industry for battery electrolytes.
Who are the major players in the battery electrolyte market?
Key players include CAPCHEM (China), ENCHEM Co., Ltd. (South Korea), Guangzhou Tinci Materials Technology Co., Ltd. (China), Mitsubishi Chemical Group Corporation (Japan), and Zhangjiagang Guotai Huarong New Chemical Materials Co., Ltd. (China).
What is the expected CAGR of the battery electrolyte market from 2025 to 2030?
The market is expected to record a CAGR of 13.2% from 2025 to 2030.
Need a Tailored Report?
Customize this report to your needs
Get 10% FREE Customization
Customize This ReportPersonalize This Research
- Triangulate with your Own Data
- Get Data as per your Format and Definition
- Gain a Deeper Dive on a Specific Application, Geography, Customer or Competitor
- Any level of Personalization
Let Us Help You
- What are the Known and Unknown Adjacencies Impacting the Battery Electrolyte Market
- What will your New Revenue Sources be?
- Who will be your Top Customer; what will make them switch?
- Defend your Market Share or Win Competitors
- Get a Scorecard for Target Partners

Custom Market Research Services
We Will Customise The Research For You, In Case The Report Listed Above Does Not Meet With Your Requirements
Get 10% Free CustomisationTESTIMONIALS

We at Nissan Chemicals Corporation have been clients of MarketsandMarkets for more than a year now. We recently consulted MarketsandMarkets for a study, the team at MarketsandMarkets was extremely professional and organized. The business insights were very detailed and aligned well with our expectations that really helped us formulate the Business Plans and device new strategies for development themes. MarketsandMarkets offers a unique combination of expertise and dedicated engagement model. Their research findings have helped us in designing our Pricing Strategy which will make it easier for us to predict the future sales and profits for the next ten years. We look forward to working with MarketsandMarkets in the future.
VP of Strategy & New Business Development
Leading Specialty Chemical Company
The MarketsandMarkets Engagement Model, composed of both the Knowledge Store and advisory custom research, has greatly helped us in understanding our markets and making strategic decisions. The Knowledge Store is a fast way to allow everyone in our organization to understand more about most any market they are interested in. The ability to then get custom research done and get answers to specific strategic questions and market insight has been spectacular. The Markets and Markets team feel more like colleagues than vendors and their services have helped us change our culture where statements of things like growth opportunities and competitive position are always backed by industry research.

Rich Gibson,
Director, Corporate Strategy
Milliken & Company,
Leading Industrial Manufacturer of specialty chemical, floor covering, performance and protective textile materials, and healthcaremilliken.com
MarketsandMarkets is a trusted resource that helps us to better understand markets that are near-adjacencies-whether its technology, value chain or geography. Their Knowledge Store platform provides a dashboard of markets and their characteristics which is easy to use and saves us time.
Adam Shaw,
Market Development and Strategy Manager
AdvanSix Inc. USA,
An American Leader in Chemicalswww.advansix.com
The Knowledge Store from MarketsandMarkets is a valuable tool which has helped my team acquire greater insight in to the end markets that our business serves. This has enabled us to help our company build stronger strategies throughout our planning process.
TOSHIO KINOSHITA
Senior Chif Consultion Research & Consulting Division
Mitsubishi Chemical Research Corporation,
Leading Manufacturer of Chemical Productswww.mitsubishichem-res.co.jp/en/

We recently engaged with MarketsandMarkets for a study, the team not only clearly understood our business objectives but was also extremely professional in the way they handled the entire project. The study was efficiently conducted in a phase-wise manner, and the engagement model furnished us with high-quality business insights that far exceeded our expectations at each phase. We were especially happy that MarketsandMarkets could provide us with both, an English as well as a Japanese version of the study. A special thanks to the Analyst Team and Client Services Team, whose fluency in Japanese enhanced our comfort level, as we could converse with them in our preferred language.
Independent entrepreneurs
Arrow Precision
We approached MarketsandMarkets for study on Proppants Market, and their work exceeded our expectations. The study conducted was comprehensive and enabled us to view the market through the various dimensions. In addition, the team was extraordinarily responsive throughout the process and resolved our queries on time. I strongly recommend MarketsandMarkets and will certainly consider them for additional market assessments we will need in the future.
Global engineering company, Japan
Deputy Manager,
Strategic Planning OfficeThe high-quality insights shared by the MarketsandMarkets team helped us understand the pharmaceutical plant designers in a specific geography. It also captured the risks that we may likely face in communicating with our potential partners. The study would enable us identify partners, which would impact our future growth.


Growth opportunities and latent adjacency in Battery Electrolyte Market