European Food Safety Testing Market By Contaminant (Pathogen, GMO, Toxin, Pesticide), Technology (Traditional & Rapid), Food Type (Meat & Poultry Product, Dairy Product, Fruit & Vegetable, Processed Food) & Country - Trends & Forecast To 2018


The European food safety testing market is driven by the stringent food safety regulations imposed by European Food Safety Authority (EFSA) to prevent increasing outbreaks of foodborne illnesses and poisoning. The EFSA specifies that food manufacturers in Europe are responsible for safety of food that further helps to drive the market. The report briefly describes the European food safety regulations based on the contaminants present in food products.
The global issue of GMOs and potential health risks upon consumption of contaminated foods are the significant drivers of European food safety testing market. The report describes the market in terms of both value and volume. The market segments include contaminants, technologies, food types, and regions. The report spans the market for five leading food safety testing countries such as U.K., Germany, France, Italy, and Poland. The report explicitly describes the market for technologies used to test for contaminants in different food types and contaminants tested in food types and countries.
In 2012, salmonella testing accounted for major share in the European market. The application of rapid technology for contaminant testing has been increasing. The report provides analysis on the key players, technologies, and developments in the European food safety testing market. The report also includes the preferred competitive strategies adopted by the leading players to garner a larger share in the market.
Customer Interested in this report also can view
Food Safety Testing Market by Contaminant (Pathogen, GMO, Toxin, Pesticide, Others), Technology (Traditional & Rapid), Food Type (Meat & Poultry, Dairy, Fruit & Vegetable, Convenience Food, Others) & Region - Global Trends & Forecast to 2019
North American Food Safety Testing Market by Contaminants (Pathogen, GMO, Toxin, Pesticide), Technology (Traditional & Rapid), Food Types (Meat & Poultry, Dairy, Fruit & Vegetable, Processed Food) & Geography –Trends & Forecast to 2018
Impact Analysis: China Food Safety Testing Market & Regulations
The European food safety testing market is growing significantly, driven by rigorous implementation of the food safety regulations to ensure the safety of food and globalization of food supply. The consumer demand for food safety in Europe has also been increasing the food safety testing market. The contamination of food products with genetically modified food and their unknown effect upon consumption has been driving the food safety testing demand in the market. Introduction of new and advanced technology for safety testing has been further helping in the growth of the market.
The European food safety testing market include testing for contaminants such as pathogens, toxins, genetically modified food, pesticides, and other contaminants in the food products such as meat & poultry products, dairy products, processed foods, and fruit & vegetable, etc. The technology for safety testing include traditional and rapid technology methods such as convenience-based, PCR-based, immunoassay-based, and other rapid methods such as HPLC, GC, etc.
FOOD SAFETY TESTING: MARKET REVENUE, BY COUNTRIES, 2012 - 2018 ($MILLION)
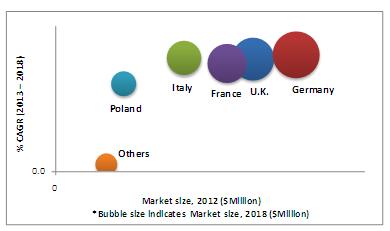
Source: MarketsandMarkets Analysis
The food safety testing market is projected to grow reach to $4,068.8 million by 2018. In 2012, Germany was the largest market for food safety testing and it is projected to be the fastest growing market in Europe. In 2012, U.K. was second largest market followed by the France. In 2012, contaminant testing in fruit and vegetable was the largest segment in European market.
FOOD SAFETY TESTING MARKET SHARE, BY FOOD TYPES, 2012
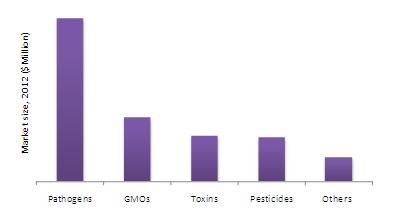
Source: MarketsandMarkets Analysis
In 2012, pathogen testing dominated European food safety testing market followed by GMOs testing. Pathogen safety testing in food samples was dominated by salmonella testing as the largest segment. The leading market players have been using strategies such as new product/service launch to detect the presence of contaminants in the food samples to strengthen their position in the market.
 Exclusive indicates content/data unique to MarketsandMarkets and not available with any competitors.
Table Of Contents
1 Introduction (Page No. - 26)
1.1 Key Take-Aways
1.2 Report Description
1.3 Stakeholders
1.4 Research Methodology
1.4.1 Markets Covered
1.4.2 Market Size
1.4.3 Primary Sources
1.4.4 Secondary Sources
1.4.5 Key Data Points Validated From Primary Sources
1.4.6 Key Data Points Validated From Secondary Sources
1.4.7 Key Questions Answered
2 Executive Summary (Page No. - 35)
3 Premium Insights (Page No. - 39)
4 Market Overview (Page No. - 53)
4.1 Introduction
4.2 Burning Issues
4.2.1 Proposed Eu-U.S. Free Trade Agreement
4.2.2 Time Consuming Procedure
4.3 Winning Imperatives
4.3.1 Consolidation Strategy
4.3.2 Certification & Accreditation
4.4 Impact Analysis
4.5 Drivers
4.5.1 Increase In Outbreak Of Foodborne Illness
4.5.2 Implementation Of Stringent Food Safety Regulations
4.5.3 Globalization Of Food Supply
4.5.4 Media Influence On Consumer Awareness For Food Safety
4.6 Restraint
4.6.1 Lack Of Centralized Food Safety Approach
4.7 Opportunities
4.7.1 Breakthrough Technology & Service
4.7.2 Integrated Food Safety Approach
4.7.3 Increasing Consumer Awareness For Food Safety
4.8 Porter’s Five Forces Model
4.8.1 Degree Of Competition
4.8.2 Bargaining Power Of Suppliers
4.8.3 Bargaining Power Of Buyers
4.8.4 Threat Of Substitutes
4.8.5 Threat Of New Entrants
4.9 Market Share Analysis
4.10 Value Chain Analysis
4.11 Patent Analysis
5 Food Safety Testing Market, By Contaminants (Page No. - 77)
5.1 Introduction
5.2 Pathogens
5.2.1 Pathogenesis Of Common Pathogens
5.2.2 Salmonella
5.2.2.1 Pathogenesis Of Salmonella
5.2.2.2 France Dominated Salmonella Safety Testing Market
5.2.3 E. Coli
5.2.3.1 Pathogenesis Of E. Coli
5.2.4 Listeria
5.2.4.1 Pathogenesis Of Listeria
5.2.5 Campylobacter
5.3 Pesticides
5.4 GMOS
5.5 Toxins
6 Food Safety Testing Market, By Technologies (Page No. - 203)
6.1 Introduction
6.2 Traditional Technology
6.3 Rapid Technology
6.3.1 Convenience-Based Technology
6.3.2 Pcr-Based Technology
6.3.3 Immunoassay-Based Technology
6.3.4 Other Rapid Methods
7 Food Safety Testing Market, By Food Types (Page No. - 258)
7.1 Introduction
7.2 Meat & Poultry Products
7.3 Dairy Products
7.4 Processed Food
7.5 Fruit & Vegetable
8 Food Safety Testing Market, By Countries (Page No. - 287)
8.1 Introduction
8.2 U.K.
8.3 Germany
8.4 France
8.5 Italy
8.6 Poland
8.7 Others
9 Regulations (Page No. - 320)
9.1 Introduction
9.2 General Food Law For Safety Of Food
9.3 Contaminants Related Regulations
9.3.1 Contaminants Regulation
9.3.2 The Microbiological Criteria Regulation
9.3.3 Food Contaminants Regulation
9.3.4 Melamine Legislation
9.3.5 Gmos Regulation
9.3.6 Toxins Regulations
9.3.6.1 Ochratoxin A
9.3.6.2 Dioxin & Pbcs
9.3.6.3 Fusarium Toxins
9.3.6.4 Aflatoxins
9.3.6.5 Polycyclic Aromatic Hydrocarbons (PAH)
9.3.7 Pathogen Related Legislations
9.3.7.1 Salmonella Legislation
9.3.7.2 E. Coli Legislation
9.3.7.3 Campylobacter Legislation
9.3.7.4 Listeria Legislation
9.4 New Law On Food Information To Consumers
10 Competitive Landscape (Page No. - 330)
10.1 Introduction
10.2 New Products/Services Launches – Most Preferred Strategic Approach
10.3 Key Market Strategies
10.4 Mergers & Acquisitions
10.5 Agreements, Partnerships & Collaborations
10.6 New Service Launches/Developments
10.7 Investments & Expansions
11 Company Profiles (Overview, Financials, Products & Services, Strategy, And Developments)* (Page No. - 345)
11.1 ALS Limited
11.2 Bio-Rad Laboratories
11.3 Bureau Veritas SA
11.4 Campden BRI
11.5 Det Norske Veritas As (Dnv)
11.6 Eurofins Central Analytical Laboratories Inc.
11.7 Genevac Ltd
11.8 Genon Laboratories Ltd
11.9 IFP Institut Für Produktqualität Gmbh
11.10 ILS Limited
11.11 Intertek Group Plc
11.12 Lloyd’s Register Quality Assurance Limited
11.13 SGS S.A.
11.14 Silliker Inc.
*Details On Overview, Financials, Product & Services, Strategy, And Developments Might Not Be Captured In Case Of Unlisted Companies.
Appendix (Page No. - 407)
Europe Patents
List Of Tables (229 Tables)
Table 1 Key Assumptions Made For This Report
Table 2 Food Safety Testing: Market Revenue ($Million) & Volume (Million Tests), 2011 – 2018
Table 3 Food Safety Testing: Market Revenue, By Contaminants, 2011 – 2018 ($Million)
Table 4 Food Safety Testing: Market Volume, By Contaminants, 2011 – 2018 (Million Tests)
Table 5 Pathogenesis Of Common Pathogens
Table 6 Pathogens: Food Safety Testing Market Revenue, By Subtypes, 2011 – 2018 ($Million)
Table 7 Pathogens: Food Safety Testing Market Volume, By Subtypes, 2011 – 2018 (Million Tests)
Table 8 U.K: Pathogen Food Safety Testing Market Revenue, By Subtypes, 2011 – 2018 ($Million)
Table 9 U.K: Pathogen Food Safety Testing Market Volume, By Subtypes, 2011 – 2018 (Million Tests)
Table 10 U.K: Pathogen Food Safety Testing Market Revenue, By Food Types, 2011 – 2018 ($Million)
Table 11 U.K: Pathogen Food Safety Testing Market Volume, By Food Types, 2011 – 2018 (Million Tests)
Table 12 Germany: Pathogen Food Safety Testing Market Revenue, By Subtypes, 2011 – 2018 ($Million)
Table 13 Germany: Pathogen Food Safety Testing Market Volume, By Subtypes, 2011 – 2018 (Million Tests)
Table 14 Germany: Pathogen Food Safety Testing Market Revenue, By Food Types, 2011 – 2018 ($Million)
Table 15 Germany: Pathogen Food Safety Testing Market Volume, By Food Types, 2011 – 2018 (Million Tests)
Table 16 Italy: Pathogen Food Safety Testing Market Revenue, By Subtypes, 2011 – 2018 ($Million)
Table 17 Italy: Pathogen Food Safety Testing Market Volume, By Subtypes, 2011 – 2018 (Million Tests)
Table 18 Italy: Pathogen Food Safety Testing Market Revenue, By Food Types, 2011 – 2018 ($Million)
Table 19 Italy: Pathogen Food Safety Testing Market Volume, By Food Types, 2011 – 2018 (Million Tests)
Table 20 France: Pathogen Food Safety Testing Market Revenue, By Subtypes, 2011 – 2018 ($Million)
Table 21 France: Pathogen Food Safety Testing Market Volume, By Subtypes, 2011 – 2018 (Million Tests)
Table 22 France: Pathogen Food Safety Testing Market Revenue, By Food Types, 2011 – 2018 ($Million)
Table 23 France: Pathogen Food Safety Testing Market Volume, By Food Types, 2011 – 2018 (Million Tests)
Table 24 Poland: Pathogen Food Safety Testing Market Revenue, By Subtypes, 2011 – 2018 ($Million)
Table 25 Poland: Pathogen Food Safety Testing Market Volume, By Subtypes, 2011 – 2018 (Million Tests)
Table 26 Poland: Pathogen Food Safety Testing Market Revenue, By Food Types, 2011 – 2018 ($Million)
Table 27 Poland: Pathogen Food Safety Testing Market Volume, By Food Types, 2011 – 2018 (Million Tests)
Table 28 Salmonella: Food Safety Testing Market Revenue, By Food Types, 2011 – 2018 ($Million)
Table 29 Salmonella: Food Safety Testing Market Volume, By Food Types, 2011 – 2018 (Million Tests)
Table 30 U.K: Salmonella Food Safety Testing Market Revenue, By Food Types, 2011 – 2018 ($Million)
Table 31 U.K: Salmonella Food Safety Testing Market Volume, By Food Types, 2011 – 2018 (Million Tests)
Table 32 Germany: Salmonella Food Safety Testing Market Revenue, By Food Types, 2011 – 2018 ($Million)
Table 33 Germany: Salmonella Food Safety Testing Market Volume, By Food Types, 2011 – 2018 (Million Tests)
Table 34 France: Salmonella Food Safety Testing Market Revenue, By Food Types, 2011 – 2018 ($Million)
Table 35 France: Salmonella Food Safety Testing Market Volume, By Food Types, 2011 – 2018 (Million Tests)
Table 36 Italy: Salmonella Food Safety Testing Market Revenue, By Food Types, 2011 – 2018 ($Million)
Table 37 Italy: Salmonella Food Safety Testing Market Volume, By Food Types, 2011 – 2018 (Million Tests)
Table 38 Poland: Salmonella Food Safety Testing Market Revenue, By Food Types, 2011 – 2018 ($Million)
Table 39 Poland: Salmonella Food Safety Testing Market Volume, By Food Types, 2011 – 2018 (Million Tests)
Table 40 E. Coli: Food Safety Testing Market Revenue, By Food Types, 2011 – 2018 ($Million)
Table 41 E. Coli: Food Safety Testing Market Volume, By Food Types, 2011 – 2018 (Million Tests)
Table 42 U.K: E. Coli Food Safety Testing Market Revenue, By Food Types, 2011 – 2018 ($Million)
Table 43 U.K: E. Coli Food Safety Testing Market Volume, By Food Types, 2011 – 2018 (Million Tests)
Table 44 Germany: E. Coli Food Safety Testing Market Revenue, By Food Types, 2011 – 2018 ($Million)
Table 45 Germany: E. Coli Food Safety Testing Market Volume, By Food Types, 2011 – 2018 (Million Tests)
Table 46 France: E. Coli Food Safety Testing Market Revenue, By Food Types, 2011 – 2018 ($Million)
Table 47 France: E. Coli Food Safety Testing Market Volume, By Food Types, 2011 – 2018 (Million Tests)
Table 48 Italy: E. Coli Food Safety Testing Market Revenue, By Food Types, 2011 – 2018 ($Million)
Table 49 Italy: E. Coli Food Safety Testing Market Volume, By Food Types, 2011 – 2018 (Million Tests)
Table 50 Poland: E. Coli Food Safety Testing Market Revenue, By Food Types, 2011 – 2018 ($Million)
Table 51 Poland: E. Coli Food Safety Testing Market Volume, By Food Types, 2011 – 2018 (Million Tests)
Table 52 Listeria: Food Safety Testing Market Revenue, By Food Types, 2011 – 2018 ($Million)
Table 53 Listeria: Food Safety Testing Market Volume, By Food Types, 2011 – 2018 (Million Tests)
Table 54 U.K: Listeria Food Safety Testing Market Revenue, By Food Types, 2011 – 2018 ($Million)
Table 55 U.K: Listeria Food Safety Testing Market Volume, By Food Types, 2011 – 2018 (Million Tests)
Table 56 Germany: Listeria Food Safety Testing Market Revenue, By Food Types, 2011 – 2018 ($Million)
Table 57 Germany: Listeria Food Safety Testing Market Volume, By Food Types, 2011 – 2018 (Million Tests)
Table 58 France: Listeria Food Safety Testing Market Revenue, By Food Types, 2011 – 2018 ($Million)
Table 59 France: Listeria Food Safety Testing Market Volume, By Food Types, 2011 – 2018 (Million Tests)
Table 60 Italy: Listeria Food Safety Testing Market Revenue, By Food Types, 2011 – 2018 ($Million)
Table 61 Italy: Listeria Food Safety Testing Market Volume, By Food Types, 2011 – 2018 (Million Tests)
Table 62 Poland: Listeria Food Safety Testing Market Revenue, By Food Types, 2011 – 2018 ($Million)
Table 63 Poland: Listeria Food Safety Testing Market Volume, By Food Types, 2011 – 2018 (Million Tests)
Table 64 Campylobacter: Food Safety Testing Market Revenue, By Food Types, 2011 – 2018 ($Million)
Table 65 Campylobacter: Food Safety Testing Market Volume, By Food Types, 2011 – 2018 (Million Tests)
Table 66 U.K: Campylobacter Food Safety Testing Market Revenue, By Food Types, 2011 – 2018 ($Million)
Table 67 U.K: Campylobacter Food Safety Testing Market Volume, By Food Types, 2011 – 2018 (Million Tests)
Table 68 Germany: Campylobacter Food Safety Testing Market Revenue, By Food Types, 2011 – 2018 ($Million)
Table 69 Germany: Campylobacter Food Safety Testing Market Volume, By Food Types, 2011 – 2018 (Million Tests)
Table 70 France: Campylobacter Food Safety Testing Market Revenue, By Food Types, 2011 – 2018 ($Million)
Table 71 France: Campylobacter Food Safety Testing Market Volume, By Food Types, 2011 – 2018 (Million Tests)
Table 72 Italy: Campylobacter Food Safety Testing Market Revenue, By Food Types, 2011 – 2018 ($Million)
Table 73 Italy: Campylobacter Food Safety Testing Market Volume, By Food Types, 2011 – 2018 (Million Tests)
Table 74 Poland: Campylobacter Food Safety Testing Market Revenue, By Food Types, 2011 – 2018 ($Million)
Table 75 Poland: Campylobacter Safety Testing Market Volume, By Food Types, 2011 – 2018 (Million Tests)
Table 76 List Of Pesticides Banned Under Eu Directive 79/117/Eec
Table 77 Pesticides: Food Safety Testing Market Revenue, By Food Types, 2011 – 2018 ($Million)
Table 78 Pesticides: Food Safety Testing Market Volume, By Food Types, 2011 – 2018 (Million Tests)
Table 79 U.K: Pesticides Food Safety Testing Market Revenue, By Food Types, 2011 – 2018 ($Million)
Table 80 U.K: Pesticides Food Safety Testing Market Volume, By Food Types, 2011 – 2018 (Million Tests)
Table 81 Germany: Pesticides Food Safety Testing Market Revenue, By Food Types, 2011 – 2018 ($Million)
Table 82 Germany: Pesticides Food Safety Testing Market Volume, By Food Types, 2011 – 2018 (Million Tests)
Table 83 France: Pesticides Food Safety Testing Market Revenue, By Food Types, 2011 – 2018 ($Million) 171
Table 84 France: Pesticides Food Safety Testing Market Volume, By Food Types, 2011 – 2018 (Million Tests)
Table 85 Italy: Pesticides Food Safety Testing Market Revenue, By Food Types, 2011 – 2018 ($Million) 173
Table 86 Italy: Pesticides Food Safety Testing Market Volume, By Food Types, 2011 – 2018 (Million Tests)
Table 87 Poland: Pesticides Food Safety Testing Market Revenue, By Food Types, 2011 – 2018 ($Million) 175
Table 88 Poland: Pesticides Food Safety Testing Market Volume, By Food Types, 2011 – 2018 (Million Tests)
Table 89 GMOS: Food Safety Testing Market Revenue, By Food Types, 2011 – 2018 ($Million)
Table 90 GMOS: Food Safety Testing Market Volume, By Food Types, 2011 – 2018 (Million Tests)
Table 91 U.K: GMOS Food Safety Testing Market Revenue, By Food Types, 2011 – 2018 ($Million)
Table 92 U.K: GMOS Food Safety Testing Market Volume, By Food Types, 2011 – 2018 (Million Tests)
Table 93 Germany: GMOS Food Safety Testing Market Revenue, By Food Types, 2011 – 2018 ($Million)
Table 94 Germany: GMOS Food Safety Testing Market Volume, By Food Types, 2011 – 2018 (Million Tests)
Table 95 France: GMOS Food Safety Testing Market Revenue, By Food Types, 2011 – 2018 ($Million)
Table 96 France: GMOS Food Safety Testing Market Volume, By Food Types, 2011 – 2018 (Million Tests)
Table 97 Italy: GMOS Food Safety Testing Market Revenue, By Food Types, 2011 – 2018 ($Million)
Table 98 Italy: GMOS Food Safety Testing Market Volume, By Food Types, 2011 – 2018 (Million Tests)
Table 99 Poland: GMOS Food Safety Testing Market Revenue, By Food Types, 2011 – 2018 ($Million)
Table 100 Poland: GMOS Food Safety Testing Market Volume, By Food Types, 2011 – 2018 (Million Tests)
Table 101 Toxins: Food Safety Testing Market Revenue, By Food Types, 2011 – 2018 ($Million)
Table 102 Toxins: Food Safety Testing Market Volume, By Food Types, 2011 – 2018 (Million Tests)
Table 103 U.K: Toxins Food Safety Testing Market Revenue, By Food Types, 2011 – 2018 ($Million)
Table 104 U.K: Toxins Food Safety Testing Market Volume, By Food Types, 2011 – 2018 (Million Tests)
Table 105 Germany: Toxins Food Safety Testing Market Revenue, By Food Types, 2011 – 2018 ($Million) 195
Table 106 Germany: Toxins Food Safety Testing Market Volume, By Food Types, 2011 – 2018 (Million Tests)
Table 107 France: Toxins Food Safety Testing Market Revenue, By Food Types, 2011 – 2018 ($Million)
Table 108 France: Toxins Food Safety Testing Market Volume, By Food Types, 2011 – 2018 (Million Tests)
Table 109 Italy: Toxins Food Safety Testing Market Revenue, By Food Types, 2011 – 2018 ($Million)
Table 110 Italy: Toxins Food Safety Testing Market Volume, By Food Types, 2011 – 2018 (Million Tests)
Table 111 Poland: Toxins Food Safety Testing Market Revenue, By Food Types, 2011 – 2018 ($Million)
Table 112 Poland: Toxins Food Safety Testing Market Volume, By Food Types, 2011 – 2018 (Million Tests)
Table 113 Food Safety Testing: Market Revenue, By Technologies, 2011 – 2018 ($Million)
Table 114 Food Safety Testing: Market Volume, By Technologies, 2011 – 2018 (Million Tests)
Table 115 Traditional Technology: Market Revenue, By Countries, 2011 – 2018 ($Million)
Table 116 Traditional Technology: Market Volume, By Countries, 2011 – 2018 (Million Tests)
Table 117 Traditional Technology: Market Revenue, By Contaminants, 2011 – 2018 ($Million)
Table 118 Traditional Technology: Market Volume, By Contaminants, 2011 – 2018 (Million Tests)
Table 119 Rapid Technology: Market Revenue, By Countries, 2011 – 2018 ($Million)
Table 120 Rapid Technology: Market Volume, By Countries, 2011 – 2018 (Million Tests)
Table 121 Rapid Technology: Market Revenue, By Subtypes, 2011 – 2018 ($Million)
Table 122 Rapid Technology: Market Volume, By Subtypes, 2011 – 2018 (Million Tests)
Table 123 Rapid Technology: Market Revenue, By Contaminants, 2011 – 2018 ($Million)
Table 124 Rapid Technology: Market Volume, By Contaminants, 2011 – 2018 (Million Tests)
Table 125 Rapid Technology: Market Revenue, By Pathogens, 2011 – 2018 ($Million)
Table 126 Rapid Technology: Market Volume, By Pathogens, 2011 – 2018 (Million Tests)
Table 127 Convenience-Based Food Safety Tests
Table 128 Convenience-Based Technology: Market Revenue, By Countries, 2011 – 2018 ($Million)
Table 129 Convenience-Based Technology: Market Volume, By Countries, 2011 – 2018 (Million Tests)
Table 130 Convenience-Based Technology: Market Revenue, By Contaminants, 2011 – 2018 ($Million)
Table 131 Convenience-Based Technology: Market Volume, By Contaminants, 2011 – 2018 (Million Tests)
Table 132 Convenience-Based Technology: Market Revenue, By Pathogens, 2011 – 2018 ($Million)
Table 133 Convenience-Based Technology: Market Volume, By Pathogens, 2011 – 2018 (Million Tests)
Table 134 PCR Method Work Flow
Table 135 PCR Technology: Suppliers For Various Pathogens
Table 136 PCR-Based Technology: Market Revenue, By Countries, 2011 – 2018 ($Million)
Table 137 PCR-Based Technology: Market Volume, By Countries, 2011 – 2018 (Million Tests)
Table 138 PCR-Based Technology: Market Revenue, By Contaminants, 2011 – 2018 ($Million)
Table 139 PCR-Based Technology: Market Volume, By Contaminants, 2011 – 2018 (Million Tests)
Table 140 PCR-Based Technology: Market Revenue, By Pathogens, 2011 – 2018 ($Million)
Table 141 PCR-Based Technology: Market Volume, By Pathogens, 2011 – 2018 (Million Tests)
Table 142 Suppliers Of Immunoassay In Food Pathogens & Toxins
Table 143 Immunoassay-Based Technology: Market Revenue, By Countries, 2011 – 2018 ($Million)
Table 144 Immunoassay-Based Technology: Market Volume, By Countries, 2011 – 2018 (Million Tests)
Table 145 Immunoassay-Based Technology: Market Revenue, By Contaminants, 2011 – 2018 ($Million)
Table 146 Immunoassay-Based Technology: Market Volume, By Contaminants, 2011 – 2018 (Million Tests)
Table 147 Immunoassay-Based Technology: Market Revenue, By Pathogens, 2011 – 2018 ($Million)
Table 148 Immunoassay-Based Technology: Market Volume, By Pathogens, 2011 – 2018 (Million Tests)
Table 149 Other Rapid Methods: Market Revenue, By Countries, 2011 – 2018 ($Million)
Table 150 Other Rapid Methods: Market Volume, By Countries, 2011 – 2018 (Million Tests)
Table 151 Other Rapid Methods: Market Revenue, By Contaminants, 2011 – 2018 ($Million)
Table 152 Other Rapid Methods: Market Volume, By Contaminants, 2011 – 2018 (Million Tests)
Table 153 Other Rapid Methods: Market Revenue, By Pathogens, 2011 – 2018 ($Million)
Table 154 Other Rapid Methods: Market Volume, By Pathogens, 2011 – 2018 (Million Tests)
Table 155 Food Safety Testing Market: Selected Pathogens, By Food Sources
Table 156 Food Safety Testing: Market Revenue, By Food Types, 2011 – 2018 ($Million)
Table 157 Food Safety Testing: Market Volume, By Food Types, 2011 – 2018 ($Million)
Table 158 Meat & Poultry Products: Food Safety Testing Market Revenue, By Countries, 2011 – 2018 ($Million)
Table 159 Meat & Poultry Products: Food Safety Testing Market Volume, By Countries, 2011 – 2018 (Million Tests)
Table 160 Meat & Poultry Products: Food Safety Testing Market Revenue, By Contaminants, 2011 – 2018 ($Million)
Table 161 Meat & Poultry Products: Food Safety Testing Market Volume, By Contaminants, 2011 – 2018 (Million Tests)
Table 162 Dairy Products: Food Safety Testing Market Revenue, By Countries, 2011 – 2018 ($Million)
Table 163 Dairy Products: Food Safety Testing Market Volume, By Countries, 2011 – 2018 (Million Tests)
Table 164 Dairy Products: Food Safety Testing Market Revenue, By Contaminants, 2011 – 2018 ($Million)
Table 165 Dairy Products: Food Safety Testing Market Volume, By Contaminants, 2011 – 2018 (Million Tests)
Table 166 Processed Food: Food Safety Testing Market Revenue, By Countries, 2011 – 2018 ($Million)
Table 167 Processed Food: Food Safety Testing Market Volume, By Countries, 2011 – 2018 (Million Tests)
Table 168 Processed Food: Food Safety Testing Market Revenue, By Contaminants, 2011 – 2018 ($Million)
Table 169 Processed Food: Food Safety Testing Market Volume, By Contaminants, 2011 – 2018 (Million Tests)
Table 170 Fruit & Vegetable: Food Safety Testing Market Revenue, By Countries, 2011 – 2018 ($Million)
Table 171 Fruit & Vegetable: Food Safety Testing Market Volume, By Countries, 2011 – 2018 (Million Tests)
Table 172 Fruit & Vegetable: Food Safety Testing Market Revenue, By Contaminants, 2011 – 2018 ($Million)
Table 173 Fruit & Vegetable: Food Safety Testing Market Volume, By Contaminants, 2011 – 2018 (Million Tests)
Table 174 Food Safety Testing: Market Revenue, By Countries, 2011 – 2018 ($Million)
Table 175 Food Safety Testing: Market Volume, By Countries, 2011 – 2018 (Million Tests)
Table 176 U.K: Food Safety Testing Market Revenue, By Contaminants, 2011 – 2018 ($Million)
Table 177 U.K: Food Safety Testing Market Volume, By Contaminants, 2011 – 2018 (Million Tests)
Table 178 U.K: Food Safety Testing Market Revenue, By Food Types, 2011 – 2018 ($Million)
Table 179 U.K: Food Safety Testing Market Volume, By Food Types, 2011 – 2018 (Million Tests)
Table 180 Germany: Food Safety Testing Market Revenue, By Contaminants, 2011 – 2018 ($Million)
Table 181 Germany: Food Safety Testing Market Volume, By Contaminants, 2011 – 2018 (Million Tests)
Table 182 Germany: Food Safety Testing Market Revenue, By Food Types, 2011 – 2018 ($Million)
Table 183 Germany: Food Safety Testing Market Volume, By Food Types, 2011 – 2018 (Million Tests)
Table 184 France: Food Safety Testing Market Revenue, By Contaminants, 2011 – 2018 ($Million)
Table 185 France: Food Safety Testing Market Volume, By Contaminants, 2011 – 2018 (Million Tests)
Table 186 France: Food Safety Testing Market Revenue, By Food Types, 2011 – 2018 ($Million)
Table 187 France: Food Safety Testing Market Volume, By Food Types, 2011 – 2018 (Million Tests)
Table 188 Italy: Food Safety Testing Market Revenue, By Contaminants, 2011 – 2018 ($Million)
Table 189 Italy: Food Safety Testing Market Volume, By Contaminants, 2011 – 2018 (Million Tests)
Table 190 Italy: Food Safety Testing Market Revenue, By Food Types, 2011 – 2018 ($Million)
Table 191 Italy: Food Safety Testing Market Volume, By Food Types, 2011 – 2018 (Million Tests)
Table 192 Poland: Food Safety Testing Market Revenue, By Contaminants, 2011 – 2018 ($Million)
Table 193 Poland: Food Safety Testing Market Volume, By Contaminants, 2011 – 2018 (Million Tests)
Table 194 Poland: Food Safety Testing Market Revenue, By Food Types, 2011 – 2018 ($Million)
Table 195 Poland: Food Safety Testing Market Volume, By Food Types, 2011 – 2018 (Million Tests)
Table 196 Others: Food Safety Testing Market Revenue, By Contaminants, 2011 – 2018 ($Million)
Table 197 Others: Food Safety Testing Market Volume, By Contaminants, 2011 – 2018 (Million Tests)
Table 198 Others: Food Safety Testing Market Revenue, By Food Types, 2011 – 2018 ($Million)
Table 199 Others: Food Safety Testing Market Volume, By Food Types, 2011 – 2018 (Million Tests)
Table 200 Food Safety Testing: Maximum Level For Melamine & Its Structural Analogues
Table 201 GMOS: Labeling Requirement
Table 202 Commission Regulation For Ochratoxin A
Table 203 Mergers & Acquisitions, 2009 – 2013
Table 204 Agreements, Partnerships & Collaborations, 2009 – 2013
Table 205 New Service Launches/Developments, 2009 – 2013
Table 206 Investments & Expansions, 2011 – 2013
Table 207 ALS: Annual Revenue, By Business Segments, 2011 - 2012 ($Million)
Table 208 ALS: Annual Revenue, By Countries, 2011 - 2012 ($Million)
Table 209 Bio-Rad: Annual Revenue, By Business Segments, 2011 - 2012 ($Million)
Table 210 Bio-Rad: Annual Revenue, By Geography, 2011 - 2012 ($Million)
Table 211 Bio-Rad: Products & Services
Table 212 Bureau Veritas: Annual Revenue, By Business Segments, 2011 - 2012 ($Million)
Table 213 Bureau Veritas: Annual Revenue, By Geography, 2011 - 2012 ($Million)
Table 214 Campden: Annual Revenue, By Geography, 2010 - 2011 ($Million)
Table 215 Campden: Services & Its Descriptions
Table 216 DNV: Annual Revenue, By Geography, 2011 – 2012 ($Million)
Table 217 DNV: Certification Services & Its Descriptions
Table 218 Eurofins: Annual Revenue, By Geography, 2011 - 2012 ($Million)
Table 219 Eurofins: Services & Its Descriptions
Table 220 Genon: Services & Its Descriptions
Table 221 IFP: Services & Its Descriptions
Table 222 ILS: Services & Its Descriptions
Table 223 Intertek: Annual Revenue, By Business Segments, 2011 – 2012 ($Million)
Table 224 Intertek: Annual Revenue, By Geography, 2011 - 2012 ($Million)
Table 225 Intertek: Services & Its Descriptions
Table 226 SGS: Annual Revenue, By Business Segments, 2011 - 2012 ($Million)
Table 227 SGS: Annual Revenue, By Geography, 2011 - 2012 ($Million)
Table 228 SGS: Services & Its Descriptions
Table 229 Silliker: Products & Services
List Of Figures (61 Figures)
Figure 1 Research Methodology
Figure 2 Food Safety Testing: Market Share, By Contaminants, 2012
Figure 3 Food Safety Testing: Market Segmentation
Figure 4 Food Safety Testing: Market Revenue, By Countries, 2012 – 2018 ($Million)
Figure 5 Food Safety Testing: Market Volume, By Countries, 2012 – 2018 (Million Tests)
Figure 6 Food Safety Testing: Life Cycle, By Countries, 2012 – 2018
Figure 7 Food Safety Testing: Market Share, By Food Types, 2012
Figure 8 Food Safety Testing: Market Revenue, By Countries & Food Types, 2012 ($Million)
Figure 9 Food Safety Testing: Market Share, By Technologies & Subtypes, 2012
Figure 10 Traditional Technology: European Food Safety Testing Market Revenue, By Countries, 2012 – 2018 ($Million)
Figure 11 Rapid Technology: European Food Safety Testing Market Share, By Contaminants, 2012
Figure 12 Rapid Technology: European Food Safety Testing Market Revenue, By Subtypes & Pathogens, 2012 ($Million)
Figure 13 Food Safety Testing: Market Revenue, By Countries & Contaminants, 2012 ($Million)
Figure 14 Food Safety Testing: Market Revenue, By Pathogens & Food Types, 2012 ($Million)
Figure 15 Food Safety Testing: Patent Analysis, By Year, 2009 – 2013
Figure 16 Food Safety Testing: Market Share & Strategy Analysis
Figure 17 Food Safety Testing: Market Segments
Figure 18 Food Safety: Accreditations & Certifications Framework
Figure 19 Food Safety Testing: Impact Analysis Of DRO'S
Figure 20 Food Safety Inspection Rate & Incidence Of Foodborne Illness, By Pathogens (Per 100,000 Population)
Figure 21 Food Safety: Top Concerns Of Consumers
Figure 22 Porter’s Five Forces Analysis
Figure 23 Food Safety Testing: Market Share Analysis, By Companies, 2012
Figure 24 Value Chain Analysis Of Food Safety Testing
Figure 25 Food Safety Testing: Patent Analysis, By Years, 2009 – 2013
Figure 26 Food Safety Testing: Patent Analysis, By Companies, 2009 – 2013
Figure 27 Food Safety Testing: Patent Analysis, By Contaminants, 2009 – 2013
Figure 28 Food Safety Testing Market Share, By Contaminants, 2012
Figure 29 Food Safety Testing: Market Revenue, By Pathogens, 2012 – 2018 ($Million)
Figure 30 Salmonella: Food Safety Testing, Market Revenue, By Food Types & Countries, 2012 ($Million)
Figure 31 Transmission Cycle Of ETEC
Figure 32 Listeria: Food Safety Testing Market Share, By Food Types, 2012
Figure 33 Campylobacter: Food Safety Testing Market Revenue, 2011 – 2018 ($Million)
Figure 34 Key Factors Responsible For Food Contamination & Foodborne Illness
Figure 35 Food Safety Testing: Market Share, By Technologies, 2012
Figure 36 Traditional Food Safety Testing: Market Share, 2012
Figure 37 Rapid Food Safety Testing: Market Revenue, By Contaminants, 2012 – 2018 ($Million)
Figure 38 Rapid Food Safety Testing: Market Share, By Subtypes, 2012
Figure 39 Convenience-Based: Food Safety Testing Market Revenue, 2012 – 2018 ($Million)
Figure 40 Other Rapid Tests: Food Safety Testing Market Share, By Contaminants, 2012
Figure 41 Stages Of Food Contamination
Figure 42 Food Safety Testing: Market Share, By Food Types, 2012
Figure 43 Bacterial Contamination Of Meat & Poultry Products, By Slaughter Process Stages
Figure 44 Meat & Poultry Products: Food Safety Testing Market Share, By Contaminants, 2012
Figure 45 Dairy Products: Food Safety Testing Market Revenue, 2012 ($Million)
Figure 46 Processed Food: Food Safety Testing Market Revenue, By Contaminants, 2012 – 2018 ($Million)
Figure 47 Fruit & Vegetable: Food Safety Testing Market Share, By Countries, 2012
Figure 48 U.K: Food Safety Testing Market Share, By Food Types, 2012
Figure 49 Germany: Pathogen Testing Market Share, By Food Types, 2012
Figure 50 France: Food Safety Testing Market Revenue, By Contaminants, 2012 – 2018 ($Million)
Figure 51 Italy: Food Safety Testing Market Volume, By Contaminants, 2013 (Million Tests)
Figure 52 Poland: Food Safety Testing Market Revenue, By Contaminants, 2012 – 2018 ($Million)
Figure 53 Role Of EFSA To Reduce Campylobacteriosis
Figure 54 Food Safety Testing: Market Share, By Growth Strategies, 2009 – 2013
Figure 55 Food Safety Testing: Annual Market Developments, By Growth Strategies, 2009 – 2013
Figure 56 Food Safety Testing: Market Growth Strategies, By Companies, 2009 – 2013
Figure 57 Bio-Rad: SWOT Analysis
Figure 58 Campden: SWOT Analysis
Figure 59 Eurofins: SWOT Analysis
Figure 60 Intertek: SWOT Analysis
Figure 61 SGS: SWOT Analysis


Growth opportunities and latent adjacency in European Food Safety Testing Market