European Smart Home Market by Lighting Controls, Smart Speakers, Entertainment Controls, HVAC Controls, Security & Access Control, Smart Kitchen, Home Healthcare, Smart Furniture, Home Appliances, Wired, Behavioral, Proactive - Global Forecast to 2030

icon1
USD 32.67
MARKET SIZE, 2030
icon2
CAGR 6.6%
(2025-2030)
icon3
254
REPORT PAGES
icon4
157
MARKET TABLES

OVERVIEW

european-smart-homes-market Overview

Source: Secondary Research, Interviews with Experts, MarketsandMarkets Analysis

The European smart home market is projected to grow from USD 23.73 billion in 2025 to USD 32.67 billion by 2030 at a CAGR of 6.6% during the forecast period. Growth is driven by the rising adoption of connected home technologies, smart energy management systems, and home automation devices that enhance user comfort, convenience, and energy efficiency. Government-led initiatives promoting smart grids, renewable integration, and sustainable housing development across countries such as Germany, France, and the UK are fueling market demand. Furthermore, AI-based predictive control, IoT-enabled sensors, and cloud-integrated monitoring platforms are improving real-time energy optimization, reducing wastage, and supporting Europe’s long-term decarbonization and digital transformation goals in the residential sector.

KEY TAKEAWAYS

  • BY COUNTRY
    The Rest of Europe is projected to register the fastest growth of CAGR of 8.7%
  • BY PRODUCT
    By product, the entertainment & other controls segment dominates the market with share of ~33% in 2024.
  • BY SALES CHANNEL
    By sales channel, the market for indirect sales id projected to grow at a CAGR of 7.2%
  • BY PROTOCOL
    By protocol, the wired segment dominates the market with share of ~55% in 2024.
  • BY INSTALLATION TYPE
    By installation type, the new installations segment dominates the market with share of ~66% in 2024.
  • BY RESIDENCE TYPE
    By residence type, the market for multi-family residence segment is projected to grow at a CAGR of 7.2%
  • BY SYSTEM TYPE
    By system type, the behavioural segment dominates the market with share of ~95% in 2024.
  • COMPETITIVE LANDSCAPE
    Company ohnson Controls Inc., Schneider Electric, and ASSA ABLOY were identified as star players in the european smart home market (global) given their strong market share and product footprint. Companies tado GmbH, Withings, and Netatmo have distinguished themselves among startups and SMEs by securing strong footholds in specialized niche areas, underscoring their potential as emerging market leaders

The European smart home market is projected to grow significantly over the next decade, driven by the rapid integration of smart building technologies, the expansion of sustainable urban infrastructure, and the increasing focus on energy-efficient and connected residential ecosystems. Ongoing government initiatives toward smart city development and renewable energy integration are further supporting market growth.

TRENDS & DISRUPTIONS IMPACTING CUSTOMERS' CUSTOMERS

The smart home and connected living vertical primarily includes residential property developers, home automation integrators, energy management service providers, and public utility agencies. Smart home systems are being widely adopted across these segments to enable centralized control, energy optimization, and enhanced occupant comfort. In addition, new opportunities are emerging with the integration of AI-driven analytics, IoT-based sensing networks, and cloud-enabled home management platforms for real-time monitoring and automation. These innovations are shaping the next generation of intelligent and sustainable home ecosystems, improving energy efficiency, security, and convenience while reducing operational costs for both homeowners and real estate developers across Europe.

european-smart-homes-market Disruptions

Source: Secondary Research, Interviews with Experts, MarketsandMarkets Analysis

MARKET DYNAMICS

Drivers
Impact
Level
  • Rising need for energy saving and low-carbon-emission-oriented solutions
  • Proliferation of smartphones and smart gadgets
RESTRAINTS
Impact
Level
  • Expenses associated with smart gadgets
  • High cost of ownership of home automation systems
OPPORTUNITIES
Impact
Level
  • Implementation of energy efficiency measures
  • Rising adoption of smart lighting systems
CHALLENGES
Impact
Level
  • Lack of developments in common standards and communication protocols
  • Increase in vulnerability to hacking

Source: Secondary Research, Interviews with Experts, MarketsandMarkets Analysis

Driver: Rising need for energy saving and low-carbon-emission-oriented solutions.

The European smart home market is being increasingly driven by the growing consumer focus on energy conservation, sustainability, and connected comfort. Rising implementation of EU energy directives and green building standards (such as EPBD and Fit for 55) is encouraging the adoption of IoT-enabled smart home devices for optimized energy use and carbon reduction. The integration of AI-driven home management platforms and predictive control systems is further enhancing automation, efficiency, and sustainability in residential spaces.

Restraint: Expenses associated with smart gadgets

Despite technological advances, high upfront costs for smart devices and integration across legacy infrastructure remain major barriers to adoption, particularly in older European homes. The lack of standardized communication protocols across various device ecosystems often leads to compatibility and interoperability challenges, slowing the pace of connected system deployment and long-term scalability.

Opportunity: Implementation of energy efficiency measures

Growing emphasis on renewable energy adoption, smart grid connectivity, and government-led sustainability programs is unlocking new opportunities for smart home providers. Public–private partnerships (PPPs) across the EU are fostering large-scale deployments of AI- and IoT-powered home automation systems, enabling energy sharing, demand response, and integration with rooftop solar and EV charging networks. Vendors offering cloud-connected analytics and interoperable home ecosystems are expected to gain a strong competitive edge.

Challenge: Lack of developments in common standards and communication protocols

As European consumers increasingly rely on connected and cloud-based smart home platforms, concerns regarding data protection and cybersecurity have grown significantly. Compliance with frameworks such as the General Data Protection Regulation (GDPR) and the upcoming Cyber Resilience Act is becoming crucial for vendors. Additionally, the lack of unified standards for AI-driven automation and IoT device interoperability continues to pose challenges for seamless communication between devices from different manufacturers.

SMART HOMES IN EUROPE MARKET SIZE, SHARE & TRENDS: COMMERCIAL USE CASES ACROSS INDUSTRIES

COMPANY USE CASE DESCRIPTION BENEFITS
Deployment of smart home energy management systems across residential projects in Sweden, integrating lighting, heating, and water management via IoT-enabled meters and sensors. Improved household energy efficiency and water conservation, 20% reduction in energy usage, and enhanced sustainability compliance in line with Sweden’s green energy initiatives.
Implementation of connected workplace automation across European office campuses, integrating smart lighting, HVAC scheduling, and occupancy-based energy control. Achieved 25–30% reduction in facility energy costs, improved indoor comfort for employees, and enhanced operational transparency through real-time data insights.
Integration of AI-driven smart home devices across residential and hospitality facilities for automated lighting, climate, and security control through mobile and voice-enabled interfaces. 18% improvement in energy efficiency, lower maintenance costs, and elevated guest experience through intelligent and customizable automation features.
Deployment of community-wide smart home ecosystems in residential neighborhoods and educational facilities, connecting IoT sensors for lighting, ventilation, and energy analytics. 25% improvement in energy efficiency, optimized living and learning conditions, and reduced energy waste through predictive automation and analytics.
Implementation of IoT-enabled smart home and building systems across student dormitories and classrooms, automating lighting, HVAC, and appliance control through smart devices. 15–20% reduction in overall utility costs, improved occupant safety, and enhanced environmental comfort supporting digital campus sustainability goals.

Logos and trademarks shown above are the property of their respective owners. Their use here is for informational and illustrative purposes only.

MARKET ECOSYSTEM

The European smart home ecosystem comprises established providers such as Siemens, ABB, Honeywell, Schneider Electric, Bosch, Legrand, and NXP. The synergy among these players is unlocking new opportunities across areas such as AI-driven home energy optimization, IoT-enabled sensor networks, cloud-based automation platforms, and predictive maintenance analytics. These companies are continuously enhancing their portfolios with interoperable solutions, open-protocol architectures, and integrated home energy management systems, driving efficiency, sustainability, and digital transformation across the European residential and commercial smart living segments

european-smart-homes-market Ecosystem

Logos and trademarks shown above are the property of their respective owners. Their use here is for informational and illustrative purposes only.

MARKET SEGMENTS

european-smart-homes-market Segments

Source: Secondary Research, Interviews with Experts, MarketsandMarkets Analysis

European smart home market, By Product

The entertainment and other controls segment accounted for a significant market share in 2024, driven by the growing demand for real-time energy monitoring, HVAC optimization, and intelligent lighting control. The shift toward AI- and IoT-enabled analytics is enhancing interoperability and enabling predictive maintenance and sustainability-focused energy management across residential and commercial spaces.

European smart home market, By Sales Channel

The indirect sales segment held a significant market share in 2024, supported by widespread deployment across retail stores, offices, and hospitality facilities. Increasing integration of BAS-based HVAC, lighting, and security systems is driving energy savings, reducing operational costs, and enhancing occupant comfort. Additionally, the industrial segment is witnessing growing adoption of automation technologies for energy optimization, safety monitoring, and compliance.

European smart home market, By Protocol

The wired segment accounted for the largest share in 2024 due to its reliability, data security, and suitability for large residential complexes and mixed-use developments. However, the wireless segment is projected to grow rapidly owing to the increasing adoption of IoT-connected sensors, Wi-Fi, and Bluetooth-based systems that enable flexible installation and seamless connectivity. Service providers are focusing on cloud interoperability, AI-based fault detection, and remote management platforms to enhance efficiency and user experience.

European smart home market, By Installation type

The new installation segment held the largest market share in 2024, driven by the rapid construction of energy-efficient residential complexes and smart city projects integrating AI-based control systems for energy, lighting, and home security management.

European smart home market, By Residence Type

The multi-family residence segment accounted for a significant market share in 2024, supported by increasing demand for shared energy optimization systems, centralized HVAC management, and security automation solutions across apartment complexes and housing communities.

European smart home market, By System Type

The behavioral segment held a significant share in 2024, driven by growing consumer adoption of connected devices and mobile applications that provide real-time energy tracking and personalized comfort control. Meanwhile, the proactive segment is gaining momentum through AI-enabled automation platforms capable of predicting usage patterns, reducing energy waste, and improving sustainability performance.

REGION

Germany in Europe is expected to register the highest CAGR in the global European smart home market during the forecast period.

Germany in the Europe region held the fastest growth, driven by strong government focus on carbon-neutral housing, renewable energy adoption, and sustainable urban infrastructure development. The country’s leadership in green building certifications, smart grid expansion, and IoT-enabled home automation programs is fueling large-scale smart home deployment across residential and mixed-use spaces. Government incentives promoting energy-efficient retrofitting, combined with advancements in AI-based home energy management, smart lighting, and HVAC control systems, are accelerating adoption across both single-family and multi-family residences. Additionally, the integration of renewable energy sources and cloud-connected platforms is enhancing home efficiency and user comfort, positioning Germany as a frontrunner in sustainable smart living innovation within the European market 

The Asia Pacific smart home market is projected to reach USD 41.05 billion by 2030 from USD 27.77 billion in 2025, at a CAGR of 8.1 % from 2025 to 2030. The market is primarily driven by rapid urbanization, rising disposable incomes, and a growing middle-class population, which is increasing the demand for connected comfort and lifestyle enhancement technologies. Additionally, strong government smart city initiatives, expanding broadband/5G infrastructure, and a heightened focus on energy efficiency and security are accelerating adoption of smart lighting, HVAC control, security systems, and IoT-enabled home automation across the region.

The North America smart home market is projected to reach USD 45.68 billion by 2030 from USD 32.58 billion in 2025, at a CAGR of 7.0% from 2025 to 2030. Growth is due to the high disposable income and strong consumer spending support early adoption of smart home technologies. Homeowners are increasingly investing in smart security, energy management, and convenience solutions. Widespread availability of high-speed internet and strong penetration of smartphones and voice assistants make smart home systems easy to deploy and use

 
european-smart-homes-market Region

SMART HOMES IN EUROPE MARKET SIZE, SHARE & TRENDS: COMPANY EVALUATION MATRIX

In the European smart home market, Johnson Controls (Star) holds a leading position with a strong global presence, comprehensive product portfolio, and proven expertise in integrated home automation systems, HVAC optimization, and smart energy management solutions. The company’s continued focus on system interoperability, digital twin integration, and AI-enabled analytics has reinforced its position as a top-tier provider across residential and mixed-use buildings. SimpliSafe, Inc. (Emerging Leader) is demonstrating notable momentum through innovations in connected home security, IoT-enabled sensors, and scalable cloud-based monitoring platforms, gaining significant traction among energy-efficient and smart living projects across Europe

european-smart-homes-market Evaluation Metrics

Source: Secondary Research, Interviews with Experts, MarketsandMarkets Analysis

KEY MARKET PLAYERS

MARKET SCOPE

REPORT METRIC DETAILS
Market Size in 2025 (Value) USD 23.73 Billion
Market Forecast in 2030 (Value) USD 32.67 Billion
Growth Rate CAGR of 6.6% from 2025-2030
Years Considered 2021-2030
Base Year 2024
Forecast Period 2025-2030
Units Considered Value (USD Billion), Volume (Million Units)
Report Coverage Revenue forecast, company ranking, competitive landscape, growth factors, and trends
Segments Covered
  • Product:
    • Lighting Controls
    • Security & Access Control
    • HVAC Controls
    • Entertainment & Other Controls
    • Home Healthcare
    • Smart Kitchen
    • Home Appliances
    • Smart Furniture
    • Smart Speakers
  • Protocol:
    • Wired
    • Wireless
  • Sales Channel:
    • Direct Sales
    • Indirect Sales
  • System Type:
    • Behavioral
    • Proactive
  • Installation Type:
    • New Installations
    • Retrofit Installations
  • Residence Type:
    • Single-family Residence
    • Multi-family Residence
Regional Scope UK, Germany, France, Italy, Rest of Europe

WHAT IS IN IT FOR YOU: SMART HOMES IN EUROPE MARKET SIZE, SHARE & TRENDS REPORT CONTENT GUIDE

european-smart-homes-market Content Guide

DELIVERED CUSTOMIZATIONS

We have successfully delivered the following deep-dive customizations:

CLIENT REQUEST CUSTOMIZATION DELIVERED VALUE ADDS
Smart home device manufacturer In-depth competitive profiling of leading European smart home vendors across lighting, HVAC, and energy management systems. Conducted strategic roadmap assessment for next-generation connected devices integrating AI, IoT, and cloud-based analytics. Included M&A and partnership landscape analysis for regional expansion and technology collaboration. Identified emerging product innovation clusters in Western Europe
Property developer / facility operator Detailed benchmarking of smart home and automation deployments across multi-residential and commercial complexes Conducted cost–benefit evaluation of IoT-enabled HVAC, lighting, and security integration
Energy and housing ministry / smart city authority Conducted policy and infrastructure readiness mapping for nationwide smart home deployments Evaluated interoperability and data protection frameworks aligned with GDPR
Technology provider / IoT platform integrator Performed market mapping of connected home platforms covering AI-based automation software, cloud-enabled data analytics, and mobile app interoperability Conducted evaluation of cybersecurity frameworks and IoT data compliance mechanisms for European markets.

RECENT DEVELOPMENTS

  • March 2025 : Amazon India launched the Echo Spot, a smart alarm clock. The Echo Spot is designed as a smart alarm clock with a customizable display, available in Black and Blue
  • March 2025 : Yale from ASSA ABLOY launched Yale Smart Lock with Matter, its next-generation smart lock designed specifically for Google Home and Matter-enabled smart home platforms. This new product represents a significant evolution from the popular Nest x Yale Lock, offering enhanced compatibility, improved features, and future-proof connectivity for smart home users
  • March 2025 : Honeywell launched Honeywell Home X2S smart thermostat during the CES 2025. The thermostat is designed for easy installation and features a simple display with buttons, differentiating it from more high-tech models like the Google Nest Learning Thermostat, which typically utilize touchscreens


Table of Contents

Exclusive indicates content/data unique to MarketsandMarkets and not available with any competitors.

TITLE
PAGE NO
1
INTRODUCTION


27
2
RESEARCH METHODOLOGY


32
3
EXECUTIVE SUMMARY


46
4
PREMIUM INSIGHTS


49
5
MARKET OVERVIEW
Explore the booming smart home market driven by energy efficiency, despite cost and compatibility hurdles.


53
 
5.1
INTRODUCTION


5.2
MARKET DYNAMICS


5.2.1
DRIVERS


5.2.1.1
RISING NEED FOR ENERGY-SAVING AND LOW-CARBON-EMISSION-ORIENTED SOLUTIONS


5.2.1.2
PROLIFERATION OF SMARTPHONES AND SMART GADGETS


5.2.1.3
GROWING ADOPTION OF DIY HOME MONITORING SYSTEMS


5.2.1.4
RISING ADOPTION OF SAFETY DEVICES WITH URBANIZATION AND GLOBALIZATION


5.2.2
RESTRAINTS


5.2.2.1
EXPENSES ASSOCIATED WITH SMART GADGETS


5.2.2.2
HIGH COST OF OWNERSHIP OF HOME AUTOMATION SYSTEMS


5.2.2.3
COMPLEXITIES IN INSTALLING SMART HOME DEVICES


5.2.3
OPPORTUNITIES


5.2.3.1
IMPLEMENTATION OF ENERGY EFFICIENCY MEASURES


5.2.3.2
RISING ADOPTION OF SMART LIGHTING SYSTEMS


5.2.3.3
DEVELOPMENT OF AMBIENT ASSISTANT LIVING-FRIENDLY SOLUTIONS


5.2.4
CHALLENGES


5.2.4.1
LACK OF DEVELOPMENTS IN COMMON STANDARDS AND COMMUNICATION PROTOCOLS


5.2.4.2
INCREASE IN VULNERABILITY TO HACKING


5.2.4.3
RETROFITTING EXISTING HOMES


5.2.4.4
COMPATIBILITY ISSUES OF SMART HOME PRODUCTS


5.3
TRENDS/DISRUPTIONS IMPACTING CUSTOMER BUSINESS


5.4
PRICING ANALYSIS


5.4.1
AVERAGE SELLING PRICE TREND OF SMART LOCKS, BY KEY PLAYER, 2019–2023


5.4.2
AVERAGE SELLING PRICE TREND OF SMART HOMES, BY PRODUCT, 2020–2023


5.4.3
AVERAGE SELLING PRICE TREND FOR LIGHTING CONTROL PRODUCTS, BY COUNTRY, 2020–2023


5.5
SUPPLY CHAIN ANALYSIS


5.6
ECOSYSTEM ANALYSIS


5.7
INVESTMENT AND FUNDING SCENARIO


5.8
TECHNOLOGY ANALYSIS


5.8.1
KEY TECHNOLOGIES


5.8.1.1
VOICE ASSISTANTS


5.8.2
COMPLEMENTARY TECHNOLOGIES


5.8.2.1
BIG DATA ANALYTICS


5.8.3
ADJACENT TECHNOLOGIES


5.8.3.1
BIOMETRIC AUTHENTICATION


5.8.3.2
AR AND VR


5.9
PATENT ANALYSIS


5.10
TRADE ANALYSIS


5.10.1
IMPORT DATA (HS CODE 8517)


5.10.2
EXPORT DATA (HS CODE 8517)


5.11
KEY CONFERENCES AND EVENTS, 2024–2025


5.12
CASE STUDY ANALYSIS


5.12.1
ASSA ABLOY'S REMOTE ACCESS DELEGATION REVOLUTIONIZES EMERGENCY SERVICES GLOBALLY


5.12.2
JOHNSON CONTROLS' COOLING SOLUTION ENABLES FISERV TO OVERCOME MAINTENANCE ISSUES AND SAVE ENERGY


5.12.3
FUNCTION CONTROL LTD OFFERS HOMEOWNERS IN SCOTLAND INTEGRATED SMART HOME SOLUTIONS FOR SEAMLESS USER EXPERIENCES


5.12.4
LEGRAND'S SMART HOME SOLUTION TRANSFORMS UNIQUE PROPERTY INTO AUTOMATED LIVING SPACE


5.13
TARIFF AND REGULATORY LANDSCAPE


5.13.1
TARIFF ANALYSIS (HS CODE 8517)


5.13.2
REGULATORY BODIES, GOVERNMENT AGENCIES, AND OTHER ORGANIZATIONS


5.13.3
STANDARDS


5.14
PORTER'S FIVE FORCES ANALYSIS


5.14.1
INTENSITY OF COMPETITIVE RIVALRY


5.14.2
BARGAINING POWER OF SUPPLIERS


5.14.3
BARGAINING POWER OF BUYERS


5.14.4
THREAT OF SUBSTITUTES


5.14.5
THREAT OF NEW ENTRANTS


5.15
KEY STAKEHOLDERS AND BUYING CRITERIA


5.15.1
KEY STAKEHOLDERS IN BUYING PROCESS


5.15.2
BUYING CRITERIA


5.16
IMPACT OF AI/GENERATIVE AI ON EUROPEAN SMART HOME MARKET


6
EUROPEAN SMART HOME MARKET, BY PROTOCOL
Market Size & Growth Rate Forecast Analysis to 2029 in USD Million | 2 Data Tables


92
 
6.1
INTRODUCTION


6.2
WIRED


6.2.1
INCREASING IMPLEMENTATION IN HIGH-BANDWIDTH APPLICATIONS TO DRIVE MARKET


6.2.2
DALI


6.2.3
NEMA


6.2.4
KNX


6.2.5
DMX


6.2.6
LONWORKS


6.2.7
ETHERNET


6.2.8
MODBUS


6.2.9
BACNET


6.2.10
BLACK BOX


6.2.11
PLC


6.3
WIRELESS


6.3.1
RISING DEMAND FOR SECURED AND HIGH-SPEED SOLUTIONS TO FOSTER MARKET GROWTH


6.3.2
ZIGBEE


6.3.3
Z-WAVE


6.3.4
WI-FI


6.3.5
BLUETOOTH


6.3.6
ENOCEAN


6.3.7
THREAD


6.3.8
INFRARED


6.3.9
MQTT


7
EUROPEAN SMART HOME MARKET, BY SALES CHANNEL
Market Size & Growth Rate Forecast Analysis to 2029 in USD Million | 2 Data Tables


104
 
7.1
INTRODUCTION


7.2
DIRECT SALES


7.2.1
GROWING DEMAND FOR PERSONALIZED SMART SOLUTIONS TO FOSTER MARKET GROWTH


7.3
INDIRECT SALES


7.3.1
RISING ADOPTION OF E-COMMERCE PLATFORMS TO DRIVE MARKET


8
EUROPEAN SMART HOME MARKET, BY PRODUCT
Market Size & Growth Rate Forecast Analysis to 2029 in USD Million and Units | 136 Data Tables


107
 
8.1
INTRODUCTION


8.2
LIGHTING CONTROLS


8.2.1
RELAYS


8.2.1.1
RISING ADOPTION OF IOT-ENABLED APPLIANCES AND SYSTEMS TO SUPPORT MARKET GROWTH


8.2.2
OCCUPANCY SENSORS


8.2.2.1
GROWING NEED TO MINIMIZE ENERGY CONSUMPTION AND IMPROVE USABILITY AND CONTROL TO FOSTER MARKET GROWTH


8.2.3
DAYLIGHT SENSORS


8.2.3.1
PRESSING NEED FOR EFFICIENT ELECTRICITY USAGE TO FUEL MARKET GROWTH


8.2.4
TIMERS


8.2.4.1
INCREASING USE IN INDOOR AND OUTDOOR LIGHTING, HEAT LAMPS, AND HOT TUBS TO FOSTER MARKET GROWTH


8.2.5
DIMMERS


8.2.5.1
ABILITY TO INCREASE OPERATIONAL LIFESPAN OF LAMPS TO DRIVE MARKET


8.2.6
SWITCHES


8.2.6.1
GROWING NEED TO REDUCE CABLING COSTS TO FUEL MARKET GROWTH


8.2.7
ACCESSORIES & OTHER PRODUCTS


8.3
SECURITY & ACCESS CONTROLS


8.3.1
VIDEO SURVEILLANCE


8.3.1.1
RISING EMPHASIS ON DEVELOPING DIGITAL SYSTEMS TO FOSTER MARKET GROWTH


8.3.2
ACCESS CONTROLS


8.3.2.1
INCREASING NEED TO ENHANCE SECURITY TO ACCELERATE DEMAND


8.3.2.1.1
HARDWARE


8.3.2.1.2
SOFTWARE


8.3.2.1.3
SERVICES
 
 
8.4
HVAC CONTROLS


8.4.1
SMART THERMOSTATS


8.4.1.1
ABILITY TO LEARN AND ADAPT TO BEHAVIOR OF END USERS TO DRIVE MARKET


8.4.2
SENSORS


8.4.2.1
RISING NEED TO FACILITATE VENTILATION FOR INDOOR AIR QUALITY AND TEMPERATURE TO FUEL DEMAND


8.4.3
CONTROL VALVES


8.4.3.1
RISING NEED TO REGULATE FLOW OF FLUIDS TO FOSTER MARKET GROWTH


8.4.4
HEATING & COOLING COILS


8.4.4.1
RISING EMPHASIS ON ACHIEVING SUSTAINABLE GOALS TO FUEL MARKET GROWTH


8.4.5
DAMPERS


8.4.5.1
INCREASING NEED TO REGULATE AIRFLOW INSIDE AIR HANDLING EQUIPMENT TO FOSTER MARKET GROWTH


8.4.6
ACTUATORS


8.4.6.1
RISING APPLICATION FOR CONTROLLING DAMPERS AND VALVES IN HVAC SYSTEMS TO ACCELERATE DEMAND


8.4.7
PUMPS & FANS


8.4.7.1
INTEGRATION OF IOT-ENABLED PUMPS AND FANS TO OFFER LUCRATIVE GROWTH OPPORTUNITIES


8.4.8
SMART VENTS


8.4.8.1
RISING DEMAND FOR EASY-TO-INSTALL EQUIPMENT TO FOSTER MARKET GROWTH


8.5
ENTERTAINMENT & OTHER CONTROLS


8.5.1
ENTERTAINMENT CONTROLS


8.5.1.1
AUDIO & VOLUME CONTROLS


8.5.1.1.1
ONGOING TECHNOLOGICAL ADVANCEMENTS TO OFFER LUCRATIVE GROWTH OPPORTUNITIES


8.5.1.2
HOME THEATER SYSTEM CONTROLS


8.5.1.2.1
INCREASING DEMAND TO ELIMINATE WIRE INSTALLATIONS TO FOSTER SEGMENTAL GROWTH


8.5.1.3
TOUCHSCREENS & KEYPADS


8.5.1.3.1
RISING DEMAND FOR CUSTOMIZED DEVICES TO FUEL MARKET GROWTH


8.5.2
OTHER CONTROLS


8.5.2.1
SMART METERS


8.5.2.1.1
INCREASING AWARENESS ABOUT ENVIRONMENTAL ISSUES TO FOSTER MARKET GROWTH


8.5.2.2
SMART PLUGS


8.5.2.2.1
GROWING NEED FOR EFFICIENT MANAGEMENT OF ENERGY USAGE TO OFFER LUCRATIVE GROWTH OPPORTUNITIES


8.5.2.3
SMART HUBS


8.5.2.3.1
RISING APPLICATIONS OF UNIFYING CONNECTED GADGETS IN SMART HOMES TO DRIVE MARKET


8.5.2.4
SMOKE DETECTORS


8.5.2.4.1
STRINGENT FIRE SAFETY REGULATIONS TO ACCELERATE DEMAND
 
 
8.6
SMART SPEAKERS


8.6.1
ABILITY TO REGULATE SMART DEVICES THROUGH USER VOICE CONTROL TO DRIVE MARKET


8.7
HOME HEALTHCARE APPLIANCES


8.7.1
HEALTH STATUS MONITORS


8.7.1.1
GROWING EMPHASIS ON PREVENTIVE HEALTHCARE TO BOOST DEMAND


8.7.1.2
FITNESS AND HEART RATE MONITORS


8.7.1.3
BLOOD PRESSURE MONITORS


8.7.1.4
BLOOD GLUCOSE METERS


8.7.1.5
CONTINUOUS GLUCOSE MONITORS


8.7.1.6
PULSE OXIMETERS


8.7.1.7
FALL DETECTORS


8.7.2
PHYSICAL ACTIVITY MONITORS


8.7.2.1
INCREASING SIGNIFICANCE OF PHYSICAL ACTIVITY AND OVERALL HEALTH TO DRIVE MARKET


8.8
SMART KITCHEN APPLIANCES


8.8.1
SMART REFRIGERATORS


8.8.1.1
ADVENT OF WI-FI-ENABLED TOUCHSCREEN REFRIGERATORS TO OFFER LUCRATIVE MARKET GROWTH


8.8.2
SMART COFFEE MAKERS


8.8.2.1
INCREASING DEMAND FOR BLUETOOTH-ENABLED COFFEE MAKERS TO FUEL MARKET GROWTH


8.8.3
SMART KETTLES


8.8.3.1
RISING DEMAND FOR WI–FI KETTLES TO SEGMENTAL GROWTH


8.8.4
SMART DISHWASHERS


8.8.4.1
ABILITY TO PROVIDE REAL-TIME INFORMATION ON ENERGY CONSUMPTION AND ENERGY EFFICIENCY TO BOOST DEMAND


8.8.5
SMART OVENS


8.8.5.1
ABILITY TO CONTROL COOKING TIME AND TEMPERATURE REMOTELY TO ACCELERATE DEMAND


8.8.6
SMART COOKTOPS


8.8.6.1
RISING CONSUMER PREFERENCE FOR CONVENIENCE AND TIME-SAVING SOLUTIONS TO SPUR DEMAND


8.8.7
SMART COOKERS


8.8.7.1
ABILITY TO ADJUST TEMPERATURE REMOTELY TO ACCELERATE DEMAND


8.9
HOME APPLIANCES


8.9.1
SMART WASHERS


8.9.1.1
INCREASING DEMAND FOR SMART STATS, SMART ASSISTANTS, AND SMART DISPENSERS TO FUEL MARKET GROWTH


8.9.2
SMART DRYERS


8.9.2.1
ADVENT OF SMART ALERT SYSTEMS TO OFFER LUCRATIVE GROWTH OPPORTUNITIES


8.9.3
SMART WATER HEATERS


8.9.3.1
SURGING DEMAND FOR COST -AND ENERGY-EFFICIENT DEVICES TO DRIVE MARKET


8.9.4
SMART VACUUM CLEANERS


8.9.4.1
RISING INTEGRATION OF CAMERAS AND MICROPHONES INTO SMART VACUUM CLEANERS TO OFFER LUCRATIVE GROWTH OPPORTUNITIES


8.10
SMART FURNITURE


8.10.1
SMART TABLES


8.10.1.1
ABILITY TO OFFER EASY ONLINE ACCESS TO USERS TO DRIVE MARKET


8.10.2
SMART DESKS


8.10.2.1
GROWING NEED TO TACKLE BACKACHES AND EYE STRAINS TO FUEL MARKET GROWTH


8.10.3
SMART STOOLS & BENCHES


8.10.3.1
RISING DEMAND FOR USER-FRIENDLY ENVIRONMENTS TO FUEL MARKET GROWTH


8.10.4
SMART SOFAS


8.10.4.1
ABILITY TO INTERACT WITH DIFFERENT SMART DEVICES AT HOME TO FOSTER MARKET GROWTH


8.10.5
SMART CHAIRS


8.10.5.1
ABILITY TO MONITOR SITTING POSTURE ACCURATELY AND NON-INVASIVELY TO FOSTER MARKET GROWTH


9
EUROPEAN SMART HOME MARKET, BY SYSTEM TYPE
Market Size & Growth Rate Forecast Analysis to 2029 in USD Million | 2 Data Tables


177
 
9.1
INTRODUCTION


9.2
BEHAVIORAL


9.2.1
INCREASING CONNECTIVITY BETWEEN MACHINE-TO-MACHINE SOLUTIONS AND IOT TO FOSTER MARKET GROWTH


9.3
PROACTIVE


9.3.1
EFFICIENT TRANSMISSION OF ENERGY CONSUMPTION DATA TO END USERS TO FUEL MARKET GROWTH


10
EUROPEAN SMART HOME MARKET, BY INSTALLATION TYPE
Market Size & Growth Rate Forecast Analysis to 2029 in USD Million | 2 Data Tables


181
 
10.1
INTRODUCTION


10.2
NEW INSTALLATIONS


10.2.1
SUITABILITY FOR OUTDOOR ENVIRONMENTS TO FOSTER MARKET GROWTH


10.3
RETROFIT INSTALLATIONS


10.3.1
RISING NEED TO DECREASE HEAT EMISSIONS AND LOWER ENERGY USAGE TO DRIVE MARKET


11
EUROPEAN SMART HOME MARKET, BY RESIDENCE TYPE
Market Size & Growth Rate Forecast Analysis to 2029 in USD Million | 2 Data Tables


184
 
11.1
INTRODUCTION


11.2
SINGLE-FAMILY RESIDENCE


11.2.1
RISING EMPHASIS ON REDUCING CARBON FOOTPRINTS TO DRIVE MARKET


11.3
MULTI-FAMILY RESIDENCE


11.3.1
ENHANCED OWNER EXPERIENCE TO FUEL MARKET GROWTH


12
EUROPEAN SMART HOME MARKET, BY COUNTRY
Market Size & Growth Rate Forecast Analysis to 2029 in USD Million | 13 Data Tables


188
 
12.1
INTRODUCTION


12.2
MACROECONOMIC OUTLOOK FOR EUROPE


12.3
UK


12.3.1
MANDATORY COMPLIANCE WITH BUILDING SAFETY REGULATIONS TO FUEL MARKET GROWTH


12.4
GERMANY


12.4.1
ADOPTION OF ZERO-ENERGY SYSTEMS AND DEVELOPMENT OF SMART CITIES TO DRIVE MARKET


12.5
FRANCE


12.5.1
RISING INSTALLATION OF SECURITY SYSTEMS IN CONVENTIONAL BUILDINGS TO OFFER LUCRATIVE GROWTH OPPORTUNITIES


12.6
ITALY


12.6.1
GOVERNMENT-LED INITIATIVES TO PROMOTE IMPROVED DESIGNS AND MANAGEMENT OF LIGHTING SYSTEMS TO FUEL MARKET GROWTH


12.7
REST OF EUROPE


13
COMPETITIVE LANDSCAPE
Uncover market dominance shifts and strategic wins in the competitive landscape's financial matrix.


200
 
13.1
OVERVIEW


13.2
KEY PLAYER STRATEGIES/RIGHT TO WIN, 2020–2024


13.3
MARKET SHARE ANALYSIS, 2023


13.4
REVENUE ANALYSIS, 2019–2023


13.5
COMPANY VALUATION AND FINANCIAL METRICS, 2024


13.6
BRAND COMPARISON


13.7
COMPANY EVALUATION MATRIX: KEY PLAYERS, 2023


13.7.1
STARS


13.7.2
EMERGING LEADERS


13.7.3
PERVASIVE PLAYERS


13.7.4
PARTICIPANTS


13.7.5
COMPANY FOOTPRINT: KEY PLAYERS, 2023


13.7.5.1
COMPANY FOOTPRINT


13.7.5.2
PRODUCT FOOTPRINT


13.7.5.3
SYSTEM TYPE FOOTPRINT


13.7.5.4
SALES CHANNEL FOOTPRINT


13.7.5.5
INSTALLATION TYPE FOOTPRINT


13.8
COMPANY EVALUATION MATRIX: STARTUPS/SMES, 2023


13.8.1
PROGRESSIVE COMPANIES


13.8.2
RESPONSIVE COMPANIES


13.8.3
DYNAMIC COMPANIES


13.8.4
STARTING BLOCKS


13.8.5
COMPETITIVE BENCHMARKING: STARTUPS/SMES, 2023


13.8.5.1
DETAILED LIST OF KEY STARTUPS/SMES


13.8.5.2
COMPETITIVE BENCHMARKING OF KEY STARTUPS/SMES


13.9
COMPETITIVE SCENARIOS


13.9.1
PRODUCT LAUNCHES/DEVELOPMENTS


13.9.2
DEALS


13.9.3
OTHER DEVELOPMENTS


14
COMPANY PROFILES
In-depth Company Profiles of Leading Market Players with detailed Business Overview, Product and Service Portfolio, Recent Developments, and Unique Analyst Perspective (MnM View)


220
 
14.1
KEY PLAYERS


14.1.1
JOHNSON CONTROLS


14.1.1.1
BUSINESS OVERVIEW


14.1.1.2
PRODUCTS/SOLUTIONS/SERVICES OFFERED


14.1.1.3
RECENT DEVELOPMENTS


14.1.1.3.1
PRODUCT LAUNCHES/DEVELOPMENTS


14.1.1.3.2
DEALS


14.1.1.4
MNM VIEW


14.1.1.4.1
KEY STRENGTHS/RIGHT TO WIN


14.1.1.4.2
STRATEGIC CHOICES


14.1.1.4.3
WEAKNESSES/COMPETITIVE THREATS


14.1.2
SCHNEIDER ELECTRIC


14.1.3
HONEYWELL INTERNATIONAL INC.


14.1.4
ASSA ABLOY


14.1.5
SIEMENS


14.1.6
AMAZON.COM, INC.


14.1.7
APPLE INC.


14.1.8
RESIDEO TECHNOLOGIES INC.


14.1.9
ROBERT BOSCH GMBH


14.1.10
ABB


14.2
OTHER PLAYERS


14.2.1
SAMSUNG


14.2.2
SONY CORPORATION


14.2.3
TRANE TECHNOLOGIES PLC


14.2.4
GIRA


14.2.5
AIRTHINGS


14.2.6
LOXONE ELECTRONICS GMBH


14.2.7
DELTA INTELLIGENT BUILDING TECHNOLOGIES (CANADA) INC.


14.2.8
SNAP ONE, LLC.


14.2.9
AXIS COMMUNICATIONS AB


14.2.10
COMCAST


14.2.11
ALARM.COM


14.2.12
VIVINT, INC.


14.2.13
SIMPLISAFE, INC.


14.2.14
GENERAL ELECTRIC COMPANY


14.2.15
NUKI HOME SOLUTIONS


14.2.16
LG ELECTRONICS


14.2.17
LUTRON ELECTRONICS CO., INC


14.2.18
LEGRAND


15
APPENDIX


295
 
15.1
INSIGHTS FROM INDUSTRY EXPERTS


15.2
DISCUSSION GUIDE


15.3
KNOWLEDGESTORE: MARKETSANDMARKETS’ SUBSCRIPTION PORTAL


15.4
CUSTOMIZATION OPTIONS


15.5
RELATED REPORTS


15.6
AUTHOR DETAILS


LIST OF TABLES


TABLE 1
EUROPEAN SMART HOME MARKET: GROWTH FORECAST ASSUMPTIONS


TABLE 2
EUROPEAN SMART HOME MARKET: RESEARCH ASSUMPTIONS


TABLE 3
EUROPEAN SMART HOME MARKET: RISK ASSESSMENT


TABLE 4
ENERGY-SAVING POTENTIAL OF LIGHTING CONTROL SYSTEMS


TABLE 5
AVERAGE SELLING PRICING TREND OF SMART LOCKS OFFERED BY KEY PLAYERS, 2020–2023 (USD)


TABLE 6
AVERAGE SELLING PRICE TREND FOR LIGHTING CONTROL PRODUCTS FOR EUROPEAN COUNTRIES, BY COUNTRY, 2020–2023 (USD)


TABLE 7
ROLE OF COMPANIES IN SMART HOME ECOSYSTEM


TABLE 8
LIST OF MAJOR PATENTS, 2023–2024


TABLE 9
IMPORT DATA FOR HS CODE 8517-COMPLIANT PRODUCTS, BY COUNTRY, 2019–2023 (USD MILLION)


TABLE 10
EXPORT DATA FOR HS CODE 8517-COMPLIANT PRODUCTS, BY COUNTRY, 2019–2023 (USD MILLION)


TABLE 11
LIST OF CONFERENCES AND EVENTS, 2024–2025


TABLE 12
MFN TARIFF FOR HS CODE 8517-COMPLIANT PRODUCTS EXPORTED BY GERMANY, 2023


TABLE 13
EUROPE: LIST OF REGULATORY BODIES, GOVERNMENT AGENCIES, AND OTHER ORGANIZATIONS


TABLE 14
IMPACT OF PORTER'S FIVE FORCES ON EUROPEAN SMART HOME MARKET


TABLE 15
INFLUENCE OF STAKEHOLDERS ON BUYING PROCESS FOR SALES CHANNELS


TABLE 16
KEY BUYING CRITERIA, BY SALES CHANNEL


TABLE 17
EUROPEAN SMART HOME MARKET, BY PROTOCOL, 2020–2023 (USD MILLION)


TABLE 18
EUROPEAN SMART HOME MARKET, BY PROTOCOL, 2024–2029 (USD MILLION)


TABLE 19
EUROPEAN SMART HOME MARKET, BY SALES CHANNEL, 2020–2023 (USD MILLION)


TABLE 20
EUROPEAN SMART HOME MARKET, BY SALES CHANNEL, 2024–2029 (USD MILLION)


TABLE 21
EUROPEAN SMART HOME MARKET, BY PRODUCT, 2020–2023 (USD MILLION)


TABLE 22
EUROPEAN SMART HOME MARKET, BY PRODUCT, 2024–2029 (USD MILLION)


TABLE 23
EUROPEAN SMART HOME MARKET, BY PRODUCT, 2020–2023 (USD MILLION UNITS)


TABLE 24
EUROPEAN SMART HOME MARKET, BY PRODUCT, 2024–2029 (USD MILLION UNITS)


TABLE 25
LIGHTING CONTROLS: EUROPEAN SMART HOME MARKET, BY TYPE, 2020–2023 (USD MILLION)


TABLE 26
LIGHTING CONTROLS: EUROPEAN SMART HOME MARKET, BY TYPE, 2024–2029 (USD MILLION)


TABLE 27
LIGHTING CONTROLS: EUROPEAN SMART HOME MARKET, BY COUNTRY, 2020–2023 (USD MILLION)


TABLE 28
LIGHTING CONTROLS: EUROPEAN SMART HOME MARKET, BY COUNTRY, 2024–2029 (USD MILLION)


TABLE 29
RELAYS: EUROPEAN SMART HOME MARKET, BY COUNTRY, 2020–2023 (USD MILLION)


TABLE 30
RELAYS: EUROPEAN SMART HOME MARKET, BY COUNTRY, 2024–2029 (USD MILLION)


TABLE 31
OCCUPANCY SENSORS: EUROPEAN SMART HOME MARKET, BY COUNTRY, 2020–2023 (USD MILLION)


TABLE 32
OCCUPANCY SENSORS: EUROPEAN SMART HOME MARKET, BY COUNTRY, 2024–2029 (USD MILLION)


TABLE 33
DAYLIGHT SENSORS: EUROPEAN SMART HOME MARKET, BY COUNTRY, 2020–2023 (USD MILLION)


TABLE 34
DAYLIGHT SENSORS: EUROPEAN SMART HOME MARKET, BY COUNTRY, 2024–2029 (USD MILLION)


TABLE 35
TIMERS: EUROPEAN SMART HOME MARKET, BY COUNTRY, 2020–2023 (USD MILLION)


TABLE 36
TIMERS: EUROPEAN SMART HOME MARKET, BY COUNTRY, 2024–2029 (USD MILLION)


TABLE 37
DIMMERS: EUROPEAN SMART HOME MARKET, BY COUNTRY, 2020–2023 (USD MILLION)


TABLE 38
DIMMERS: EUROPEAN SMART HOME MARKET, BY COUNTRY, 2024–2029 (USD MILLION)


TABLE 39
SWITCHES: EUROPEAN SMART HOME MARKET, BY COUNTRY, 2020–2023 (USD MILLION)


TABLE 40
SWITCHES: EUROPEAN SMART HOME MARKET, BY COUNTRY, 2024–2029 (USD MILLION)


TABLE 41
ACCESSORIES & OTHER PRODUCTS: EUROPEAN SMART HOME MARKET, BY COUNTRY, 2020–2023 (USD MILLION)


TABLE 42
ACCESSORIES & OTHER PRODUCTS: EUROPEAN SMART HOME MARKET, BY COUNTRY, 2024–2029 (USD MILLION)


TABLE 43
SECURITY & ACCESS CONTROLS: EUROPEAN SMART HOME MARKET, BY TYPE, 2020–2023 (USD MILLION)


TABLE 44
SECURITY & ACCESS CONTROLS: EUROPEAN SMART HOME MARKET, BY TYPE, 2024–2029 (USD MILLION)


TABLE 45
SECURITY & ACCESS CONTROLS: EUROPEAN SMART HOME MARKET, BY COUNTRY, 2020–2023 (USD MILLION)


TABLE 46
SECURITY & ACCESS CONTROLS: EUROPEAN SMART HOME MARKET, BY COUNTRY, 2024–2029 (USD MILLION)


TABLE 47
VIDEO SURVEILLANCE: EUROPEAN SMART HOME MARKET, BY COUNTRY, 2020–2023 (USD MILLION)


TABLE 48
VIDEO SURVEILLANCE: EUROPEAN SMART HOME MARKET, BY COUNTRY, 2024–2029 (USD MILLION)


TABLE 49
ACCESS CONTROLS: EUROPEAN SMART HOME MARKET, BY COUNTRY, 2020–2023 (USD MILLION)


TABLE 50
ACCESS CONTROLS: EUROPEAN SMART HOME MARKET, BY COUNTRY, 2024–2029 (USD MILLION)


TABLE 51
HVAC CONTROLS: EUROPEAN SMART HOME MARKET, BY TYPE, 2020–2023 (USD MILLION)


TABLE 52
HVAC CONTROLS: EUROPEAN SMART HOME MARKET, BY TYPE, 2024–2029 (USD MILLION)


TABLE 53
HVAC CONTROLS: EUROPEAN SMART HOME MARKET, BY COUNTRY, 2020–2023 (USD MILLION)


TABLE 54
HVAC CONTROLS: EUROPEAN SMART HOME MARKET, BY COUNTRY, 2024–2029 (USD MILLION)


TABLE 55
SMART THERMOSTATS: EUROPEAN SMART HOME MARKET, BY COUNTRY, 2020–2023 (USD MILLION)


TABLE 56
SMART THERMOSTATS: EUROPEAN SMART HOME MARKET, BY COUNTRY, 2024–2029 (USD MILLION)


TABLE 57
SENSORS: EUROPEAN SMART HOME MARKET, BY COUNTRY, 2020–2023 (USD MILLION)


TABLE 58
SENSORS: EUROPEAN SMART HOME MARKET, BY COUNTRY, 2024–2029 (USD MILLION)


TABLE 59
CONTROL VALVES: EUROPEAN SMART HOME MARKET, BY COUNTRY, 2020–2023 (USD MILLION)


TABLE 60
CONTROL VALVES: EUROPEAN SMART HOME MARKET, BY COUNTRY, 2024–2029 (USD MILLION)


TABLE 61
HEATING & COOLING COILS: EUROPEAN SMART HOME MARKET, BY COUNTRY, 2020–2023 (USD MILLION)


TABLE 62
HEATING & COOLING COILS: EUROPEAN SMART HOME MARKET, BY COUNTRY, 2024–2029 (USD MILLION)


TABLE 63
DAMPERS: EUROPEAN SMART HOME MARKET, BY COUNTRY, 2020–2023 (USD MILLION)


TABLE 64
DAMPERS: EUROPEAN SMART HOME MARKET, BY COUNTRY, 2024–2029 (USD MILLION)


TABLE 65
ACTUATORS: EUROPEAN SMART HOME MARKET, BY COUNTRY, 2020–2023 (USD MILLION)


TABLE 66
ACTUATORS: EUROPEAN SMART HOME MARKET, BY COUNTRY, 2024–2029 (USD MILLION)


TABLE 67
PUMPS & FANS: EUROPEAN SMART HOME MARKET, BY COUNTRY, 2020–2023 (USD MILLION)


TABLE 68
PUMPS & FANS: EUROPEAN SMART HOME MARKET, BY COUNTRY, 2024–2029 (USD MILLION)


TABLE 69
SMART VENTS: EUROPEAN SMART HOME MARKET, BY COUNTRY, 2020–2023 (USD MILLION)


TABLE 70
SMART VENTS: EUROPEAN SMART HOME MARKET, BY COUNTRY, 2024–2029 (USD MILLION)


TABLE 71
ENTERTAINMENT & OTHER CONTROLS: EUROPEAN SMART HOME MARKET, BY TYPE, 2020–2023 (USD MILLION)


TABLE 72
ENTERTAINMENT & OTHER CONTROLS: EUROPEAN SMART HOME MARKET, BY TYPE, 2024–2029 (USD MILLION)


TABLE 73
ENTERTAINMENT & OTHER CONTROLS: EUROPEAN SMART HOME MARKET, BY COUNTRY, 2020–2023 (USD MILLION)


TABLE 74
ENTERTAINMENT & OTHER CONTROLS: EUROPEAN SMART HOME MARKET, BY COUNTRY, 2024–2029 (USD MILLION)


TABLE 75
ENTERTAINMENT CONTROLS: EUROPEAN SMART HOME MARKET, BY COUNTRY, 2020–2023 (USD MILLION)


TABLE 76
ENTERTAINMENT CONTROLS: EUROPEAN SMART HOME MARKET, BY COUNTRY, 2024–2029 (USD MILLION)


TABLE 77
ENTERTAINMENT CONTROLS: EUROPEAN SMART HOME MARKET, BY TYPE, 2020–2023 (USD MILLION)


TABLE 78
ENTERTAINMENT CONTROLS: EUROPEAN SMART HOME MARKET, BY TYPE, 2024–2029 (USD MILLION)


TABLE 79
ENTERTAINMENT CONTROLS: EUROPEAN SMART HOME MARKET, BY TYPE, 2020–2023 (MILLION UNITS)


TABLE 80
ENTERTAINMENT CONTROLS: EUROPEAN SMART HOME MARKET, BY TYPE, 2024–2029 (MILLION UNITS)


TABLE 81
AUDIO & VOLUME CONTROLS: EUROPEAN SMART HOME MARKET, BY COUNTRY, 2020–2023 (USD MILLION)


TABLE 82
AUDIO & VOLUME CONTROLS: EUROPEAN SMART HOME MARKET, BY COUNTRY, 2024–2029 (USD MILLION)


TABLE 83
HOME THEATER SYSTEM CONTROLS: EUROPEAN SMART HOME MARKET, BY COUNTRY, 2020–2023 (USD MILLION)


TABLE 84
HOME THEATER SYSTEM CONTROLS: EUROPEAN SMART HOME MARKET, BY COUNTRY, 2024–2029 (USD MILLION)


TABLE 85
TOUCHSCREENS & KEYPADS: EUROPEAN SMART HOME MARKET, BY COUNTRY, 2020–2023 (USD MILLION)


TABLE 86
TOUCHSCREENS & KEYPADS: EUROPEAN SMART HOME MARKET, BY COUNTRY, 2024–2029 (USD MILLION)


TABLE 87
OTHER CONTROLS: EUROPEAN SMART HOME MARKET, BY TYPE, 2020–2023 (USD MILLION)


TABLE 88
OTHER CONTROLS: EUROPEAN SMART HOME MARKET, BY TYPE, 2024–2029 (USD MILLION)


TABLE 89
OTHER CONTROLS: EUROPEAN SMART HOME MARKET, BY TYPE, 2020–2023 (MILLION UNITS)


TABLE 90
OTHER CONTROLS: EUROPEAN SMART HOME MARKET, BY TYPE, 2024–2029 (MILLION UNITS)


TABLE 91
OTHER CONTROLS: EUROPEAN SMART HOME MARKET, BY COUNTRY, 2020–2023 (USD MILLION)


TABLE 92
OTHER CONTROLS: EUROPEAN SMART HOME MARKET, BY COUNTRY, 2024–2029 (USD MILLION)


TABLE 93
SMART METERS: EUROPEAN SMART HOME MARKET, BY COUNTRY, 2020–2023 (USD MILLION)


TABLE 94
SMART METERS: EUROPEAN SMART HOME MARKET, BY COUNTRY, 2024–2029 (USD MILLION)


TABLE 95
SMART PLUGS: EUROPEAN SMART HOME MARKET, BY COUNTRY, 2020–2023 (USD MILLION)


TABLE 96
SMART PLUGS: EUROPEAN SMART HOME MARKET, BY COUNTRY, 2024–2029 (USD MILLION)


TABLE 97
SMART HUBS: EUROPEAN SMART HOME MARKET, BY COUNTRY, 2020–2023 (USD MILLION)


TABLE 98
SMART HUBS: EUROPEAN SMART HOME MARKET, BY COUNTRY, 2024–2029 (USD MILLION)


TABLE 99
SMOKE DETECTORS: EUROPEAN SMART HOME MARKET, BY COUNTRY, 2020–2023 (USD MILLION)


TABLE 100
SMOKE DETECTORS: EUROPEAN SMART HOME MARKET, BY COUNTRY, 2024–2029 (USD MILLION)


TABLE 101
SMART SPEAKERS: EUROPEAN SMART HOME MARKET, 2020–2023 (USD MILLION)


TABLE 102
SMART SPEAKERS: EUROPEAN SMART HOME MARKET, 2024–2029 (USD MILLION)


TABLE 103
SMART SPEAKERS: EUROPEAN SMART HOME MARKET, BY COUNTRY, 2020–2023 (USD MILLION)


TABLE 104
SMART SPEAKERS: EUROPEAN SMART HOME MARKET, BY COUNTRY, 2024–2029 (USD MILLION)


TABLE 105
HOME HEALTHCARE APPLIANCES: EUROPEAN SMART HOME MARKET, BY TYPE, 2020–2023 (USD MILLION)


TABLE 106
HOME HEALTHCARE APPLIANCES: EUROPEAN SMART HOME MARKET, BY TYPE, 2024–2029 (USD MILLION)


TABLE 107
HOME HEALTHCARE APPLIANCES: EUROPEAN SMART HOME MARKET, BY COUNTRY, 2020–2023 (USD MILLION)


TABLE 108
HOME HEALTHCARE APPLIANCES: EUROPEAN SMART HOME MARKET, BY COUNTRY, 2024–2029 (USD MILLION)


TABLE 109
HEALTH STATUS MONITORS: EUROPEAN SMART HOME MARKET, BY COUNTRY, 2020–2023 (USD MILLION)


TABLE 110
HEALTH STATUS MONITORS: EUROPEAN SMART HOME MARKET, BY COUNTRY, 2024–2029 (USD MILLION)


TABLE 111
PHYSICAL ACTIVITY MONITORS: EUROPEAN SMART HOME MARKET, BY COUNTRY, 2020–2023 (USD MILLION)


TABLE 112
PHYSICAL ACTIVITY MONITORS: EUROPEAN SMART HOME MARKET, BY COUNTRY, 2024–2029 (USD MILLION)


TABLE 113
SMART KITCHEN APPLIANCES: EUROPEAN SMART HOME MARKET, BY TYPE, 2020–2023 (USD MILLION)


TABLE 114
SMART KITCHEN APPLIANCES: SMART HOME MARKET, BY TYPE, 2024–2029 (USD MILLION)


TABLE 115
SMART KITCHEN APPLIANCES: EUROPEAN SMART HOME MARKET, BY COUNTRY, 2020–2023 (USD MILLION)


TABLE 116
SMART KITCHEN APPLIANCES: EUROPEAN SMART HOME MARKET, BY COUNTRY, 2024–2029 (USD MILLION)


TABLE 117
SMART REFRIGERATORS: EUROPEAN SMART HOME MARKET, BY COUNTRY, 2020–2023 (USD MILLION)


TABLE 118
SMART REFRIGERATORS: EUROPEAN SMART HOME MARKET, BY COUNTRY, 2024–2029 (USD MILLION)


TABLE 119
SMART COFFEE MAKERS: EUROPEAN SMART HOME MARKET, BY COUNTRY, 2020–2023 (USD MILLION)


TABLE 120
SMART COFFEE MAKERS: EUROPEAN SMART HOME MARKET, BY COUNTRY, 2024–2029 (USD MILLION)


TABLE 121
SMART KETTLES: EUROPEAN SMART HOME MARKET, BY COUNTRY, 2020–2023 (USD MILLION)


TABLE 122
SMART KETTLES: EUROPEAN SMART HOME MARKET, BY COUNTRY, 2024–2029 (USD MILLION)


TABLE 123
SMART DISHWASHERS: EUROPEAN SMART HOME MARKET, BY COUNTRY, 2020–2023 (USD MILLION)


TABLE 124
SMART DISHWASHERS: EUROPEAN SMART HOME MARKET, BY COUNTRY, 2024–2029 (USD MILLION)


TABLE 125
SMART OVENS: EUROPEAN SMART HOME MARKET, BY COUNTRY, 2020–2023 (USD MILLION)


TABLE 126
SMART OVENS: EUROPEAN SMART HOME MARKET, BY COUNTRY, 2024–2029 (USD MILLION)


TABLE 127
SMART COOKTOPS: EUROPEAN SMART HOME MARKET, BY COUNTRY, 2020–2023 (USD MILLION)


TABLE 128
SMART COOKTOPS: EUROPEAN SMART HOME MARKET, BY COUNTRY, 2024–2029 (USD MILLION)


TABLE 129
SMART COOKERS: EUROPEAN SMART HOME MARKET, BY COUNTRY, 2020–2023 (USD MILLION)


TABLE 130
SMART COOKERS: EUROPEAN SMART HOME MARKET, BY COUNTRY, 2024–2029 (USD MILLION)


TABLE 131
HOME APPLIANCES: EUROPEAN SMART HOME MARKET, BY TYPE, 2020–2023 (USD MILLION)


TABLE 132
HOME APPLIANCES: EUROPEAN SMART HOME MARKET, BY TYPE, 2024–2029 (USD MILLION)


TABLE 133
HOME APPLIANCES: EUROPEAN SMART HOME MARKET, BY COUNTRY, 2020–2023 (USD MILLION)


TABLE 134
HOME APPLIANCES: EUROPEAN SMART HOME MARKET, BY COUNTRY, 2024–2029 (USD MILLION)


TABLE 135
SMART WASHERS: EUROPEAN SMART HOME MARKET, BY COUNTRY, 2020–2023 (USD MILLION)


TABLE 136
SMART WASHERS: EUROPEAN SMART HOME MARKET, BY COUNTRY, 2024–2029 (USD MILLION)


TABLE 137
SMART DRYERS: EUROPEAN SMART HOME MARKET, BY COUNTRY, 2020–2023 (USD MILLION)


TABLE 138
SMART DRYERS: EUROPEAN SMART HOME MARKET, BY COUNTRY, 2024–2029 (USD MILLION)


TABLE 139
SMART WATER HEATERS: EUROPEAN SMART HOME MARKET, BY COUNTRY, 2020–2023 (USD MILLION)


TABLE 140
SMART WATER HEATERS: EUROPEAN SMART HOME MARKET, BY COUNTRY, 2024–2029 (USD MILLION)


TABLE 141
SMART VACUUM CLEANERS: EUROPEAN SMART HOME MARKET, BY COUNTRY, 2020–2023 (USD MILLION)


TABLE 142
SMART VACUUM CLEANERS: EUROPEAN SMART HOME MARKET, BY COUNTRY, 2024–2029 (USD MILLION)


TABLE 143
SMART FURNITURE: EUROPEAN SMART HOME MARKET, BY TYPE, 2020–2023 (USD MILLION)


TABLE 144
SMART FURNITURE: EUROPEAN SMART HOME MARKET, BY TYPE, 2024–2029 (USD MILLION)


TABLE 145
SMART FURNITURE: EUROPEAN SMART HOME MARKET, BY COUNTRY, 2020–2023 (USD MILLION)


TABLE 146
SMART FURNITURE: EUROPEAN SMART HOME MARKET, BY COUNTRY, 2024–2029 (USD MILLION)


TABLE 147
SMART TABLES: EUROPEAN SMART HOME MARKET, BY COUNTRY, 2020–2023 (USD MILLION)


TABLE 148
SMART TABLES: EUROPEAN SMART HOME MARKET, BY COUNTRY, 2024–2029 (USD MILLION)


TABLE 149
SMART DESKS: EUROPEAN SMART HOME MARKET, BY COUNTRY, 2020–2023 (USD MILLION)


TABLE 150
SMART DESKS: EUROPEAN SMART HOME MARKET, BY COUNTRY, 2024–2029 (USD MILLION)


TABLE 151
SMART STOOLS & BENCHES: EUROPEAN SMART HOME MARKET, BY COUNTRY, 2020–2023 (USD MILLION)


TABLE 152
SMART STOOLS & BENCHES: EUROPEAN SMART HOME MARKET, BY COUNTRY, 2024–2029 (USD MILLION)


TABLE 153
SMART SOFAS: EUROPEAN SMART HOME MARKET, BY COUNTRY, 2020–2023 (USD MILLION)


TABLE 154
SMART SOFAS: EUROPEAN SMART HOME MARKET, BY COUNTRY, 2024–2029 (USD MILLION)


TABLE 155
SMART CHAIRS: EUROPEAN SMART HOME MARKET, BY COUNTRY, 2020–2023 (USD MILLION)


TABLE 156
SMART CHAIRS: EUROPEAN SMART HOME MARKET, BY COUNTRY, 2024–2029 (USD MILLION)


TABLE 157
EUROPEAN SMART HOME MARKET, BY SYSTEM TYPE, 2020–2023 (USD MILLION)


TABLE 158
EUROPEAN SMART HOME MARKET, BY SYSTEM TYPE, 2024–2029 (USD MILLION)


TABLE 159
EUROPEAN SMART HOME MARKET, BY INSTALLATION TYPE, 2020–2023 (USD MILLION)


TABLE 160
EUROPEAN SMART HOME MARKET, BY INSTALLATION TYPE, 2024–2029 (USD MILLION)


TABLE 161
EUROPEAN SMART HOME MARKET, BY RESIDENCE TYPE, 2020–2023 (USD MILLION)


TABLE 162
EUROPEAN SMART HOME MARKET, BY RESIDENCE TYPE, 2024–2029 (USD MILLION)


TABLE 163
EUROPEAN SMART HOME MARKET, BY COUNTRY, 2020–2023 (USD MILLION)


TABLE 164
EUROPEAN SMART HOME MARKET, BY COUNTRY, 2024–2029 (USD MILLION)


TABLE 165
UK: EUROPEAN SMART HOME MARKET, BY PRODUCT, 2020–2023 (USD MILLION)


TABLE 166
UK: EUROPEAN SMART HOME MARKET, BY PRODUCT, 2024–2029 (USD MILLION)


TABLE 167
GERMANY: EUROPEAN SMART HOME MARKET, BY PRODUCT, 2020–2023 (USD MILLION)


TABLE 168
GERMANY: EUROPEAN SMART HOME MARKET, BY PRODUCT, 2024–2029 (USD MILLION)


TABLE 169
FRANCE: EUROPEAN SMART HOME MARKET, BY PRODUCT, 2020–2023 (USD MILLION)


TABLE 170
FRANCE: EUROPEAN SMART HOME MARKET, BY PRODUCT, 2024–2029 (USD MILLION)


TABLE 171
ITALY: EUROPEAN SMART HOME MARKET, BY PRODUCT, 2020–2023 (USD MILLION)


TABLE 172
ITALY: EUROPEAN SMART HOME MARKET, BY PRODUCT, 2024–2029 (USD MILLION)


TABLE 173
REST OF EUROPE: EUROPEAN SMART HOME MARKET, BY PRODUCT, 2020–2023 (USD MILLION)


TABLE 174
REST OF EUROPE: EUROPEAN SMART HOME MARKET, BY PRODUCT, 2024–2029 (USD MILLION)


TABLE 175
SMART CONTROLS/HUBS/PLATFORMS IN EUROPE


TABLE 176
EUROPEAN SMART HOME MARKET: OVERVIEW OF STRATEGIES ADOPTED BY KEY PLAYERS, 2020–2024


TABLE 177
EUROPEAN SMART HOME MARKET: DEGREE OF COMPETITION, 2023


TABLE 178
EUROPEAN SMART HOME MARKET: PRODUCT FOOTPRINT


TABLE 179
EUROPEAN SMART HOME MARKET: SYSTEM TYPE FOOTPRINT


TABLE 180
EUROPEAN SMART HOME MARKET: SALES CHANNEL FOOTPRINT


TABLE 181
EUROPEAN SMART HOME MARKET: INSTALLATION TYPE FOOTPRINT


TABLE 182
EUROPEAN SMART HOME MARKET: DETAILED LIST OF KEY STARTUPS/SMES


TABLE 183
EUROPEAN SMART HOME MARKET: COMPETITIVE BENCHMARKING OF KEY STARTUPS/SMES


TABLE 184
EUROPEAN SMART HOME MARKET: PRODUCT LAUNCHES/DEVELOPMENTS, JANUARY 2020–JANUARY 2025


TABLE 185
EUROPEAN SMART HOME MARKET: DEALS, JANUARY 2020–JANUARY 2025


TABLE 186
EUROPEAN SMART HOME MARKET: OTHER DEVELOPMENTS, JANUARY 2020–JANUARY 2025


TABLE 187
JOHNSON CONTROLS: COMPANY OVERVIEW


TABLE 188
JOHNSON CONTROLS: PRODUCTS/SOLUTIONS/SERVICES OFFERED


TABLE 189
JOHNSON CONTROLS: PRODUCT LAUNCHES/DEVELOPMENTS


TABLE 190
JOHNSON CONTROLS: DEALS


TABLE 191
SCHNEIDER ELECTRIC: COMPANY OVERVIEW


TABLE 192
SCHNEIDER ELECTRIC: PRODUCTS/SOLUTIONS/SERVICES OFFERED


TABLE 193
SCHNEIDER ELECTRIC: PRODUCT LAUNCHES/DEVELOPMENTS


TABLE 194
SCHNEIDER ELECTRIC: DEALS


TABLE 195
HONEYWELL INTERNATIONAL INC.: COMPANY OVERVIEW


TABLE 196
HONEYWELL INTERNATIONAL INC.: PRODUCTS/SOLUTIONS/SERVICES OFFERED


TABLE 197
HONEYWELL INTERNATIONAL INC.: PRODUCT LAUNCHES/DEVELOPMENTS


TABLE 198
HONEYWELL INTERNATIONAL INC.: DEALS


TABLE 199
ASSA ABLOY: COMPANY OVERVIEW


TABLE 200
ASSA ABLOY: PRODUCTS/SOLUTIONS/SERVICES OFFERED


TABLE 201
ASSA ABLOY: PRODUCT LAUNCHES/DEVELOPMENTS


TABLE 202
ASSA ABLOY: DEALS


TABLE 203
SIEMENS: COMPANY OVERVIEW


TABLE 204
SIEMENS: PRODUCTS/SOLUTIONS/SERVICES OFFERED


TABLE 205
SIEMENS: PRODUCT LAUNCHES/DEVELOPMENTS


TABLE 206
SIEMENS: DEALS


TABLE 207
SIEMENS: OTHER DEVELOPMENTS


TABLE 208
AMAZON.COM, INC.: COMPANY OVERVIEW


TABLE 209
AMAZON.COM, INC.: PRODUCTS/SOLUTIONS/SERVICES OFFERED


TABLE 210
AMAZON.COM, INC.: PRODUCT LAUNCHES/DEVELOPMENTS


TABLE 211
AMAZON.COM, INC.: DEALS


TABLE 212
APPLE INC.: COMPANY OVERVIEW


TABLE 213
APPLE INC.: PRODUCTS/SOLUTIONS/SERVICES OFFERED


TABLE 214
APPLE INC.: PRODUCT LAUNCHES/DEVELOPMENTS


TABLE 215
APPLE INC.: DEALS


TABLE 216
RESIDEO TECHNOLOGIES INC.: COMPANY OVERVIEW


TABLE 217
RESIDEO TECHNOLOGIES INC.: PRODUCTS/SOLUTIONS/SERVICES OFFERED


TABLE 218
RESIDEO TECHNOLOGIES INC.: PRODUCT LAUNCHES/DEVELOPMENTS


TABLE 219
RESIDEO TECHNOLOGIES INC.: DEALS


TABLE 220
RESIDEO TECHNOLOGIES INC.: OTHER DEVELOPMENTS


TABLE 221
ROBERT BOSCH GMBH: COMPANY OVERVIEW


TABLE 222
ROBERT BOSCH GMBH: PRODUCTS/SOLUTIONS/SERVICES OFFERED


TABLE 223
ROBERT BOSCH GMBH: PRODUCT LAUNCHES/DEVELOPMENTS


TABLE 224
ROBERT BOSCH GMBH: DEALS


TABLE 225
ABB: COMPANY OVERVIEW


TABLE 226
ABB: PRODUCTS/SOLUTIONS/SERVICES OFFERED


TABLE 227
ABB: PRODUCT LAUNCHES/DEVELOPMENTS


TABLE 228
ABB: DEALS


LIST OF FIGURES


FIGURE 1
EUROPEAN SMART HOME MARKET SEGMENTATION AND REGIONAL SCOPE


FIGURE 2
EUROPEAN SMART HOME MARKET: RESEARCH DESIGN


FIGURE 3
EUROPEAN SMART HOME MARKET: RESEARCH APPROACH


FIGURE 4
EUROPEAN SMART HOME MARKET: SUPPLY-SIDE ANALYSIS


FIGURE 5
REVENUE GENERATED FROM SALES OF SMART HOME SOLUTIONS


FIGURE 6
EUROPEAN SMART HOME MARKET: BOTTOM-UP APPROACH


FIGURE 7
EUROPEAN SMART HOME MARKET: TOP-DOWN APPROACH


FIGURE 8
DATA TRIANGULATION METHODOLOGY


FIGURE 9
EUROPEAN SMART HOME MARKET, 2020–2029


FIGURE 10
OCCUPANCY SENSORS TO ACCOUNT FOR LARGEST MARKET SHARE IN 2029


FIGURE 11
MULTI-FAMILY RESIDENCE SEGMENT TO RECORD HIGHER CAGR DURING FORECAST PERIOD


FIGURE 12
SMART KITCHEN APPLIANCES SEGMENT TO RECORD HIGHEST CAGR DURING FORECAST PERIOD


FIGURE 13
GROWING NEED FOR ENERGY-SAVING AND LOW CARBON EMISSION-ORIENTED SOLUTIONS TO DRIVE MARKET


FIGURE 14
DAMPERS SEGMENT TO DOMINATE MARKET DURING FORECAST PERIOD


FIGURE 15
ACCESS CONTROLS SEGMENT TO REGISTER HIGHEST CAGR DURING FORECAST PERIOD


FIGURE 16
SMART DISHWASHERS TO RECORD HIGHEST CAGR DURING FORECAST PERIOD


FIGURE 17
SMART WASHERS TO WITNESS HIGHEST CAGR DURING FORECAST PERIOD


FIGURE 18
GERMANY TO RECORD HIGHEST CAGR DURING FORECAST PERIOD


FIGURE 19
EUROPEAN SMART HOME MARKET: DRIVERS, RESTRAINTS, OPPORTUNITIES, AND CHALLENGES


FIGURE 20
EUROPEAN SMART HOME MARKET: IMPACT ANALYSIS OF DRIVERS


FIGURE 21
EUROPEAN SMART HOME MARKET: IMPACT ANALYSIS OF RESTRAINTS


FIGURE 22
EUROPEAN SMART HOME MARKET: IMPACT ANALYSIS OF OPPORTUNITIES


FIGURE 23
EUROPEAN SMART HOME MARKET: IMPACT ANALYSIS OF CHALLENGES


FIGURE 24
TRENDS/DISRUPTIONS IMPACTING CUSTOMER BUSINESS


FIGURE 25
AVERAGE SELLING PRICE OF SMART LOCKS OFFERED BY KEY PLAYERS, 2023


FIGURE 26
AVERAGE SELLING PRICE TREND OF SMART LOCKS, 2020–2023


FIGURE 27
AVERAGE SELLING PRICE TREND FOR LIGHTING CONTROL PRODUCTS FOR EUROPEAN COUNTRIES, 2020–2023


FIGURE 28
EUROPEAN SMART HOME MARKET: SUPPLY CHAIN ANALYSIS


FIGURE 29
ECOSYSTEM ANALYSIS


FIGURE 30
INVESTMENT AND FUNDING SCENARIO, 2023


FIGURE 31
PATENTS APPLIED AND GRANTED, 2015–2024


FIGURE 32
IMPORT DATA FOR HS CODE 8517-COMPLIANT PRODUCTS, BY COUNTRY, 2019–2023


FIGURE 33
EXPORT DATA FOR HS CODE 8517-COMPLIANT PRODUCTS, BY COUNTRY, 2019–2023


FIGURE 34
PORTER'S FIVE FORCES ANALYSIS: EUROPEAN SMART HOME MARKET


FIGURE 35
INFLUENCE OF STAKEHOLDERS ON BUYING PROCESS FOR SALES CHANNELS


FIGURE 36
KEY BUYING CRITERIA FOR SALES CHANNELS


FIGURE 37
IMPACT OF AI/GENERATIVE AI ON EUROPEAN SMART HOME MARKET


FIGURE 38
WIRED SEGMENT TO CLAIM LARGER MARKET SHARE IN 2024


FIGURE 39
WIRING FOR DALI FLUORESCENT DIMMING


FIGURE 40
LONWORKS NETWORK SETUP


FIGURE 41
TYPES OF WIRELESS COMMUNICATION TECHNOLOGIES


FIGURE 42
INDIRECT SALES SEGMENT TO HOLD LARGER MARKET SHARE IN 2024


FIGURE 43
ENTERTAINMENT & OTHER CONTROLS SEGMENT TO HOLD LARGEST MARKET SHARE IN 2029


FIGURE 44
BEHAVIORAL SEGMENT TO CAPTURE MAJORITY OF MARKET SHARE IN 2029


FIGURE 45
NEW INSTALLATIONS SEGMENT TO ACCOUNT FOR LARGER MARKET SHARE IN 2024


FIGURE 46
MULTI-FAMILY RESIDENCE SEGMENT TO SECURE LARGER MARKET SHARE IN 2024


FIGURE 47
EUROPE: SMART HOME MARKET SNAPSHOT


FIGURE 48
MARKET SHARE ANALYSIS OF EUROPEAN PLAYERS OFFERING SMART HOME SOLUTIONS, 2023


FIGURE 49
EUROPEAN SMART HOME MARKET: REVENUE ANALYSIS OF FIVE KEY PLAYERS, 2020–2023


FIGURE 50
COMPANY VALUATION, 2024


FIGURE 51
FINANCIAL METRICS (EV/EBITDA), 2024


FIGURE 52
BRAND COMPARISON


FIGURE 53
EUROPEAN SMART HOME MARKET: COMPANY EVALUATION MATRIX (KEY PLAYERS), 2023


FIGURE 54
EUROPEAN SMART HOME MARKET: COMPANY FOOTPRINT


FIGURE 55
EUROPEAN SMART HOME MARKET: COMPANY EVALUATION MATRIX (STARTUPS/SMES), 2023


FIGURE 56
JOHNSON CONTROLS: COMPANY SNAPSHOT


FIGURE 57
SCHNEIDER ELECTRIC: COMPANY SNAPSHOT


FIGURE 58
HONEYWELL INTERNATIONAL INC.: COMPANY SNAPSHOT


FIGURE 59
ASSA ABLOY: COMPANY SNAPSHOT


FIGURE 60
SIEMENS: COMPANY SNAPSHOT


FIGURE 61
AMAZON.COM, INC.: COMPANY SNAPSHOT


FIGURE 62
APPLE INC.: COMPANY SNAPSHOT


FIGURE 63
RESIDEO TECHNOLOGIES INC.: COMPANY SNAPSHOT


FIGURE 64
ROBERT BOSCH GMBH: COMPANY SNAPSHOT


FIGURE 65
ABB: COMPANY SNAPSHOT


Methodology

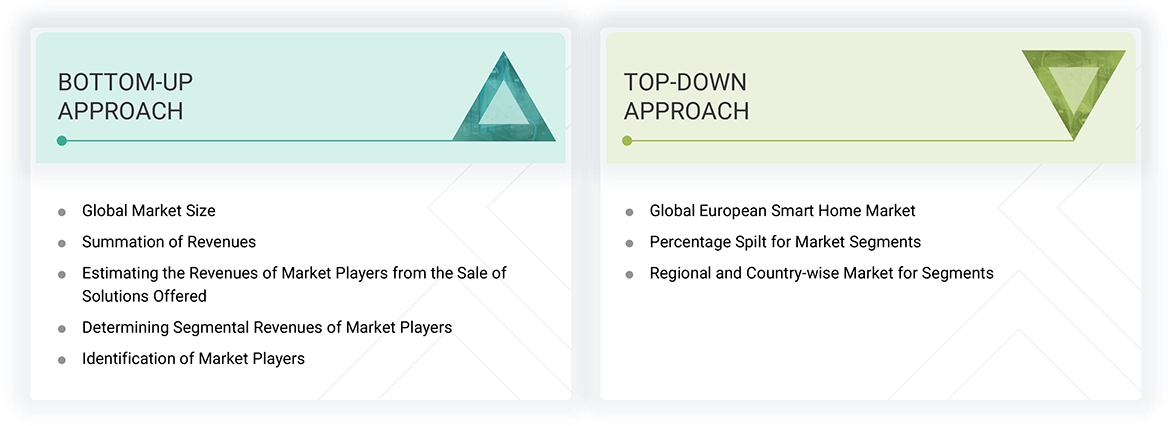
The research study involved four major steps in estimating the European smart home market size. Exhaustive secondary research has been done to collect important information about the market and peer markets. The next step has been to validate these findings and assumptions and size them with the help of primary research with industry experts across the value chain. Both top-down and bottom-up approaches have been used to estimate the market size. After this, the market breakdown and data triangulation approaches have been adopted to estimate the market sizes of segments and subsegments.

Secondary Research

In the secondary research process, various secondary sources were referred to identify and collect information required for this study. The secondary sources include annual reports, press releases, investor presentations of companies, white papers, and articles from recognized authors. Secondary research has been mainly done to obtain key information about the market's value chain, the pool of key market players, market segmentation according to industry trends, country-level outlook, and developments from market and technology perspectives.

The European smart home report estimates the global market size using the top-down and bottom-up approaches, along with several other dependent submarkets. The major players in the market were identified using extensive secondary research, and their presence in the market was determined using secondary and primary research. All the percentage splits and breakdowns have been determined using secondary sources and verified through primary sources.

Primary Research

Extensive primary research has been conducted after understanding the European smart home market scenario through secondary research. Several primary interviews have been conducted with key opinion leaders from demand- and supply-side vendors across major countries— the UK, Germany, France, Italy, and the Rest of Europe. Approximately 25% of the primary interviews have been conducted with the demand-side vendors and 75% with the supply-side vendors. Primary data was collected mainly through telephonic interviews, which comprised 80% of the total primary interviews; questionnaires and emails were also used to collect the data.

After successful interaction with industry experts, brief sessions were conducted with highly experienced independent consultants to reinforce our primary research findings. This, along with the in-house subject matter experts' opinions, has led us to the findings as described in the report. The breakdown of primary respondents is as follows:

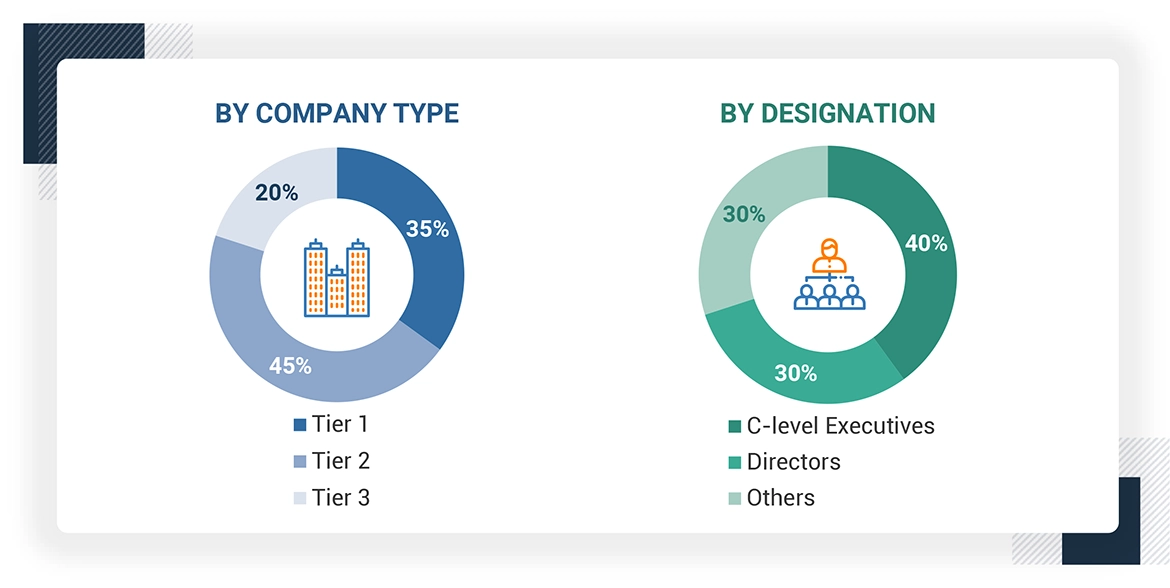
Note: Others include sales, marketing, and product managers.

About the assumptions considered for the study, To know download the pdf brochure

Market Size Estimation

In the market engineering process, both top-down and bottom-up approaches and data triangulation methods have been used to estimate and validate the size of the European smart home and other dependent submarkets. The research methodology used to estimate the market sizes includes the following:

  • Identifying top-line investments and spending in the ecosystem and considering segment-level splits and major market developments
  • Identifying different stakeholders in the European smart home market that influence the entire market, along with participants across the supply chain
  • Analyzing major manufacturers and service providers in the European smart home market and studying their solutions and service portfolios
  • Analyzing trends related to the adoption of European smart home solutions and services
  • Tracking recent and upcoming market developments, including R&D activities, product launches, collaborations, acquisitions, agreements, investments, and partnerships, as well as forecasting the market size based on these developments and other critical parameters
  • Carrying out multiple discussions with key opinion leaders to identify the adoption trends of European smart home devices
  • Segmenting the overall market into various other market segments
  • Validating the estimates at every level through discussions with key opinion leaders, such as chief executives (CXOs), directors, and operation managers, and finally with the domain experts at MarketsandMarkets

European Smart Home Market : Top-Down and Bottom-Up Approach

Data Triangulation

After arriving at the overall market size, using the market size estimation processes explained above, the market has been split into several segments and subsegments. Data triangulation and market breakdown procedures have been employed to complete the entire market engineering process and arrive at each market segment's and subsegment's exact statistics. The data has been triangulated by studying various factors and trends from the demand and supply sides in the European smart home market.

Market Definition

A smart home is incorporated with advanced automation systems that enable inhabitants to monitor and control the functions of the house. Smart home systems enable owners to control lights remotely, such as heating, ventilation, air conditioning (HVAC), security alarms, and other household devices through smartphones, tablets, or computers. Smart homes are loaded with wired and wireless communication devices like Wi-Fi, Bluetooth, universal powerline bus (UPB), INSTEON, Z-Wave, and Zigbee to provide smart insights and information to residents by monitoring homes' different aspects on a real-time basis. As part of the Internet of Things (IoT), smart home systems and devices frequently collaborate, exchanging consumer usage data and automating behaviors according to homeowners' requirements.

According to Smart Home Energy, an association in the UK, smart homes use home automation technologies to provide homeowners with intelligent feedback and information by monitoring many aspects of a home. For instance, a smart home's refrigerator may be able to catalog its contents, suggest menus, recommend healthy alternatives, and order replacements as food is used up.

Key Stakeholders

  • Raw material and manufacturing equipment suppliers
  • Automation and control vendors
  • Automation and control networking technology vendors
  • Real estate builders
  • System integrators
  • Homeowners
  • Project consultants
  • Designers/consultants (HVAC, security, and fire and safety)
  • Component manufacturers (sensors and controls)
  • Home management system (products and servers) providers
  • Smart home-related associations, organizations, forums, and alliances
  • Government bodies associated with green buildings

Report Objectives

  • To define, describe, segment, and forecast the European smart home market, by product, system type, sales channel, protocol, residence type, and installation type, in terms of value
  • To forecast the market for products, in terms of volume
  • To describe and forecast the market for various segments, with respect to one main region: Europe, along with their respective countries, in terms of value
  • To provide detailed information regarding drivers, restraints, opportunities, and challenges influencing the growth of the European smart home market
  • To provide a detailed overview of the European smart home market's supply chain, along with the ecosystem, technology trends, use cases, regulatory environment,  and Porter's five forces analysis for the market
  • To analyze industry trends, pricing data, patents and innovations, and trade data (export and import data) related to smart home
  • To strategically analyze the micromarkets with respect to individual growth trends, prospects, and contributions to the total market
  • To strategically profile the key players and comprehensively analyze their market share and core competencies
  • To analyze competitive developments, such as product launches, collaborations, acquisitions, agreements, investments, partnerships, and research & development (R&D), carried out by players in the European smart home market
  • To study the impact of AI/gen AI on the market under study, along with the macroeconomic outlook for each region considered in the scope

Available Customizations

With the given market data, MarketsandMarkets offers customizations according to the specific requirements of companies. The following customization options are available for the report:

  • Detailed analysis and profiling of additional market players based on various blocks of the supply chain


Key Questions Addressed by the Report

What is the expected market size of the European smart home in 2025, and at what CAGR will it grow during the forecast period?
The European smart home market was valued at USD 24.74 billion in 2025 and is expected to register a CAGR of 7.9% during the forecast period.
What is a smart home?
Smart homes are residences equipped with internet-connected devices that allow for remote management and automation of systems and appliances.
Who are the significant players in the European smart home market?
Companies such as Johnson Controls Inc. (Ireland), Honeywell International Inc. (US), Schneider Electric (France), Siemens (Germany), and ASSA ABLOY (Sweden) fall under the winner's category. These companies cater to the requirements of their customers by providing smart home systems. Moreover, these companies are adopting inorganic growth strategies to strengthen their market position and customer base.
Which strategies have been adopted by key players in the European smart home market?
The major strategies key players in the market adopt are partnerships, acquisitions, and agreements.
Name the emerging players in the European smart home market.
tado GmbH (Deutschland), Netatmo (France), and FIBARO (Wielkopolska) are the emerging players in the European smart home market.


Personalize This Research

  • Triangulate with your Own Data
  • Get Data as per your Format and Definition
  • Gain a Deeper Dive on a Specific Application, Geography, Customer or Competitor
  • Any level of Personalization
Request A Free Customisation

Let Us Help You

  • What are the Known and Unknown Adjacencies Impacting the European Smart Home Market
  • What will your New Revenue Sources be?
  • Who will be your Top Customer; what will make them switch?
  • Defend your Market Share or Win Competitors
  • Get a Scorecard for Target Partners
Customized Workshop Request

Custom Market Research Services

We Will Customise The Research For You, In Case The Report Listed Above Does Not Meet With Your Requirements

Get 10% Free Customisation

Growth opportunities and latent adjacency in European Smart Home Market

Albena

Aug, 2019

We are working on a feasibility study for the technological viability and commercial success of our energy management system for Bulgaria and Eastern Europe..

andres

Apr, 2022

In urgent need of European smart home report for an investment opportunity. .

Bernhard

Jul, 2014

We are a top technology leading producer for smart homes . How can we push our information in to your survey?.

Dimitris

Apr, 2019

Interested in having a thorough analysis of the European Smart Home market, as part of our strategic decision to expand our smart home product offering further to other countries..

Alessandra

Mar, 2015

I would like to buy the smart home report but would need to receive an invoice for payment in the UK or any other European country. Is that possible?.

Balazs

Feb, 2018

I would like to know what are the 5 most important smart home features and qualities the customers are ready to pay in Eastern Europe. .

DMCA.com Protection Status