Expanded Polystyrene (EPS) Market by Product Type (White, Grey, Black), End-use Industry (Building & Construction, Packaging, Others), and Region (Asia Pacific, Europe, North America, Middle East & Africa, South America) - Global Forecast to 2023


To get the latest information, inquire now!
EPS is a plastic foam material that has certain desirable properties because of its structure. It is made by expanding and molding polystyrene beads. Earlier, foaming plastics were used in insulation and flotation devices for boats, life preservers, and buoys. After the invention of EPS, packaging products, such as paper, kapok, and other natural packaging products, have been replaced linearly. The familiarity of EPS was spread due to the enormous growth of the fast-food industry where expanded polystyrene foam (EPF) began to be used in burger boxes and coffee cups.
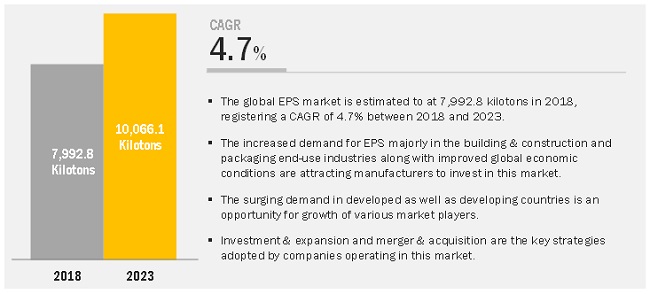
The global EPS market was estimated to be at 7,992.8 kilotons in 2018 and is projected to reach 10,066.1 kilotons by 2023, at a cagr 4.7% between 2018 and 2023. The growth of this market is attributed to the continued growth in the building & construction industry, as it is the largest consumer of EPS as compared to the packaging and other industries.
To know about the assumptions considered for the study, Request for Free Sample Report
Grey EPS to register the highest CAGR in the market
Although white EPS is the largest product type, grey EPS is projected to grow at a higher rate during the forecast period. This growth is attributed to the high consumption of grey EPS in the building & construction industry due to its better thermal insulating properties.
Building & construction to be fastest-growing end-use industry during the forecast period
Building & construction is the largest and the fastest-growing end-use industry of EPS. EPS possesses ideal physical and mechanical properties for most insulating needs. It is an excellent design element, an ideal choice for green building, offers tangible environmental advantages that can maximize energy efficiency, provides improved indoor environmental quality, and enhances durability. These factors make the building & construction industry the largest consumer of EPS.
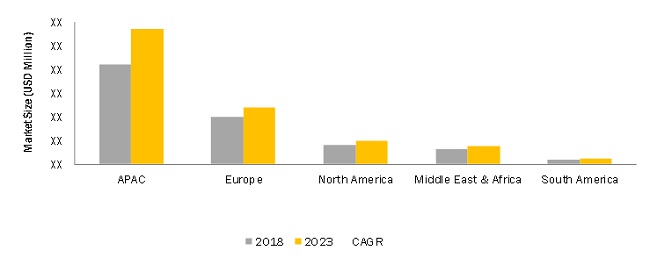
APAC to dominate the EPS market during the forecast period
APAC has emerged as the leading consumer and producer of EPS due to the increasing demand from the domestic front and rising income levels. The easy availability of low-cost labor and economical & accessible raw materials are increasing the production of EPS in the region, thereby driving foreign investments. APAC is also the largest and fastest-growing EPS market. The government proposals to improve public infrastructure and rising cash-intensive non-residential construction are positively impacting the market growth.
To know about the assumptions considered for the study, download the pdf brochure
Market Dynamics
Driver: Growing construction and packaging industries in developing countries
EPS is extensively used in the construction industry owing to its closed-air low-thermal conductivity, lightweight (ease of handling), mechanical resistance (insulation in the wall structure and roofs & flooring), low water absorption (to prevent from humidity), and sound resistance (in office and rooms). It has become a powerful design element and an ideal choice for green building. EPS offers tangible environmental advantages that maximize energy efficiency, improve indoor environmental quality, and enhance the durability of the buildings and packaged products.
Restraint: Volatility in crude oil prices
Even though the crude oil price will not affect the end price of EPS to a larger extent, but in the future, any volatility (rise) in EPS price can affect the profitability of styrene producers. Consequent to fluctuations in crude oil prices, styrene producers such as Royal Dutch Shell (Netherlands), The Dow Chemical Company (US), and LyondellBasell Industries N.V. (Netherlands) are increasingly investing in R&D to reduce investment and cut operating costs in a bid to improve their margins. The crude oil prices and growing demand are expected to drive the EPS prices in the near future.
Opportunity: Polystyrene products can be recycled easily
EPS used in insulation and packaging is non-toxic and inert and is made without chlorofluorocarbons (CFCs). It has less impact on the environment than the other competitive materials. However, it is almost indestructible, and the discarded EPS does not biodegrade for hundreds of years. It is also resistant to photolysis. Previously, EPS waste was dumped in landfills, but this trend is now changing, and post-consumer and post-commercial EPS recycling has increased.
More than 100 million pounds of EPS is recycled and reused in both closed-loop and open-loop processes globally to make a variety of durable goods and innovative new building products from recycled content foam packaging. Value-added plastic products, such as crown moldings, picture frames, park benches, movie props, and faux marble and stone manufactured from post-consumer and post-commercial EPS reduces the amount of virgin material needed. New applications are driving the recycling gains, with progress in recycling technology, integrated chain management principles, and collaborative collection programs.
Challenge: Ban on EPS in major markets
In a few major economies, such as the US (New York), the EPS items have been banned. Styrofoam (EPS) cups cannot be recycled as they are already expanded, and to produce these cups, they need virgin polystyrene beads. As EPS materials are not biodegradable, some consumers do not prefer single-use (use and throw) EPS coffee cups.
The banned items include polystyrene foam single-service items, including cups, bowls, plates, take-out containers, trays, polystyrene loose fill packaging, commonly known as packing peanuts. However, there are few exceptions such as EPS containers used for prepackaged food that are filled and sealed prior to receipt by the food service establishment; mobile food store; and containers used to store raw meat, pork, fish, seafood, or poultry sold from a butcher case or similar retail appliance are still in use.
Scope of the Report
|
Report Metric |
Details |
|
Market size available for years |
2016–2023 |
|
Base year considered |
2017 |
|
Forecast period |
2018–2023 |
|
Forecast units |
USD million (Value) and kiloton (Volume) |
|
Segments covered |
Product Type, End-use Industry, and Region |
|
Geographies covered |
North America, APAC, Europe, Middle East & Africa, and South America |
|
Companies covered |
Wuxi Xingda (China), Synthos (Poland), BASF (Germany), Total (France), SUNPOR KUNSTSTOFF (Austria), The Ravago Group (Belgium), Alpek (Mexico), VERSALIS (Italy), Nova Chemicals (US), Flint Hills Resources (US), PJSC SIBUR HOLDING (Russia), Saudi Basic Industries Corporation (SABIC) (Saudi Arabia), Kaneka Corporation (Japan), Atlas Roofing Corporation (US), BEWiSynbra Group (Sweden), Brødr. Sunde A/S (Norway), Nexkemia Petrochemicals (Canada), and Unipol Holland (Netherlands) |
This research report categorizes the EPS market based on product type, end-use industry, and region.
On the basis of product type:
- White
- Grey
- Black
On the basis of end-use industry:
- Building & construction
- Packaging
- Others (automotive, medical, marine, and sports & leisure)
On the basis of region:
-
North America
- US
- Canada
- Mexico
-
Europe
- Russia
- Germany
- Poland
- Turkey
- Italy
- France
- Spain
- UK
- Czech Republic
- Rest of Europe
-
APAC
- China
- South Korea
- India
- Japan
- Thailand
- Indonesia
- Malaysia
- Rest of APAC
-
Middle East & Africa
- Africa
- Saudi Arabia
- Iran
- UAE
- Rest of the Middle East
-
South America
- Brazil
- Argentina
- Colombia
- Rest of South America
Key Market Players
Xingda Group, Synthos, BASF, Jiangsu, and Dalian
Recent Developments
- In August 2018, Atlas Roofing acquired ACH Foam Technologies, a leading manufacturer of molded polystyrene solutions with manufacturing facilities across North America. This will expand and enhance Atlas’s product portfolio and strengthen its position in the North American market.
- In January 2018, BEWiSynbra completed the acquisition of Ruukin EPS, a Finnish manufacturer of insulation material. Through this acquisition, the company primarily gains better geographical coverage in Finland and will also be able to offer insulation material and packaging solutions in EPS as it does in the rest of the Nordics.
- In October 2016, Atlas Roofing rebuilt its EPS production facility in Perryville, Missouri, which was destroyed by almost 85% by a fire that broke out in December 2016.
- In January 2016, BEWiSynbra launched green EPS, made from recycled EPS – rigid cellular plastic with the same excellent characteristics as new plastic under the GreenLine brand.
- In May 2015 , Synthos launched Synthos EPS with HBCD for packaging applications as an improvement in other EPS products offered by Synthos.
Critical questions the report answers:
- What are the upcoming trends in the market? What impact would they make post-2020?
- What are the major factors influencing the growth of the market?
- What are the key strategies adopted by the top players to increase their revenue?
- What are the significant growth trends at the forefront of new market innovations?
To speak to our analyst for a discussion on the above findings, click Speak to Analyst
 Exclusive indicates content/data unique to MarketsandMarkets and not available with any competitors.
Table of Contents
1 Introduction (Page No. - 17)
1.1 Objectives of the Study
1.2 Market Definition
1.3 Market Scope
1.3.1 Years Considered for the Study
1.4 Currency
1.5 Unit Considered
1.6 Stakeholders
2 Research Methodology (Page No. - 20)
2.1 Research Data
2.1.1 Secondary Data
2.1.1.1 Key Data From Secondary Sources
2.1.2 Primary Data
2.1.2.1 Key Data From Primary Sources
2.1.2.2 Key Industry Insights
2.1.2.3 Breakdown of Primary Interviews
2.2 Market Size Estimation
2.2.1 Bottom-Up Approach
2.2.2 Top-Down Approach
2.3 Data Triangulation
2.4 Assumptions
2.5 Limitations
3 Executive Summary (Page No. - 28)
4 Premium Insights (Page No. - 32)
4.1 Attractive Opportunities in the EPS Market
4.2 Expanded Polystyrene Market , By Product Type
4.3 Market : By End-Use Industry and Key Countries
4.4 Market : Developed vs Developing Countries
4.5 APAC Expanded Polystyrene Market
4.6 EPS Market Attractiveness
5 Market Overview (Page No. - 35)
5.1 Introduction
5.2 Market Evolution
5.2.1 EPS Foam Adoption in Product Markets
5.3 Market Dynamics
5.3.1 Drivers
5.3.1.1 Growing Construction and Packaging Industries in Developing Countries
5.3.2 Restraints
5.3.2.1 Volatility in Crude Oil Prices
5.3.2.2 Availability of High-Performance Substitutes
5.3.2.3 China’s Slowing Economy
5.3.3 Opportunities
5.3.3.1 Polystyrene Products Can Be Recycled Easily
5.3.4 Challenges
5.3.4.1 Growing Preference for Molded Pulp Packaging
5.3.4.2 Ban on EPS in Major Economies
5.4 Value Chain Analysis
5.5 Porter’s Five Forces Analysis
5.5.1 Threat of Substitutes
5.5.2 Bargaining Power of Buyers
5.5.3 Threat of New Entrants
5.5.4 Bargaining Power of Suppliers
5.5.5 Intensity of Competitive Rivalry
6 Expanded Polystyrene Market, By Product Type (Page No. - 49)
6.1 Introduction
6.2 EPS Manufacturing Process
6.2.1 Pre-Expansion
6.2.2 Intermediate Maturing and Stabilization
6.2.3 Expansion and Final Molding
6.3 White Expanded Polystyrene
6.3.1 Packaging Industry to Fuel the Demand for White EPS
6.4 Grey Expanded Polystyrene
6.4.1 Additional Thermal Efficiency and Enhanced Fire Retardancy to Drive the Demand for Grey EPS
6.4.2 Silver Expanded Polystyrene
6.5 Black Expanded Polystyrene
6.5.1 Increasing Demand for Eco-Friendly Building Structures to Fuel the Demand for Black EPS
7 Expanded Polystyrene Market, By End-Use Industry (Page No. - 57)
7.1 Introduction
7.2 Building & Construction
7.2.1 Increasing Population and Growing Urbanization to Drive the Demand for EPS in the Building & Construction Industry
7.2.2 Drivers
7.2.2.1 High Growth in the Construction Industry
7.2.2.2 Increase in Demand for Thermal Insulation
7.2.3 Restraints
7.2.3.1 Developed Markets Reaching the Maturity Stage
7.2.4 Applications
7.2.4.1 Exterior Insulating & Finishing Systems
7.2.4.2 Insulating Concrete Forms
7.2.4.3 Structural Insulated Panels
7.2.4.4 Sheathing
7.2.4.5 Below Grade Foundation
7.2.4.6 Roofing Systems
7.2.4.7 Door Cores
7.2.4.8 Cold Storage
7.3 Packaging
7.3.1 Excellent Physical Properties to Drive the Demand for EPS Packaging Industry
7.3.2 Packaging Types
7.3.2.1 Environmental Advantage and Guaranteed Food Safety to Drive the EPS Market in Packaging Industry
7.3.3 Drivers
7.3.3.1 Demand for Convenience Food in Developing Economies
7.3.3.2 Increasing Demand for Protective Food Packaging
7.3.3.3 Increasing Trend of Smaller Pack
7.3.4 Restraints
7.3.4.1 Slow Growth of the Packaged Food Market in Developed Economies
7.3.5 Applications
7.3.5.1 Transport Packaging
7.3.5.2 Loose Fill Packaging
7.3.5.3 Protective and Display Packaging
7.4 Others
8 Expanded Polystyrene Market, By Region (Page No. - 68)
8.1 Introduction
8.1.1 Market: By Product Type
8.1.2 Market: By End-Use Industry
8.2 APAC
8.2.1 China
8.2.1.1 China Accounted for the Largest Market Size for EPS in APAC
8.2.2 South Korea
8.2.2.1 Increased Demand From the Construction Industry Contributes Significantly to the Growth of the EPS Market in the Country
8.2.3 India
8.2.3.1 India to Be the Fastest-Growing Country for EPS in APAC Region
8.2.4 Japan
8.2.4.1 Recovering Construction Industry to Drive the EPS Market in the Country
8.2.5 Thailand
8.2.5.1 Initiation of Large Infrastructure Projects By the Government to Fuel the Demand for EPS in the Country
8.2.6 Indonesia
8.2.6.1 Rising Consumer Awareness and A Hectic Lifestyle to Boost the Demand for EPS Packaging
8.2.7 Malaysia
8.2.7.1 Rapid Growth of the Economy and High Purchasing Power Have Made It One of the Major EPS Markets in the Asean Countries
8.2.8 Rest of APAC
8.3 Europe
8.3.1 Germany
8.3.1.1 Increasing Focus on the Construction Industry to Drive the EPS Market in the Country
8.3.2 Poland
8.3.2.1 Polish Building & Construction Industry to Grow at the Fastest CAGR
8.3.3 Russia
8.3.3.1 Demand for Thermal Insulation, Water-Resistant EPS Board, and Other Construction Materials to Drive the Russian EPS Market
8.3.4 Italy
8.3.4.1 New Construction Projects to Drive the Demand for EPS Market in the Country
8.3.5 Turkey
8.3.5.1 R&D Capabilities, Investments in Construction, and an Increase in Exports to Boost the Turkish EPS Market
8.3.6 France
8.3.6.1 Reviving Construction Industry to Fuel the Demand for EPS in France
8.3.7 Spain
8.3.7.1 Changing Consumer Habits as Well as Government Efforts to Prevent Food Wastage to Drive the EPS Packaging Industry
8.3.8 Czech Republic
8.3.8.1 Improved Economic Conditions, Low Interest Rates, and Increased Investment to Drive the EPS Market in the Country
8.3.9 UK
8.3.9.1 Consumer Preference for Sustainability and Quality are Expected to Drive the Demand for EPS Packaging Industry in the Uk
8.3.10 Rest of Europe
8.4 North America
8.4.1 US
8.4.1.1 Growth of Residential Housing Sector to Drive the EPS Market in the Country
8.4.2 Canada
8.4.2.1 Growth of the Economy and Construction Industry to Drive the EPS Market in the Country
8.4.3 Mexico
8.4.3.1 Strong Rebound in Exports and Improved Business Confidence to Strengthen the Mexican EPS Market
8.5 Middle East & Africa
8.5.1 Saudi Arabia
8.5.1.1 Increase in Population and Urbanization to Drive the EPS Building & Construction Industry in the Country
8.5.2 Africa
8.5.2.1 Surge in Construction Activities to Drive the EPS Market in the Country
8.5.3 Iran
8.5.3.1 Building & Construction to Lead the EPS Market in Iran
8.5.4 UAE
8.5.4.1 Large Scope for New Infrastructural Development to Drive the EPS Market
8.5.5 Rest of Middle East
8.6 South America
8.6.1 Brazil
8.6.1.1 Availability of Raw Materials for Packaging to Drive the EPS Market in the Country
8.6.2 Argentina
8.6.2.1 Favorable Construction Outlook to Drive the Country's EPS Market
8.6.3 Colombia
8.6.3.1 Demand for High-Performance, Cost-Effective, and Environmentally Advanced Building Products to Drive the EPS Market
8.6.4 Rest of South America
9 Competitive Landscape (Page No. - 115)
9.1 Introduction
9.2 Capacity Share Analysis
9.2.1 Global EPS Capacity Share
9.2.2 European EPS Capacity Share
9.2.3 North American EPS Capacity Share
9.3 Competitive Benchmarking
9.4 Competitive Scenario
9.4.1 Merger & Acquisition
9.4.2 Investment & Expansion
9.4.3 New Product Launch
9.4.4 Partnership & Agreement
10 Company Profiles (Page No. - 122)
(Business Overview, Products Offered, Recent Developments, SWOT Analysis, MnM View)
10.1 Wuxi Xingda New Foam Plastics Materials Co., Ltd.
10.2 Synthos S.A.
10.3 BASF SE
10.4 Total S.A.
10.5 Sunpor Kunststoff GmbH
10.6 The Ravago Group
10.7 Alpek, S.A.B. De C.V.
10.8 Versalis S.P.A.
10.9 Nova Chemicals Corporation
10.10 Flint Hills Resources, LLC
10.11 PJSC Sibur Holding
10.12 Saudi Basic Industries Corporation (SABIC)
10.13 Kaneka Corporation
10.14 Atlas Roofing Corporation
10.15 Bewisynbra Group
10.16 Brødr. Sunde A/S
10.17 Nexkemia Petrochemicals Inc.
10.18 Unipol Holland Bv
*Details on Business Overview, Products Offered, Recent Developments, SWOT Analysis, MnM View Might Not Be Captured in Case of Unlisted Companies.
11 Appendix (Page No. - 147)
11.1 Discussion Guide
11.2 Knowledge Store: Marketsandmarkets’ Subscription Portal
11.3 Available Customizations
11.4 Related Reports
11.5 Author Details
List of Tables (145 Tables)
Table 1 Expanded Polystyrene Market Snapshot, 2018 vs 2023
Table 2 Major Planned Construction Projects in China
Table 3 EPS vs Molded Pulp
Table 4 North America: EPS Processing Companies
Table 5 Europe: EPS Processing Companies
Table 6 APAC: EPS Processing Companies
Table 7 Middle East & Africa: EPS Processing Companies
Table 8 Expanded Polystyrene Market Size, By Product Type, 2016–2023 (USD Million)
Table 9 Expanded Polystyrene (EPS) Market Size, By Product Type, 2016–2023 (Kiloton)
Table 10 White Expanded Polystyrene Market Size, By Region, 2016–2023 (USD Million)
Table 11 White Expanded Polystyrene (EPS) Market By Size, By Region, 2016–2023 (Kiloton)
Table 12 Grey Expanded Polystyrene Market Size, By Region, 2016–2023 (USD Million)
Table 13 Grey EPS Market By Size, By Region, 2016–2023 (Kiloton)
Table 14 Black Expanded Polystyrene Market Size, By Region, 2016–2023 (USD Million)
Table 15 Black EPS Market By Size, By Region, 2016–2023 (Kiloton)
Table 16 Expanded Polystyrene (EPS) Market Size, By End-Use Industry, 2016–2023 (USD Million)
Table 17 Expanded Polystyrene (EPS) Market Size, By End-Use Industry, 2016–2023 (Kiloton)
Table 18 Expanded Polystyrene (EPS) Market Size in Building & Construction, By Region, 2016–2023 (USD Million)
Table 19 By Market Size in Building & Construction, By Region, 2016–2023 (Kiloton)
Table 20 Properties of EPS for the Building & Construction End-Use Industry
Table 21 Expanded Polystyrene Market Size in Packaging, By Region, 2016–2023 (USD Million)
Table 22 Expanded Polystyrene (EPS) Market Size in Packaging, By Region, 2016–2023 (Kiloton)
Table 23 By Market Size in Packaging, By Type, 2016–2023 (USD Million)
Table 24 Expanded Polystyrene (EPS) Market Size in Packaging, By Type, 2016-2023 (Kiloton)
Table 25 By Market Size in Food Service Packaging, By Type, 2016–2023 (USD Million)
Table 26 Expanded Polystyrene (EPS) Market Size in Food Service Packaging, By Type, 2016–2023 (Kiloton)
Table 27 Properties of EPS for the Packaging End-Use Industry
Table 28 Expanded Polystyrene Market Size in Other End-Use Industries, By Region, 2016–2023 (USD Million)
Table 29 By Market Size in Other End-Use Industries, By Region, 2016–2023 (Kiloton)
Table 30 Expanded Polystyrene (EPS) Market Size, By Region, 2016–2023 (USD Million)
Table 31 By Market Size, By Region, 2016–2023 (Kiloton)
Table 32 APAC: Expanded Polystyrene Market Size, By Country, 2016–2023 (USD Million)
Table 33 APAC: Expanded Polystyrene (EPS) Market Size, By Country, 2016–2023 (Kiloton)
Table 34 APAC: By Market Size, By Product Type, 2016–2023 (USD Million)
Table 35 APAC: Expanded Polystyrene (EPS) Market Size, By Product Type, 2016–2023 (Kiloton)
Table 36 APAC:By Market Size, By End-Use Industry, 2016–2023 (USD Million)
Table 37 APAC: By Market Size, By End-Use Industry, 2016–2023 (Kiloton)
Table 38 China: Expanded Polystyrene Market Import & Export Trend, 2013–2017 (Kiloton)
Table 39 China: By Market Size, By End-Use Industry, 2016–2023 (USD Million)
Table 40 China: By Market Size, By End-Use Industry, 2016–2023 (Kiloton)
Table 41 South Korea: Expanded Polystyrene (EPS) Market Import & Export Trend, 2013–2017 (Kiloton)
Table 42 South Korea: EPS Market Size, By End-Use Industry, 2016–2023 (USD Million)
Table 43 South Korea: Expanded Polystyrene (EPS) Market Size, By End-Use Industry, 2016–2023 (Kiloton)
Table 44 India: EPS Import & Export Trend, 2013–2017 (Kiloton)
Table 45 India: EPS Market Size, By End-Use Industry, 2016–2023 (USD Million)
Table 46 India: Expanded Polystyrene (EPS) Market Size, By End-Use Industry, 2016–2023 (Kiloton)
Table 47 Japan: EPS Import & Export Trend, 2013–2017 (Kiloton)
Table 48 Japan: EPS Market Size, By End-Use Industry, 2016–2023 (USD Million)
Table 49 Japan: Expanded Polystyrene (EPS) Market Size, By End-Use Industry, 2016–2023 (Kiloton)
Table 50 Thailand: EPS Market Size, By End-Use Industry, 2016–2023 (USD Million)
Table 51 Thailand: Expanded Polystyrene (EPS) Market Size, By End-Use Industry, 2016–2023 (Kiloton)
Table 52 Indonesia: EPS Import & Export Trend, 2013–2017 (Kiloton)
Table 53 Indonesia: Expanded Polystyrene (EPS) Market Size, By End-Use Industry, 2016–2023 (USD Million)
Table 54 Indonesia: EPS Market Size, By End-Use Industry, 2016–2023 (Kiloton)
Table 55 Malaysia:Expanded Polystyrene (EPS) Market Size, By End-Use Industry, 2016–2023 (USD Million)
Table 56 Malaysia: EPS Market Size, By End-Use Industry, 2016–2023 (Kiloton)
Table 57 Rest of APAC: Expanded Polystyrene (EPS) Market Size, By End-Use Industry, 2016–2023 (USD Million)
Table 58 Rest of APAC: EPS Market Size, By End-Use Industry, 2016–2023 (Kiloton)
Table 59 Europe: Expanded Polystyrene Market Size, By Country, 2016–2023 (USD Million)
Table 60 Europe: EPS Market Size, By Country, 2016–2023 (Kiloton)
Table 61 Europe: Expanded Polystyrene (EPS) Market Size, By Product Type, 2016–2023 (USD Million)
Table 62 Europe: EPS Market Size, By Product Type, 2016–2023 (Kiloton)
Table 63 Europe: Expanded Polystyrene (EPS) Market Size, By End-Use Industry, 2016–2023 (USD Million)
Table 64 Europe: EPS Market Size, By End-Use Industry, 2016–2023 (Kiloton)
Table 65 Germany: EPS Import Trend, 2013–2017 (Kiloton)
Table 66 Germany: Expanded Polystyrene (EPS) Market Size, By End-Use Industry, 2016–2023 (USD Million)
Table 67 Germany: EPS Market Size, By End-Use Industry, 2016–2023 (Kiloton)
Table 68 Poland: EPS Import & Export Trend, 2013–2017 (Kiloton)
Table 69 Poland: Expanded Polystyrene (EPS) Market Size, By End-Use Industry, 2016–2023 (USD Million)
Table 70 Poland: EPS Market Size, By End-Use Industry, 2016–2023 (Kiloton)
Table 71 Russia: EPS Import Trend, 2013–2017 (Kiloton)
Table 72 Russia: Expanded Polystyrene (EPS) Market Size, By End-Use Industry, 2016–2023 (USD Million)
Table 73 Russia: EPS Market Size, By End-Use Industry, 2016–2023 (Kiloton)
Table 74 Italy: Expanded Polystyrene Import & Export Trend, 2013–2017 (Kiloton)
Table 75 Italy: EPS Market Size, By End-Use Industry, 2016–2023 (USD Million)
Table 76 Italy: Expanded Polystyrene (EPS) Market Size, By End-Use Industry, 2016–2023 (Kiloton)
Table 77 Turkey: EPS Import & Export Trend, 2013–2017 (Kiloton)
Table 78 Turkey: EPS Market Size, By End-Use Industry, 2016–2023 (USD Million)
Table 79 Turkey: Expanded Polystyrene (EPS) Market Size, By End-Use Industry, 2016–2023 (Kiloton)
Table 80 France: EPS Import & Export Trend, 2013–2017 (Kiloton)
Table 81 France: EPS Market Size, By End-Use Industry, 2016–2023 (USD Million)
Table 82 France: Expanded Polystyrene (EPS) Market Size, By End-Use Industry, 2016–2023 (Kiloton)
Table 83 Spain: EPS Import & Export Trend, 2013–2017 (Kiloton)
Table 84 Spain: EPS Market Size, By End-Use Industry, 2016–2023 (USD Million)
Table 85 Spain: EPS Market Size, By End-Use Industry, 2016–2023 (Kiloton)
Table 86 Czech Republic: EPS Market Size, By End-Use Industry, 2016–2023 (USD Million)
Table 87 Czech Republic: EPS Market Size, By End-Use Industry, 2016–2023 (Kiloton)
Table 88 UK: Expanded Polystyrene Import & Export Trend, 2013–2017 (Kiloton)
Table 89 UK: EPS Market Size, By End-Use Industry, 2016–2023 (USD Million)
Table 90 UK: EPS Market Size, By End-Use Industry, 2016–2023 (Kiloton)
Table 91 Rest of Europe: Expanded Polystyrene Market Size, By End-Use Industry, 2016–2023 (USD Million)
Table 92 Rest of Europe: EPS Market Size, By End-Use Industry, 2016–2023 (Kiloton)
Table 93 North America: Expanded Polystyrene (EPS) Market Size, By Country, 2016–2023 (USD Million)
Table 94 North America: EPS Market Size, By Country, 2016–2023 (Kiloton)
Table 95 North America: EPS Market Size, By Product Type, 2016–2023 (USD Million)
Table 96 North America: EPS Market Size, By Product Type, 2016–2023 (Kiloton)
Table 97 North America: Expanded Polystyrene (EPS) Market Size, By End-Use Industry, 2016–2023 (USD Million)
Table 98 North America: EPS Market Size, By End-Use Industry, 2016–2023 (Kiloton)
Table 99 US: EPS Import & Export Trend, 2013–2017 (Kiloton)
Table 100 US: EPS Market Size, By End-Use Industry, 2016–2023 (USD Million)
Table 101 US: Expanded Polystyrene (EPS) Market Size, By End-Use Industry, 2016–2023 (Kiloton)
Table 102 Canada: Expanded Polystyrene Import & Export Trend, 2013–2017 (Kiloton)
Table 103 Canada: EPS Market Size, By End-Use Industry, 2016–2023 (USD Million)
Table 104 Canada: Expanded Polystyrene (EPS) Market Size, By End-Use Industry, 2016–2023 (Kiloton)
Table 105 Mexico: EPS Import & Export Trend, 2013–2017 (Kiloton)
Table 106 Mexico: Expanded Polystyrene (EPS) Market Size, By End-Use Industry, 2016–2023 (USD Million)
Table 107 Mexico: EPS Market Size, By End-Use Industry, 2016–2023 (Kiloton)
Table 108 Middle East & Africa: Expanded Polystyrene Market Size, By Country, 2016–2023 (USD Million)
Table 109 Middle East & Africa: EPS Market Size, By Country, 2016–2023 (Kiloton)
Table 110 Middle East & Africa: Expanded Polystyrene (EPS) Market Size, By Product Type, 2016–2023 (USD Million)
Table 111 Middle East & Africa: EPS Market Size, By Product Type, 2016–2023 (Kiloton)
Table 112 Middle East & Africa: EPS Market Size, By End-Use Industry, 2016–2023 (USD Million)
Table 113 Middle East & Africa: Expanded Polystyrene (EPS) Market Size, By End-Use Industry, 2016–2023 (Kiloton)
Table 114 Saudi Arabia: EPS Market Size, By End-Use Industry, 2016–2023 (USD Million)
Table 115 Saudi Arabia: Expanded Polystyrene (EPS) Market Size, By End-Use Industry, 2016–2023 (Kiloton)
Table 116 Africa: Expanded Polystyrene Market Size, By End-Use Industry, 2016–2023 (USD Million)
Table 117 Africa: EPS Market Size, By End-Use Industry, 2016–2023 (Kiloton)
Table 118 Iran: EPS Market Size, By End-Use Industry, 2016–2023 (USD Million)
Table 119 Iran: Expanded Polystyrene (EPS) Market Size, By End-Use Industry, 2016–2023 (Kiloton)
Table 120 UAE: EPS Market Size, By End-Use Industry, 2016–2023 (USD Million)
Table 121 UAE: EPS Market Size, By End-Use Industry, 2016–2023 (Kiloton)
Table 122 Rest of Middle East: EPS Market Size, By End-Use Industry, 2016–2023 (USD Million)
Table 123 Rest of Middle East: Expanded Polystyrene (EPS) Market Size, By End-Use Industry, 2016–2023 (Kiloton)
Table 124 South America: Expanded Polystyrene Market Size, By Country, 2016–2023 (USD Million)
Table 125 South America: EPS Market Size, By Country, 2016–2023 (Kiloton)
Table 126 South America: EPS Market Size, By Product Type, 2016–2023 (USD Million)
Table 127 South America: EPS Market Size, By Product Type, 2016–2023 (Kiloton)
Table 128 South America: Expanded Polystyrene (EPS) Market Size, By End-Use Industry, 2016–2023 (USD Million)
Table 129 South America: EPS Market Size, By End-Use Industry, 2016–2023 (Kiloton)
Table 130 Brazil: EPS Import & Export Trend, 2013–2017 (Kiloton)
Table 131 Brazil: EPS Market Size, By End-Use Industry, 2016–2023 (USD Million)
Table 132 Brazil: Expanded Polystyrene (EPS) Market Size, By End-Use Industry, 2016–2023 (Kiloton)
Table 133 Argentina: Expanded Polystyrene Import & Export Trend, 2013–2017 (Kiloton)
Table 134 Argentina: Expanded Polystyrene Market Size, By End-Use Industry, 2016–2023 (USD Million)
Table 135 Argentina: By Market Size, By End-Use Industry, 2016–2023 (Kiloton)
Table 136 Colombia: Expanded Polystyrene Import & Export Trend, 2013–2017 (Kiloton)
Table 137 Colombia: Expanded Polystyrene Market Size, By End-Use Industry, 2016–2023 (USD Million)
Table 138 Colombia: By Market Size, By End-Use Industry, 2016–2023 (Kiloton)
Table 139 Rest of South America: EPS Market Size, By End-Use Industry, 2016–2023 (USD Million)
Table 140 Rest of South America: Expanded Polystyrene (EPS) Market Size, By End-Use Industry, 2016–2023 (Kiloton)
Table 141 Brand Influence on the EPS Market
Table 142 Merger & Acquisition, 2015–2018
Table 143 Investment & Expansion, 2015–2018
Table 144 New Product Launch, 2015–2018
Table 145 Partnership & Agreement, 2015–2018
List of Figures (51 Figures)
Figure 1 Expanded Polystyrene (EPS) Market Segmentation
Figure 2 EPS Market: Research Design
Figure 3 Expanded Polystyrene (EPS) Market Size Estimation: Bottom-Up Approach
Figure 4 Market Size Estimation: Top-Down Approach
Figure 5 EPS Market: Data Triangulation
Figure 6 Grey EPS to Register the Highest CAGR in the Market
Figure 7 Building & Construction to Be Fastest-Growing End-Use Industry
Figure 8 APAC to Dominate the EPS Market
Figure 9 Emerging Economies to Offer Lucrative Growth Opportunities for Market Players
Figure 10 White EPS to Be the Largest Product Type
Figure 11 Building & Construction Segment to Account for the Largest Market Share in 2018
Figure 12 EPS Market to Grow at A Faster Rate in Developing Countries
Figure 13 China to Dominate the EPS Market
Figure 14 India to Register the Highest CAGR in the Market
Figure 15 Overview of Factors Governing the EPS Market
Figure 16 West Texas Intermediate (WTI) Crude Oil Price Trend From 2007 to 2017
Figure 17 EPS Industry: Value Chain Analysis
Figure 18 EPS Market: Porter’s Five Forces Analysis
Figure 19 EPS vs XPS
Figure 20 EPS Manufacturing Process
Figure 21 Grey EPS Segment to Register the Highest CAGR
Figure 22 APAC Was the Largest White EPS Market in 2017
Figure 23 White EPS vs Silver EPS
Figure 24 High Growth in Major End-Use Industries to Drive the EPS Market
Figure 25 Building & Construction to Be the Largest End-Use Industry of EPS
Figure 26 India to Register the Highest CAGR in the EPS Market
Figure 27 North America to Emerge as A Potential Market for Grey EPS
Figure 28 Building & Construction Segment to Register the Highest CAGR in APAC
Figure 29 APAC: EPS Market Snapshot
Figure 30 Rise in Building & Construction Activities to Drive the EPS Market in Europe
Figure 31 North America: EPS Market Snapshot
Figure 32 Saudi Arabia is the Key EPS Market in the Region
Figure 33 South America to Be an Emerging EPS Market
Figure 34 Companies Adopted Merger & Acquisition as the Key Growth Strategy Between 2015 and 2018
Figure 35 Global EPS Capacity Share of Key Players in 2017
Figure 36 European EPS Capacity Share of Key Players in 2017
Figure 37 North American EPS Capacity Share of Key Players in 2017
Figure 38 Synthos S.A.: Company Snapshot
Figure 39 Synthos S.A.: SWOT Analysis
Figure 40 BASF SE: Company Snapshot
Figure 41 BASF SE: SWOT Analysis
Figure 42 Total S.A.: Company Snapshot
Figure 43 Total S.A.: SWOT Analysis
Figure 44 Sunpor Kunststoff GmbH: SWOT Analysis
Figure 45 Alpek, S.A. B. De C.V.: Company Snapshot
Figure 46 Alpek, S.A.B. De C.V.: SWOT Analysis
Figure 47 Nova Chemicals Corporation: Company Snapshot
Figure 48 PJSC Sibur Holding: Company Snapshot
Figure 49 Saudi Basic Industries Corporation (SABIC): Company Snapshot
Figure 50 Kaneka Corporation: Company Snapshot
Figure 51 Bewisynbra Group: Company Snapshot


Growth opportunities and latent adjacency in Expanded Polystyrene (EPS) Market
EPS granules suppliers profile
Custom information in terms of market data for EPS and XPS consumption in North America in construction segment.
Looking for specific applications of EPS such as food-ware
Specific information on Brazil EPS market
Interested in foam fabricators
Looking for applications of EPS and market by region and country\
Market data on white and gray EPS market for buidling & construction end-use industry
Wants information on the EPS and the bubble wrap market
Interested in Expanded Polystyrene market
Information on EPS market
Insights on sustainablesights on expanded polystyrene.
Interested in industries like Building & Construction and Packaging and region North America, Canada and Ontario
Information on market demand for distributors particularly Latin America
Basic purchasing query about report ordering and 10% customization
Information on EPS market
"Price of different grades of EPS: 1 Grey EPS (Neopore type) and Black EPS (Excel - R), White EPS for packaging and construction. 2- Overall market size (tons/y) with breakdown by Region 3- Applications (tons/y)and type of EPS usage"