Cladding Systems Market by Material (Ceramic, Wood, Brick & Stone, Vinyl, Stucco & EIFS, Metal, Fiber Cement), Type, Application (Residential, Non-Residential), and Region (North America, Europe, APAC, MEA, South America) - Global Forecast to 2028
Updated on : August 22, 2025
Cladding Systems Market
The global cladding systems market was valued at USD 268.4 billion in 2023 and is projected to reach USD 347.7 billion by 2028, growing at 5.2% cagr from 2023 to 2028. The cladding industry has seen significant technological advancements in recent years, including the development of lightweight and prefabricated cladding systems. These innovations have made cladding systems easier to install, less labor-intensive, and more efficient overall. Additionally, advances in digital design tools and computer-aided manufacturing have improved the precision and customization options for cladding systems. In many urban areas, there is a need to renovate existing buildings to meet modern standards and improve energy efficiency. Cladding systems offer a practical solution for these retrofitting projects, as they can transform old structures into visually appealing, well-insulated, and sustainable buildings. The growing focus on urban renewal and retrofitting initiatives is contributing to the growth of the cladding systems market.
Cladding Systems Market Forecast & Trends
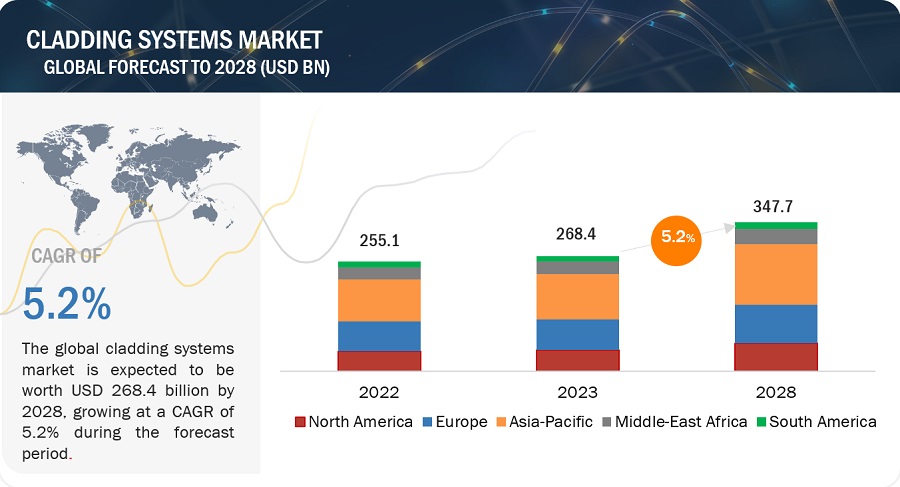
To know about the assumptions considered for the study, Request for Free Sample Report
Attractive Opportunities in the Cladding Systems Market
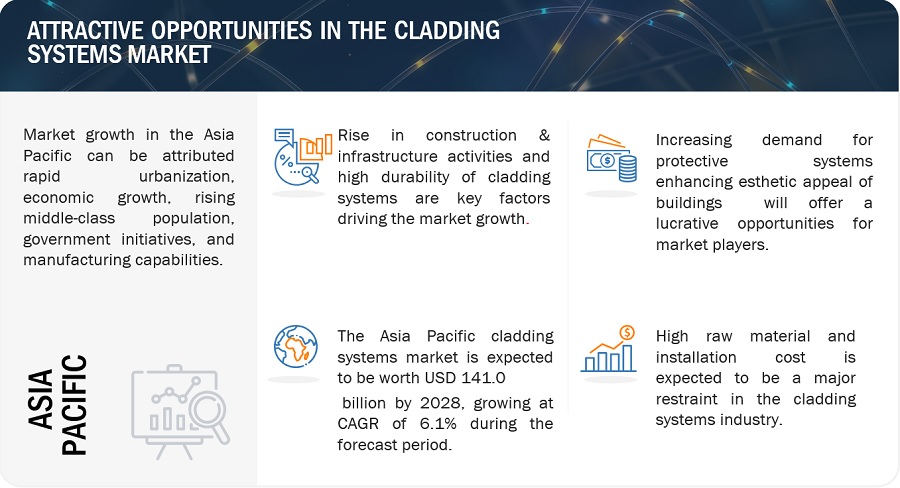
Cladding Systems Market Dynamics
Driver: High durability of cladding systems
The durability of cladding systems may be defined based on their ability to withstand various weathering actions and resist chemical attacks & deterioration. All cladding systems undergo a certain amount of degradation, owing to moisture, UV rays, and other atmospheric pollutions. However, cladding systems can have a considerably longer life and could last for hundreds of years. Regular maintenance also adds up to the life of the building envelope. Various coatings may be applied on the surface of cladding systems to enhance their functional properties and also elongate the life of cladding sheets. Detailing is an important parameter that tends to increase the life of a cladding system. Careful detailing can prevent accumulation of water and dirt by specifying external passages such as slopes, slide laps, and end laps. Therefore, proper detailing, coatings, and regular maintenance can provide significant benefits, such as longer life of the building envelope and improved safety, to customers.
Restraint: High raw material and installation cost
High raw material and installation costs can act as restraints in the cladding systems market. Fluctuating raw material prices, scarcity, and increased demand can result in higher costs for cladding manufacturers and suppliers, potentially affecting the affordability of cladding systems. Complex installation processes and skilled labor requirements contribute to higher installation costs, which can deter some construction projects. Limited budgets, cost-sensitive markets, and economic conditions also impact the demand for cladding systems. To address these restraints, manufacturers can focus on optimizing processes, exploring alternative materials, and streamlining installation techniques to reduce costs and increase affordability.
Opportunities: Rise in population and urbanization in emerging economies
The growing population in emerging economies presents a significant opportunity for the cladding systems market. Rapid urbanization, increased construction activities, and rising middle-class populations drive the demand for housing, commercial buildings, and infrastructure development. As urban centers expand and infrastructure modernization takes place, there is a need for cladding systems to enhance the aesthetic appeal, functionality, and sustainability of buildings. Government initiatives and investment in construction projects further support the market's growth. The market can capitalize on this opportunity by offering a range of cladding solutions that meet energy efficiency standards and cater to the evolving needs of emerging economies, contributing to their development and urban transformation.
Challenges: High cost of repairing
Repairing damaged or deteriorated cladding systems often involves the replacement of materials and skilled labor. The cost of sourcing the specific cladding materials, especially if they are specialized or unique, can be high. Additionally, the expertise and labor required for dismantling and installing new cladding components can further escalate the repair costs.
Cladding Systems Market Ecosystem
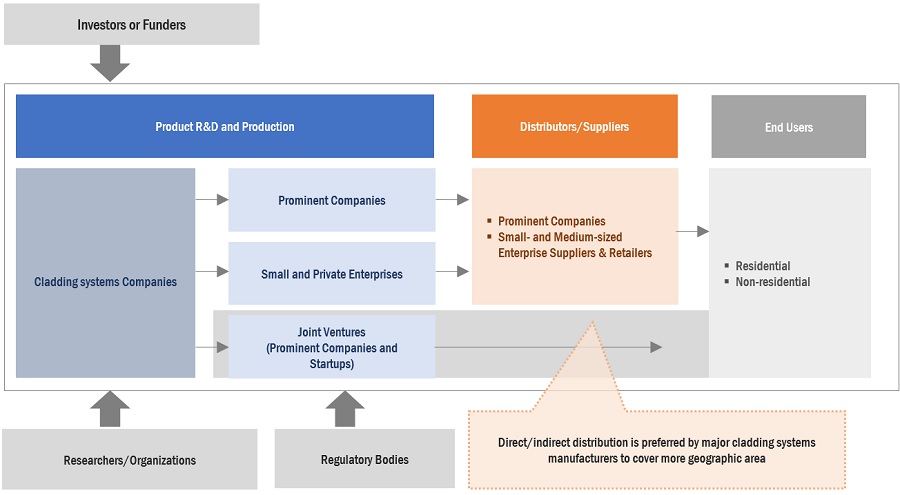
By Material, Ceramic accounted for the highest CAGR during the forecast period.
Ceramic cladding material has emerged as a rapidly growing option in the cladding systems market due to its combination of aesthetic appeal, durability, sustainability, thermal insulation, moisture resistance, and fire safety features. It provides a unique blend of functional and design benefits that cater to the evolving needs and preferences of the construction industry and building owners alike.
By Type, Walls accounted for the highest CAGR during the forecast period
The increasing demand for wall cladding solutions in the construction industry can be attributed to various factors, including aesthetic considerations, energy efficiency requirements, building envelope protection, retrofitting projects, and technological advancements. These factors collectively drive the faster growth of wall cladding by addressing the need for visually appealing exteriors, improved energy performance, enhanced building durability, and the modernization of existing structures. As the construction industry continues to evolve, the demand for innovative and sustainable wall cladding solutions is expected to further fuel the growth of this segment.
By Application, Residential accounted for the highest CAGR during the forecast period
The growth of the residential application segment in the cladding systems market has been fueled by a combination of factors, including aesthetic appeal, energy efficiency, durability, low maintenance requirements, renovation opportunities, and technological advancements. These factors have contributed to the increasing demand for cladding systems in residential construction, as homeowners prioritize visually appealing, sustainable, and energy-efficient solutions for their homes. With the ongoing emphasis on creating sustainable and aesthetically pleasing living spaces, the residential sector is expected to continue driving the growth of the cladding systems market.
Asia Pacific is projected to account for the highest CAGR in the cladding systems market during the forecast period
The strong demand for cladding solutions in the Asia Pacific region is driven by rapid urbanization, robust economic growth, an expanding middle-class population, government initiatives, and advanced manufacturing capabilities. The region's urbanization trends and increasing population have led to a surge in construction activities, creating a higher need for cladding solutions to enhance building aesthetics, functionality, and durability. Additionally, the support of government initiatives and the region's manufacturing capabilities further contribute to the strong demand for cladding systems in the Asia Pacific market.
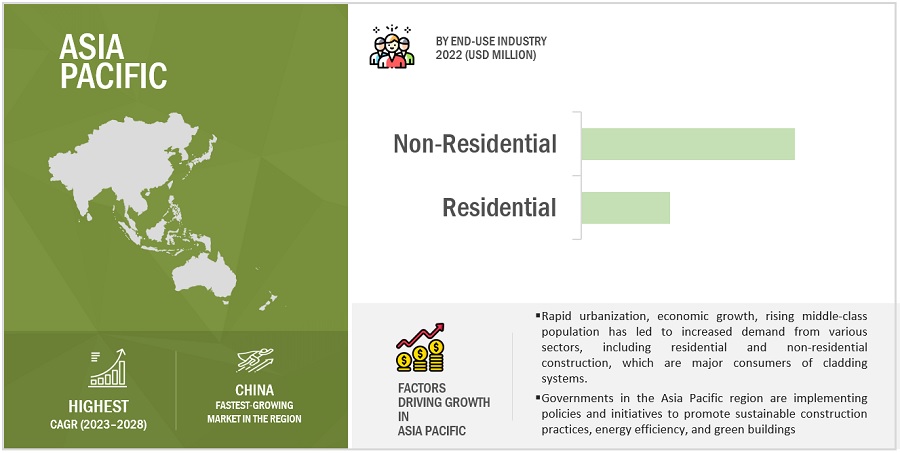
To know about the assumptions considered for the study, download the pdf brochure
Cladding Systems Market Players
Cladding systems market comprises key players such as Compagnie de Saint-Gobain S.A. (France), DowDuPont (US), Tata Steel Limited (India), Arconic (US), Westlake Chemical (US), Etex Group (Belgium), James Hardie Industries PLC (Ireland) and others. Expansions, acquisitions, joint ventures, and new product developments are some of the major strategies adopted by these key players to enhance their positions in the cladding systems market. Major focus was given to the new product development due to the changing requirements of transportation and electronics product consumers across the world.
Cladding Systems Market Report Scope
|
Report Metric |
Details |
|
Years Considered |
2021–2028 |
|
Base year |
2022 |
|
Forecast period |
2023–2028 |
|
Unit considered |
Value (USD Million/Billion), Volume (Million Square Meters) |
|
Segments |
Material, Type, Application, and Region |
|
Regions |
North America, Asia Pacific, Europe, South America, and Rest of the World |
|
Companies |
The major players are Dow Inc. (US), Compagnie de Saint-Gobain S.A. (France), Tata Steel Limited (India), Arconic (US), and Westlake Chemical (US). |
This research report categorizes the global cladding systems market based on Material, Type, Application, and Region
Cladding Systems Market on the basis of Material:
- Ceramic
- Brick & Stone
- Metal
- Wood
- Vinyl
- Stucco & EIFS
- Fiber Cement
- Others (concrete and weatherboard)
Cladding Systems Market on the basis of Type:
- Walls
- Roofs
- Others (vents and gutters)
Cladding Systems Market on the basis of Application:
- Residential
- Non-Residential
Cladding Systems Market on the basis of Region:
- North America
- Asia Pacific
- Europe
- South America
- Middle East & Africa
The market has been further analyzed for the key countries in each of these regions.
Recent Developments
- In June 2023, Saint-Gobain announced that it had entered into a definitive agreement for the acquisition of Building Products of Canada Corp. ("Building Products of Canada"), a privately owned manufacturer of residential roofing shingles and wood fiber insulation panels in Canada.
- In June 2023, Westlake Corporation entered into a definitive agreement with Boral Industries Inc., a wholly owned subsidiary of Boral Limited, under which Westlake acquired Boral's North American building products businesses in roofing, siding, trim and shutters, decorative stone, and windows.
- In June 2023, Etex successfully completed the acquisition of Superglass, a UK-based insulation producer. Through this agreement, Etex expands its European reach in sustainable insulation, complementing its existing presence as a manufacturer of glass mineral wool and extruded polystyrene through URSA.
- In January 2023, Saint-Gobain completed the acquisition of Igland Industrier AS, a manufacturer of prefabricated garages for villas, which also has an assembly services network in Norway.
- In June 2022, Etex continued its portfolio shift towards lightweight and sustainable building solutions by completing the acquisition of insulation expert URSA.
Frequently Asked Questions (FAQ):
What are the major drivers driving the growth of the cladding systems market?
The cladding systems is expected to witness significant growth in the future due to rise in construction & infrastructure activities and high durability of cladding systems.
What are the major challenges in the cladding systems market?
The major challenge in the cladding systems market is high repair cost.
What are the restraining factors in the cladding systems market?
The major restraining factor faced by the cladding systems market is high raw material and installation cost.
What is the key opportunity in the cladding systems market?
Increasing demand for protective systems enhancing aesthetic appeal of buildings and rise in population and urbanization in emerging economies are key opportunity in the cladding systems market.
What are the end-use industries where cladding systems are used?
The cladding systems are majorly used in residential and non-residential constructions. .
To speak to our analyst for a discussion on the above findings, click Speak to Analyst


- 5.1 INTRODUCTION
- 5.2 EVOLUTION OF CLADDING SYSTEMS
-
5.3 MARKET DYNAMICSDRIVERS- Growth in construction industry- Increasing investments in infrastructure- High durability of cladding systemsRESTRAINTS- High raw material and installation costsOPPORTUNITIES- Rising demand for protective systems to enhance esthetic appeal of buildings- Population growth and urbanization in emerging economies- Surge in demand for fiber cement in cladding systems- Increase in demand for sustainable cladding materialsCHALLENGES- High costs of repairing
- 6.1 INTRODUCTION
-
6.2 CLADDING SYSTEMS MARKET, BY MATERIALCERAMIC- Increasing demand in construction industry to drive marketWOOD- Increasing demand in green buildings to drive marketSTUCCO & EIFS- Fire resistance and attractive appearance of stucco to drive demandBRICK & STONE- Increase in applications in residential sector to drive demandMETAL- Increasing need for low-cost and durable materials to drive demandVINYL- High preference in residential sector to drive marketFIBER CEMENT- High strength and durability to drive growthOTHERS
- 7.1 INTRODUCTION
-
7.2 WALLSRISE IN RESIDENTIAL AND NON-RESIDENTIAL CONSTRUCTION PROJECTS TO DRIVE DEMAND
-
7.3 ROOFSROOFS SEGMENT TO RECORD SECOND-HIGHEST GROWTH RATE
- 7.4 OTHERS
- 8.1 INTRODUCTION
-
8.2 RESIDENTIALFAVORABLE POLICIES TO DRIVE SALES OF RESIDENTIAL CONSTRUCTION PROJECTS
-
8.3 NON-RESIDENTIALGROWING NEW NON-RESIDENTIAL CONSTRUCTION ACTIVITIES TO DRIVE DEMANDNON-RESIDENTIAL MARKET, BY SUBSEGMENTINDUSTRIALCOMMERCIALOTHERS
- 9.1 INTRODUCTION
-
9.2 ASIA PACIFICCHINA- To grow at the highest rate throughout forecast periodJAPAN- Stucco & EIFS segment to grow at highest CAGRINDIA- Ceramic segment to grow at highest rateAUSTRALIA- Brick & stone segment to account for largest shareSOUTH KOREA- Brick & stone segment to lead marketREST OF ASIA PACIFIC
-
9.3 EUROPEGERMANY- Fiber cement segment to witness high growthFRANCE- Non-residential projects to provide growth opportunitiesUK- Construction & renovation activities to boost demandITALY- Growing housing sector to propel marketSPAIN- Increasing adoption of lightweight and durable cladding materials to drive marketREST OF EUROPE
-
9.4 NORTH AMERICAUS- US to account for largest share in North American marketCANADA- Vinyl segment to grow at highest CAGRMEXICO- Increase in commercial construction to create significant demand
-
9.5 MIDDLE EAST & AFRICATURKEY- Turkey to lead market in regionSAUDI ARABIA- To be second-fastest-growing marketUAE- Phenomenal growth in construction sector to drive marketSOUTH AFRICA- Rapid urbanization and demand for sustainable buildings to drive marketREST OF MIDDLE EAST & AFRICA
-
9.6 SOUTH AMERICABRAZIL- To account for largest share in South AmericaARGENTINA- Increasing construction investments to drive marketREST OF SOUTH AMERICA

- 10.1 INTRODUCTION
- 10.2 STRATEGIES ADOPTED BY KEY PLAYERS
-
10.3 MARKET SHARE ANALYSISRANKING OF KEY MARKET PLAYERSMARKET SHARE OF KEY PLAYERS, 2022- Dow Inc.- Compagnie de Saint-Gobain S.A.- Tata Steel Limited- Arconic- Westlake Chemical
-
10.4 COMPANY EVALUATION MATRIXSTARSPERVASIVE PLAYERSEMERGING LEADERSPARTICIPANTS
-
10.5 STARTUP/SMALL AND MEDIUM-SIZED ENTERPRISES (SMES) EVALUATION QUADRANTPROGRESSIVE COMPANIESRESPONSIVE COMPANIESSTARTING BLOCKSDYNAMIC COMPANIES
-
10.6 COMPETITIVE SITUATIONS AND TRENDSDEALS
-
11.1 KEY COMPANIESCOMPAGNIE DE SAINT-GOBAIN S.A.- Business overview- Products/ Solutions/Services- Recent developments- MnM viewDOW INC.- Business overview- Products/Solutions/Services offered- MnM viewTATA STEEL LIMITED- Business overview- MnM viewARCONIC CORPORATION- Business overview- Products/Solutions/Services offered- MnM viewWESTLAKE CORPORATION- Business overview- Products/Solutions/Services offered- Recent developments- MnM viewETEX GROUP- Business overview- Products/Solutions/Services offered- Recent developments- MnM viewJAMES HARDIE INDUSTRIES PLC- Business overview- Products/Solutions/Services offered- Recent developments- MnM viewCSR LIMITED- Business overview- Products/Solutions/Services offered- MnM viewNICHIHA CORPORATION- Business overview- Products/Solutions/Services offered- MnM viewBORAL LIMITED- Business overview- Products/Solutions/Services offered- MnM view
-
11.2 OTHER PLAYERSSWISSPEARL GROUP AGLOUISIANA PACIFIC CORPORATIONKINGSPAN GROUP PLCCOVERWORLD UKWESTMAN STEELCA GROUP LIMITEDARCELORMITTALCAREATIMCOMIDDLE EAST INSULATION LLCTRESPA INTERNATIONAL B.V.DUMAPLASTACCORD FLOORS
- 12.1 DISCUSSION GUIDE
- 12.2 KNOWLEDGESTORE: MARKETSANDMARKETS’ SUBSCRIPTION PORTAL
- 12.3 CUSTOMIZATION OPTIONS
- 12.4 RELATED REPORTS
- 12.5 AUTHOR DETAILS
- TABLE 1 USD CONVERSION RATES, 2020–2022
- TABLE 2 DECIDING FACTORS WHILE SELECTING A CLADDING MATERIAL
- TABLE 3 CLADDING SYSTEMS MARKET, BY MATERIAL, 2021–2028 (USD MILLION)
- TABLE 4 CLADDING SYSTEMS MARKET, BY MATERIAL, 2021–2028 (MILLION SQ. MT.)
- TABLE 5 PROS AND CONS OF WOOD CLADDING SYSTEMS
- TABLE 6 PROS AND CONS OF STUCCO & EIFS CLADDING SYSTEMS
- TABLE 7 PROS AND CONS OF BRICK & STONE CLADDING SYSTEMS
- TABLE 8 PROS AND CONS OF METAL CLADDING SYSTEMS
- TABLE 9 PROS AND CONS OF VINYL CLADDING SYSTEMS
- TABLE 10 PROS AND CONS OF FIBER CEMENT CLADDING SYSTEMS
- TABLE 11 PROS AND CONS OF WEATHERBOARD AND CONCRETE CLADDING SYSTEMS
- TABLE 12 CLADDING SYSTEMS MARKET, BY TYPE, 2021–2028 (USD MILLION)
- TABLE 13 CLADDING SYSTEMS MARKET, BY TYPE, 2021–2028 (MILLION SQ. MT.)
- TABLE 14 CLADDING SYSTEMS MARKET, BY APPLICATION, 2021–2028 (USD MILLION)
- TABLE 15 CLADDING SYSTEMS MARKET, BY APPLICATION, 2021–2028 (MILLION SQ. MT.)
- TABLE 16 CLADDING SYSTEMS MARKET, BY NON-RESIDENTIAL APPLICATION, 2021–2028 (USD MILLION)
- TABLE 17 CLADDING SYSTEMS MARKET, BY NON-RESIDENTIAL APPLICATION, 2021–2028 (MILLION SQ. MT.)
- TABLE 18 CLADDING SYSTEMS MARKET, BY REGION, 2021–2028 (USD MILLION)
- TABLE 19 CLADDING SYSTEMS MARKET, BY REGION, 2021–2028 (MILLION SQ. MT.)
- TABLE 20 ASIA PACIFIC: CLADDING SYSTEMS MARKET, BY COUNTRY, 2021–2028 (USD MILLION)
- TABLE 21 ASIA PACIFIC: CLADDING SYSTEMS MARKET, BY COUNTRY, 2021–2028 (MILLION SQ. MT.)
- TABLE 22 ASIA PACIFIC: CLADDING SYSTEMS MARKET, BY MATERIAL, 2021–2028 (USD MILLION)
- TABLE 23 ASIA PACIFIC: CLADDING SYSTEMS MARKET, BY MATERIAL, 2021–2028 (MILLION SQ. MT.)
- TABLE 24 ASIA PACIFIC: CLADDING SYSTEMS MARKET, BY TYPE, 2021–2028 (USD MILLION)
- TABLE 25 ASIA PACIFIC: CLADDING SYSTEMS MARKET, BY TYPE, 2021–2028 (MILLION SQ. MT.)
- TABLE 26 ASIA PACIFIC: CLADDING SYSTEMS MARKET, BY APPLICATION, 2021–2028 (USD MILLION)
- TABLE 27 ASIA PACIFIC: CLADDING SYSTEMS MARKET, BY APPLICATION, 2021–2028 (MILLION SQ. MT.)
- TABLE 28 CHINA: CLADDING SYSTEMS MARKET, BY MATERIAL, 2021–2028 (USD MILLION)
- TABLE 29 CHINA: CLADDING SYSTEMS MARKET, BY MATERIAL, 2021–2028 (MILLION SQ. MT.)
- TABLE 30 JAPAN: CLADDING SYSTEMS MARKET, BY MATERIAL, 2021–2028 (USD MILLION)
- TABLE 31 JAPAN: CLADDING SYSTEMS MARKET, BY MATERIAL, 2021–2028 (MILLION SQ. MT.)
- TABLE 32 INDIA: CLADDING SYSTEMS MARKET, BY MATERIAL, 2021–2028 (USD MILLION)
- TABLE 33 INDIA: CLADDING SYSTEMS MARKET, BY MATERIAL, 2021–2028 (MILLION SQ. MT.)
- TABLE 34 AUSTRALIA: CLADDING SYSTEMS MARKET, BY MATERIAL, 2021–2028 (USD MILLION)
- TABLE 35 AUSTRALIA: CLADDING SYSTEMS MARKET, BY MATERIAL, 2021–2028 (MILLION SQ. MT.)
- TABLE 36 SOUTH KOREA: CLADDING SYSTEMS MARKET, BY MATERIAL, 2021–2028 (USD MILLION)
- TABLE 37 SOUTH KOREA: CLADDING SYSTEMS MARKET, BY MATERIAL, 2021–2028 (MILLION SQ. MT.)
- TABLE 38 REST OF ASIA PACIFIC: CLADDING SYSTEMS MARKET, BY MATERIAL, 2021–2028 (USD MILLION)
- TABLE 39 REST OF ASIA PACIFIC: CLADDING SYSTEMS MARKET, BY MATERIAL, 2021–2028 (MILLION SQ. MT.)
- TABLE 40 EUROPE: CLADDING SYSTEMS MARKET, BY COUNTRY, 2021–2028 (USD MILLION)
- TABLE 41 EUROPE: CLADDING SYSTEMS MARKET, BY COUNTRY, 2021–2028 (MILLION SQ. MT.)
- TABLE 42 EUROPE: CLADDING SYSTEMS MARKET, BY MATERIAL, 2021–2028 (USD MILLION)
- TABLE 43 EUROPE: CLADDING SYSTEMS MARKET, BY MATERIAL, 2021–2028 (MILLION SQ. MT.)
- TABLE 44 EUROPE: CLADDING SYSTEMS MARKET, BY TYPE, 2021–2028 (USD MILLION)
- TABLE 45 EUROPE: CLADDING SYSTEMS MARKET, BY TYPE, 2021–2028 (MILLION SQ. MT.)
- TABLE 46 EUROPE: CLADDING SYSTEMS MARKET, BY APPLICATION, 2021–2028 (USD MILLION)
- TABLE 47 EUROPE: CLADDING SYSTEMS MARKET, BY APPLICATION, 2021–2028 (MILLION SQ. MT.)
- TABLE 48 GERMANY: CLADDING SYSTEMS MARKET, BY MATERIAL, 2021–2028 (USD MILLION)
- TABLE 49 GERMANY: CLADDING SYSTEMS MARKET, BY MATERIAL, 2021–2028 (MILLION SQ. MT.)
- TABLE 50 FRANCE: CLADDING SYSTEMS MARKET, BY MATERIAL, 2021–2028 (USD MILLION)
- TABLE 51 FRANCE: CLADDING SYSTEMS MARKET, BY MATERIAL, 2021–2028 (MILLION SQ. MT.)
- TABLE 52 UK: CLADDING SYSTEMS MARKET, BY MATERIAL, 2021–2028 (USD MILLION)
- TABLE 53 UK: CLADDING SYSTEMS MARKET, BY MATERIAL, 2021–2028 (MILLION SQ. MT.)
- TABLE 54 ITALY: CLADDING SYSTEMS MARKET, BY MATERIAL, 2021–2028 (USD MILLION)
- TABLE 55 ITALY: CLADDING SYSTEMS MARKET, BY MATERIAL, 2021–2028 (MILLION SQ. MT.)
- TABLE 56 SPAIN: CLADDING SYSTEMS MARKET, BY MATERIAL, 2021–2028 (USD MILLION)
- TABLE 57 SPAIN: CLADDING SYSTEMS MARKET, BY MATERIAL, 2021–2028 (MILLION SQ. MT.)
- TABLE 58 REST OF EUROPE: CLADDING SYSTEMS MARKET, BY MATERIAL, 2021–2028 (USD MILLION)
- TABLE 59 REST OF EUROPE: CLADDING SYSTEMS MARKET, BY MATERIAL, 2021–2028 (MILLION SQ. MT.)
- TABLE 60 NORTH AMERICA: CLADDING SYSTEMS MARKET, BY COUNTRY, 2021–2028 (USD MILLION)
- TABLE 61 NORTH AMERICA: CLADDING SYSTEMS MARKET, BY COUNTRY, 2021–2028 (MILLION SQ. MT.)
- TABLE 62 NORTH AMERICA: CLADDING SYSTEMS MARKET, BY MATERIAL, 2021–2028 (USD MILLION)
- TABLE 63 NORTH AMERICA: CLADDING SYSTEMS MARKET, BY MATERIAL, 2021–2028 (MILLION SQ. MT.)
- TABLE 64 NORTH AMERICA: CLADDING SYSTEMS MARKET, BY TYPE, 2021–2028 (USD MILLION)
- TABLE 65 NORTH AMERICA: CLADDING SYSTEMS MARKET, BY TYPE, 2021–2028 (MILLION SQ. MT.)
- TABLE 66 NORTH AMERICA: CLADDING SYSTEMS MARKET, BY APPLICATION, 2021–2028 (USD MILLION)
- TABLE 67 NORTH AMERICA: CLADDING SYSTEMS MARKET, BY APPLICATION, 2021–2028 (MILLION SQ. MT.)
- TABLE 68 US: CLADDING SYSTEMS MARKET, BY MATERIAL, 2021–2028 (USD MILLION)
- TABLE 69 US: CLADDING SYSTEMS MARKET, BY MATERIAL, 2021–2028 (MILLION SQ. MT.)
- TABLE 70 CANADA: CLADDING SYSTEMS MARKET, BY MATERIAL, 2021–2028 (USD MILLION)
- TABLE 71 CANADA: CLADDING SYSTEMS MARKET, BY MATERIAL, 2021–2028 (MILLION SQ. MT.)
- TABLE 72 MEXICO: CLADDING SYSTEMS MARKET, BY MATERIAL, 2021–2028 (USD MILLION)
- TABLE 73 MEXICO: CLADDING SYSTEMS MARKET, BY MATERIAL, 2021–2028 (MILLION SQ. MT.)
- TABLE 74 MIDDLE EAST & AFRICA: CLADDING SYSTEMS MARKET, BY COUNTRY, 2021–2028 (USD MILLION)
- TABLE 75 MIDDLE EAST & AFRICA: CLADDING SYSTEMS MARKET, BY COUNTRY, 2021–2028 (MILLION SQ. MT.)
- TABLE 76 MIDDLE EAST & AFRICA: CLADDING SYSTEMS MARKET, BY MATERIAL, 2021–2028 (USD MILLION)
- TABLE 77 MIDDLE EAST & AFRICA: CLADDING SYSTEMS MARKET, BY MATERIAL, 2021–2028 (MILLION SQ. MT.)
- TABLE 78 MIDDLE EAST & AFRICA: CLADDING SYSTEMS MARKET, BY TYPE, 2021–2028 (USD MILLION)
- TABLE 79 MIDDLE EAST & AFRICA: CLADDING SYSTEMS MARKET, BY TYPE, 2021–2028 (MILLION SQ. MT.)
- TABLE 80 MIDDLE EAST & AFRICA: CLADDING SYSTEMS MARKET, BY APPLICATION, 2021–2028 (USD MILLION)
- TABLE 81 MIDDLE EAST & AFRICA: CLADDING SYSTEMS MARKET, BY APPLICATION, 2021–2028 (MILLION SQ. MT.)
- TABLE 82 TURKEY: CLADDING SYSTEMS MARKET, BY MATERIAL, 2021–2028 (USD MILLION)
- TABLE 83 TURKEY: CLADDING SYSTEMS MARKET, BY MATERIAL, 2021–2028 (MILLION SQ. MT.)
- TABLE 84 SAUDI ARABIA: CLADDING SYSTEMS MARKET, BY MATERIAL, 2021–2028 (USD MILLION)
- TABLE 85 SAUDI ARABIA: CLADDING SYSTEMS MARKET, BY MATERIAL, 2021–2028 (MILLION SQ. MT.)
- TABLE 86 UAE: CLADDING SYSTEMS MARKET, BY MATERIAL, 2021–2028 (USD MILLION)
- TABLE 87 UAE: CLADDING SYSTEMS MARKET, BY MATERIAL, 2021–2028 (MILLION SQ. MT.)
- TABLE 88 SOUTH AFRICA: CLADDING SYSTEMS MARKET, BY MATERIAL, 2021–2028 (USD MILLION)
- TABLE 89 SOUTH AFRICA: CLADDING SYSTEMS MARKET, BY MATERIAL, 2021–2028 (MILLION SQ. MT.)
- TABLE 90 REST OF MIDDLE EAST & AFRICA: CLADDING SYSTEMS MARKET, BY MATERIAL, 2021–2028 (USD MILLION)
- TABLE 91 REST OF MIDDLE EAST & AFRICA: CLADDING SYSTEMS MARKET, BY MATERIAL, 2021–2028 (MILLION SQ. MT.)
- TABLE 92 SOUTH AMERICA: CLADDING SYSTEMS MARKET, BY COUNTRY, 2021–2028 (USD MILLION)
- TABLE 93 SOUTH AMERICA: CLADDING SYSTEMS MARKET, BY COUNTRY, 2021–2028 (MILLION SQ. MT.)
- TABLE 94 SOUTH AMERICA: CLADDING SYSTEMS MARKET, BY MATERIAL, 2021–2028 (USD MILLION)
- TABLE 95 SOUTH AMERICA: CLADDING SYSTEMS MARKET, BY MATERIAL, 2021–2028 (MILLION SQ. MT.)
- TABLE 96 SOUTH AMERICA: CLADDING SYSTEMS MARKET, BY TYPE, 2021–2028 (USD MILLION)
- TABLE 97 SOUTH AMERICA: CLADDING SYSTEMS MARKET, BY TYPE, 2021–2028 (MILLION SQ. MT.)
- TABLE 98 SOUTH AMERICA: CLADDING SYSTEMS MARKET, BY APPLICATION, 2021–2028 (USD MILLION)
- TABLE 99 SOUTH AMERICA: CLADDING SYSTEMS MARKET, BY APPLICATION, 2021–2028 (MILLION SQ. MT.)
- TABLE 100 BRAZIL: CLADDING SYSTEMS MARKET, BY MATERIAL, 2021–2028 (USD MILLION)
- TABLE 101 BRAZIL: CLADDING SYSTEMS MARKET, BY MATERIAL, 2021–2028 (MILLION SQ. MT.)
- TABLE 102 ARGENTINA: CLADDING SYSTEMS MARKET, BY MATERIAL, 2021–2028 (USD MILLION)
- TABLE 103 ARGENTINA: CLADDING SYSTEMS MARKET, BY MATERIAL, 2021–2028 (MILLION SQ. MT.)
- TABLE 104 REST OF SOUTH AMERICA: CLADDING SYSTEMS MARKET, BY MATERIAL, 2021–2028 (USD MILLION)
- TABLE 105 REST OF SOUTH AMERICA: CLADDING SYSTEMS MARKET, BY MATERIAL, 2021–2028 (MILLION SQ. MT.)
- TABLE 106 CLADDING SYSTEMS MARKET: INTENSITY OF COMPETITIVE RIVALRY
- TABLE 107 CLADDING SYSTEMS MARKET: DEALS (2019 TO 2023)
- TABLE 108 COMPAGNIE DE SAINT-GOBAIN S.A.: COMPANY OVERVIEW
- TABLE 109 COMPAGNIE DE SAINT-GOBAIN S.A.: PRODUCTS OFFERED
- TABLE 110 COMPAGNIE DE SAINT-GOBAIN S.A.: DEALS
- TABLE 111 DOW INC.: COMPANY OVERVIEW
- TABLE 112 DOW INC.: PRODUCTS OFFERED
- TABLE 113 TATA STEEL LIMITED: COMPANY OVERVIEW
- TABLE 114 PRODUCTS/SOLUTIONS/SERVICES OFFERED TATA STEEL LIMITED: PRODUCTS OFFERED
- TABLE 115 ARCONIC CORPORATION: COMPANY OVERVIEW
- TABLE 116 ARCONIC CORPORATION: PRODUCTS OFFERED
- TABLE 117 WESTLAKE CORPORATION: COMPANY OVERVIEW
- TABLE 118 WESTLAKE CORPORATION: PRODUCTS OFFERED
- TABLE 119 WESTLAKE CORPORATION: DEALS
- TABLE 120 ETEX GROUP: COMPANY OVERVIEW
- TABLE 121 ETEX GROUP: PRODUCTS OFFERED
- TABLE 122 ETEX GROUP: DEALS
- TABLE 123 JAMES HARDIE INDUSTRIES PLC: COMPANY OVERVIEW
- TABLE 124 JAMES HARDIE INDUSTRIES PLC: PRODUCTS OFFERED
- TABLE 125 JAMES HARDIE INDUSTRIES PLC: OTHERS
- TABLE 126 CSR LIMITED: COMPANY OVERVIEW
- TABLE 127 CSR LIMITED: PRODUCTS OFFERED
- TABLE 128 NICHIHA CORPORATION: COMPANY OVERVIEW
- TABLE 129 NICHIHA CORPORATION: PRODUCTS OFFERED
- TABLE 130 BORAL LIMITED: BUSINESS OVERVIEW
- TABLE 131 BORAL LIMITED: PRODUCTS OFFERED
- TABLE 132 SWISSPEARL GROUP AG: COMPANY OVERVIEW
- TABLE 133 LOUISIANA PACIFIC CORPORATION: COMPANY OVERVIEW
- TABLE 134 KINGSPAN GROUP PLC: COMPANY OVERVIEW
- TABLE 135 COVERWORLD UK: COMPANY OVERVIEW
- TABLE 136 WESTMAN STEEL: COMPANY OVERVIEW
- TABLE 137 CA GROUP LIMITED: COMPANY OVERVIEW
- TABLE 138 ARCELORMITTAL: COMPANY OVERVIEW
- TABLE 139 CAREA: COMPANY OVERVIEW
- TABLE 140 TIMCO: COMPANY OVERVIEW
- TABLE 141 MIDDLE EAST INSULATION LLC: COMPANY OVERVIEW
- TABLE 142 TRESPA INTERNATIONAL B.V.: COMPANY OVERVIEW
- TABLE 143 DUMAPLAST: COMPANY OVERVIEW
- TABLE 144 ACCORD FLOORS: COMPANY OVERVIEW
- FIGURE 1 CLADDING SYSTEMS: MARKET SEGMENTATION
- FIGURE 2 CLADDING SYSTEMS MARKET: RESEARCH DESIGN
- FIGURE 3 MARKET SIZE ESTIMATION METHODOLOGY: BOTTOM-UP APPROACH
- FIGURE 4 MARKET SIZE ESTIMATION METHODOLOGY: TOP-DOWN APPROACH
- FIGURE 5 CLADDING SYSTEMS MARKET: DATA TRIANGULATION
- FIGURE 6 STUCCO & EIFS MATERIAL SEGMENT TO LEAD CLADDING SYSTEMS MARKET DURING FORECAST PERIOD
- FIGURE 7 WALLS SEGMENT TO LEAD CLADDING SYSTEMS MARKET
- FIGURE 8 NON-RESIDENTIAL SEGMENT TO LEAD CLADDING SYSTEMS MARKET
- FIGURE 9 ASIA PACIFIC REGION ACCOUNTED FOR LARGEST SHARE OF CLADDING SYSTEMS MARKET
- FIGURE 10 RISE IN RESIDENTIAL CONSTRUCTION TO DRIVE CLADDING SYSTEMS MARKET
- FIGURE 11 CHINA ACCOUNTED FOR LARGEST SHARE OF CLADDING SYSTEMS MARKET IN ASIA PACIFIC
- FIGURE 12 CERAMIC SEGMENT TO LEAD CLADDING SYSTEMS MARKET DURING FORECAST PERIOD
- FIGURE 13 WALLS SEGMENT TO LEAD CLADDING SYSTEMS MARKET
- FIGURE 14 RESIDENTIAL SEGMENT TO BE FASTER-GROWING APPLICATION
- FIGURE 15 CLADDING SYSTEMS MARKET IN CHINA TO GROW AT HIGHEST CAGR
- FIGURE 16 MASONRY AND CONCRETE CLADDING MATERIALS ADOPTED FOR HIGH-RISE BUILDINGS IN EARLY 1900S
- FIGURE 17 DRIVERS, RESTRAINTS, OPPORTUNITIES, AND CHALLENGES IN CLADDING SYSTEMS MARKET
- FIGURE 18 INCREASE IN GLOBAL POPULATION BY THREE BILLION DURING LAST THREE DECADES
- FIGURE 19 CLADDING SYSTEMS MARKET, BY MATERIAL (USD MILLION)
- FIGURE 20 CLADDING SYSTEMS MARKET, BY TYPE, (USD MILLION)
- FIGURE 21 CLADDING SYSTEMS MARKET, BY APPLICATION, (USD MILLION)
- FIGURE 22 REGIONAL SNAPSHOT: CLADDING SYSTEMS MARKET GROWTH RATE, BY COUNTRY, 2023–2028
- FIGURE 23 ASIA PACIFIC: CLADDING SYSTEMS MARKET SNAPSHOT
- FIGURE 24 OVERVIEW OF STRATEGIES ADOPTED BY CLADDING SYSTEM MANUFACTURERS
- FIGURE 25 RANKING OF TOP FIVE PLAYERS IN CLADDING SYSTEMS MARKET, 2022
- FIGURE 26 CLADDING SYSTEMS MARKET SHARE, BY COMPANY (2022)
- FIGURE 27 CLADDING SYSTEMS MARKET: COMPANY EVALUATION MATRIX, 2022
- FIGURE 28 STARTUP/SMES EVALUATION FOR CLADDING SYSTEMS MARKET
- FIGURE 29 COMPAGNIE DE SAINT-GOBAIN S.A.: COMPANY SNAPSHOT
- FIGURE 30 DOW INC.: COMPANY SNAPSHOT
- FIGURE 31 TATA STEEL LIMITED: COMPANY SNAPSHOT
- FIGURE 32 ARCONIC CORPORATION: COMPANY SNAPSHOT
- FIGURE 33 WESTLAKE CORPORATION: COMPANY SNAPSHOT
- FIGURE 34 ETEX GROUP: COMPANY SNAPSHOT
- FIGURE 35 JAMES HARDIE INDUSTRIES PLC: COMPANY SNAPSHOT
Extensive secondary sources, directories, and databases such as Hoovers, Bloomberg BusinessWeek, Factiva, and OneSource have been used to identify and collect information for this technical, market-oriented, and commercial study of the cladding systems market. In-depth interviews were conducted with various primary respondents which included key industry participants, subject matter experts (SMEs), C-level executives of key industry players, and industry consultants, among other experts, to obtain and verify critical qualitative and quantitative information and to assess prospects.
Secondary Research
In the secondary research process, various secondary sources have been referred to for identifying and collecting information for this study. Secondary sources included annual reports, press releases, and investor presentations of companies; white papers; publications from recognized websites; and databases. Secondary research has mainly been used to obtain key information about the supply chain of the industry, the total pool of key players, market classification & segmentation according to the industry trends to the bottom-most level, regional markets, and key developments from both, market- and technology-oriented perspectives.
The market size of cladding systems has been estimated based on secondary data available through paid and unpaid sources, and by analyzing the product portfolios of key companies. This data has been further validated through various primary sources.
Primary Research
The cladding systems market comprises various stakeholders in the supply chain and includes suppliers, manufacturers, and end-product manufacturers. Various primary sources from the supply and demand sides of the cladding systems market have been interviewed to obtain qualitative and quantitative information. Primary participants from the supply side include key opinion leaders, executives, vice presidents, and CEOs of companies in the market. Primary sources from the demand side include experts from end-use industries, associations, and institutions involved in the market, and key opinion leaders.
Following is the breakdown of primary respondents—
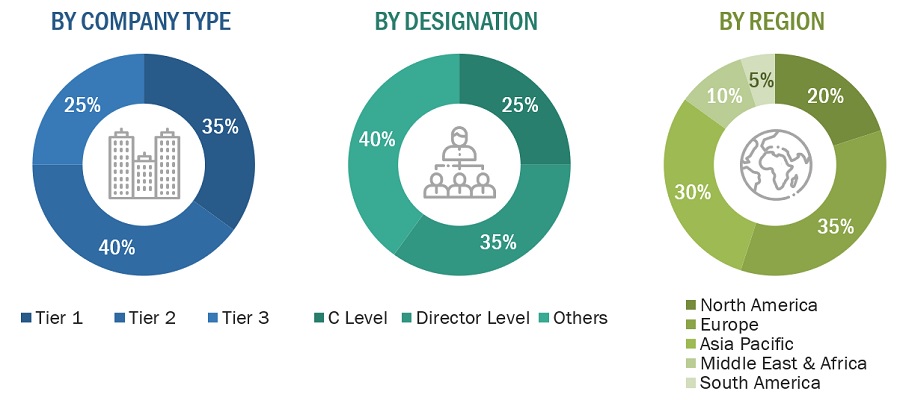
Notes: *Others include sales, marketing, and product managers.
Tier 1: >USD 5 Billion; Tier 2: USD 1 Billion– USD 5 Billion; and Tier 3: <USD 1 Billion.
To know about the assumptions considered for the study, download the pdf brochure
Market Size Estimation
The supply-side and demand-side approaches have been extensively used, along with several data triangulation methods, for market size estimation and forecast of the overall market segments listed in this report. Extensive qualitative and quantitative data were analyzed to list key information/insights throughout the report. The research methodology used to estimate the market size includes the following:
- The key players in the industry were identified through extensive secondary research.
- The supply chain of the industry and market size, in terms of value and volume, were determined through primary and secondary research.
- All percentage shares split, and breakdowns were determined using secondary sources and verified through primary sources.
- All possible parameters that affect the markets covered in this research study were accounted for, viewed in extensive detail, verified through primary research, and analyzed to obtain the final quantitative and qualitative data.
- The research includes the study of annual reports, reviews, cladding systems associations, and newsletters of key industry players along with extensive interviews with key officials, such as directors and marketing executives.
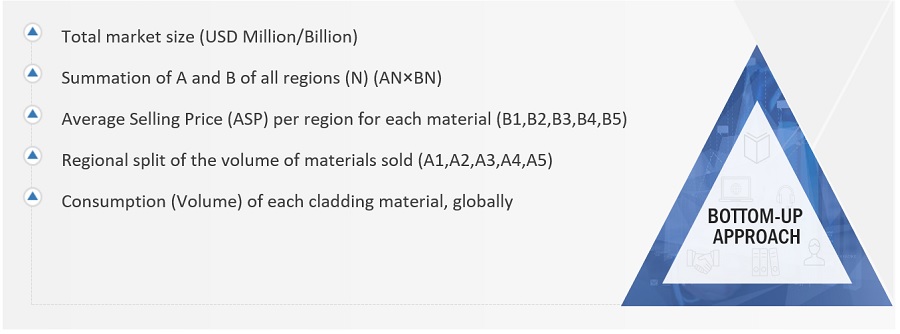
Bottom-up approach
To know about the assumptions considered for the study, Request for Free Sample Report
The bottom-up procedure was employed to arrive at the overall market size of the cladding systems market from the revenues of key players and their respective market shares in the global market. The bottom-up approach has also been used for the data extracted from secondary research to validate the market sizes of segments and subsegments, in terms of value.
Top-down approach

In the top-down approach, the overall market size has been used to estimate the size of other individual markets (based on security feature, application, and region) through percentage splits obtained from secondary and primary research.
For the calculation of the size of a specific market segment, the size of the most appropriate immediate parent market was used to implement the top-down approach. The bottom-up procedure was also implemented for the data extracted from secondary research to validate the market segment revenues obtained. With the data triangulation procedure and validation of data through primaries, the exact values of the overall parent market size have been determined and confirmed in this study. The data triangulation procedure implemented for this study has been explained in the next section.
Data Triangulation
After arriving at the overall market size, the total market was split into several segments and subsegments. To complete the overall market estimation process and arrive at the exact statistics for all the segments and subsegments, data triangulation and market breakdown procedures were employed, wherever applicable. Data was triangulated by studying various factors and trends from both the demand and supply sides.
Market Definition
Cladding refers to a layer/covering attached to the external wall of a building that protects the underlying structure against extreme weather and enhances the appearance/aesthetic value of the building. Cladding systems also referred to as building envelopes, typically made from wood, metal, plastic, and masonry, provide a wide range of benefits—which include thermal and sound insulation, fire resistance, and pollution prevention—apart from weather protection.
Key stakeholders
- Raw material suppliers and producers
- Cladding systems manufacturers
- Cladding systems distributors/suppliers
- Regulatory bodies
- Local governments
Report Objectives
- To define, segment, and project the global cladding systems market based on material, type, application, and region.
- To project the size of the market and its segments, in terms of value and volume, with respect to five main regions (along with their respective key countries), namely, North America, Europe, Asia Pacific, the Middle East and Africa, and South America
- To provide detailed information about the key factors such as drivers, restraints, opportunities, and challenges influencing the growth of the market
- To strategically analyze micromarkets with respect to individual growth trends, prospects, and their contribution to the total cladding systems market
- To analyze the opportunities in the market for stakeholders and provide a detailed competitive landscape of the market leaders.
- To strategically profile the key players and comprehensively analyze their market ranking and core competencies.
- To track and analyze competitive developments such as expansions & investments, mergers & acquisitions, new technology & product launches, and agreements & contracts in the cladding systems market.
Available Customizations:
Along with the given market data, MarketsandMarkets offers customizations as per the specific needs of the companies. The following customization options are available for the report:
Product Analysis:
- Product Matrix which gives a detailed comparison of the product portfolio of each company
Regional Analysis:
- Further breakdown of the Rest of APAC Cladding Systems Market
- Further breakdown of Rest of Europe Cladding Systems Market
- Further breakdown of Rest of South America Cladding Systems Market
- Further breakdown of Rest of Middle East & Africa Cladding Systems Market
Company Information:
- Detailed analysis and profiling of additional market players (up to 5)


 Generating Response ...


Growth opportunities and latent adjacency in Cladding Systems Market