
Fintech as a Service Market

Fintech as a Service Market by Type (Banking, Payments, Insurance, Lending, RegTech, Wealth Management, Digital Assets & Currencies, Cybersecurity), End User (Consumer, Banks, NBFCs, Insurance Companies, Government) - Global Forecast to 2030


OVERVIEW
Source: Secondary Research, Interviews with Experts, MarketsandMarkets Analysis
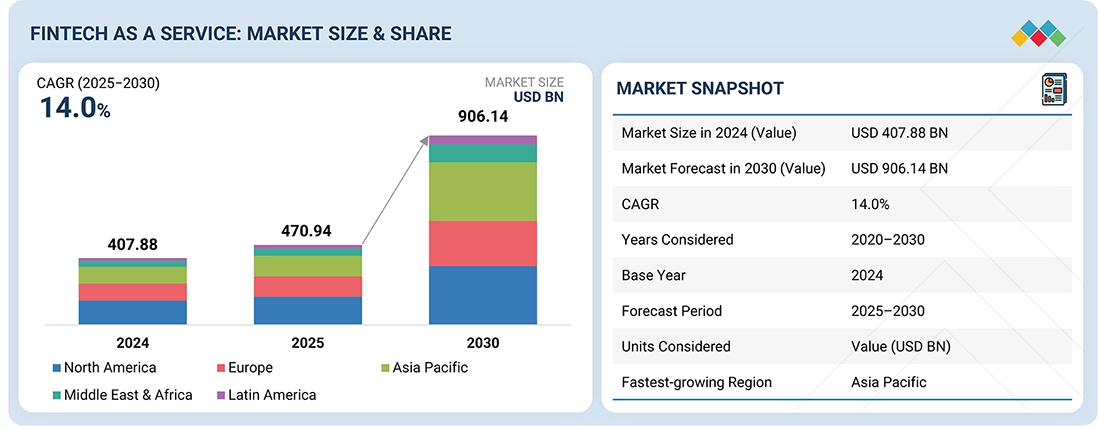
The Fintech as a Service market is projected to expand from USD 470.94 billion in 2025 to USD 906.14 billion by 2030, at a CAGR of 14.0% during the forecast period. To improve customer experience and develop new revenue streams, companies across various industries are increasingly incorporating banking, lending, and payment features into their platforms, which is fueling the growth of the global Fintech as a Service market.
Market Size and Forecast:
- Market Size in 2024: USD 407.88 Billion
- 2025 Market Size: USD 470.94 Billion
- 2030 Forecasted Market Size: USD 906.14 Billion
- Growth Rate (2025-2030): CAGR of 14.0%
- Forecast period: 2025–2030
- The market in Asia Pacific is expected to grow fastest, with a CAGR of 17.0%
Key Market Trends and Insights
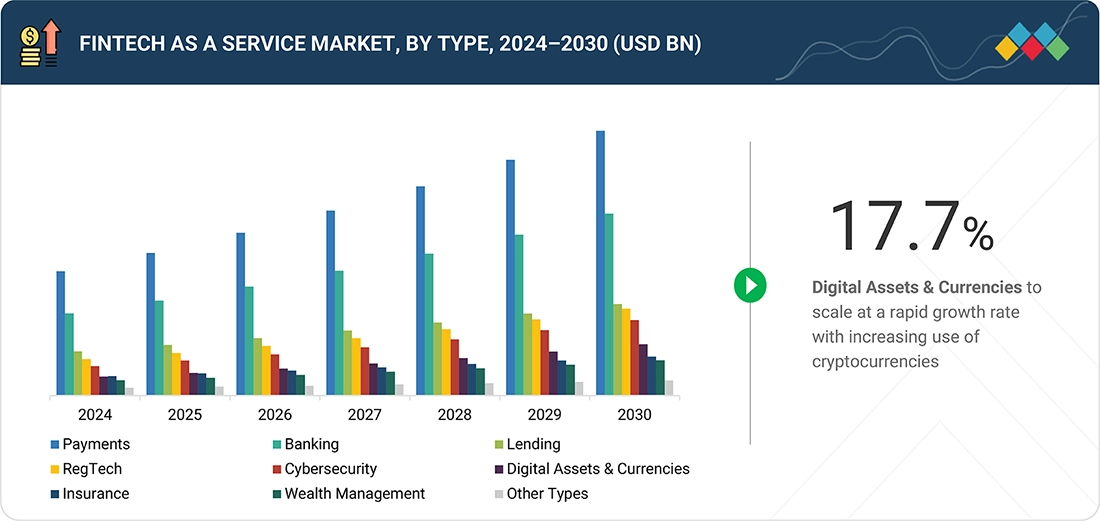
- Segment Acceleration: Digital assets & currencies segment to grow at the 17.7% CAGR during the forecast period.
-
Growth Opportunities: APIs, AI/ML, blockchain, open banking, RegTech, digital identity, and cloud-based financial services.
- Growth Drivers: Cloud scalability, rising real-time payments demand, and increasing compliance & regulatory solution needs.
- Market Share Analysis: Payments leads by type; banks to account for the largest market share in 2025.
KEY TAKEAWAYS
-
BY TYPEThe Fintech as a Service market is broadly categorized into banking, payments, insurance, wealth management, lending, RegTech, digital assets & currencies, cybersecurity, and other types. Payments leads the market with rapid adoption of digital wallets, real-time processing, and embedded solutions, while banking and lending platforms are reshaping financial access through digital-first infrastructure and data-driven credit models.
-
BY DEPLOYMENT MODELThe Fintech as a Service market is divided into three subsegments: public cloud, private cloud, and hybrid, each offering unique benefits to financial institutions and fintech providers. Public cloud is the most popular choice due to its scalability, cost-effectiveness, and support for rapid innovation, making it ideal for digital-first companies and startups.
-
BY END USERFintech as a Service has gained significant traction across various end users, including consumers, banks, non-banking financial companies (NBFCs), insurance companies, government agencies, and other end users such as retail and eCommerce platforms, as well as mortgage and rental platforms. NBFCs leverage FaaS to expand credit access, digitize lending workflows, and reach underserved populations with agile and cost-effective models. Insurance companies incorporate FaaS to streamline underwriting, claims processing, and distribute embedded and micro-insurance products.
-
BY REGIONThe market in Asia Pacific is expected to grow fastest, with a CAGR of 17.0%, fueled by some of the world's fastest-growing economies, including China, India, and Japan. These countries are known for their young, tech-savvy populations that are driving a demand for digital transformation and seamless payment experiences.
-
COMPETITIVE LANDSCAPEMarket players have adopted both, organic and inorganic strategies, including partnerships, collaborations, and investments. For instance, in July 2025, PayPal partnered with Wix Advance, to provide a consolidated view for merchants to streamline payment management, enhance conversions, and meet growing demand for flexible payment options
The Fintech as a Service market is experiencing steady growth. Financial services can be integrated seamlessly thanks to the widespread use of open banking frameworks and APIs, while cloud-native architectures provide cost-effectiveness and scalability, reducing time-to-market compared to traditional systems. The need for secure, real-time financial solutions is further driven by the rise of digital commerce and cross-border transactions, as well as the increasing regulatory requirements that compel businesses to adopt Regulatory Technology (RegTech).
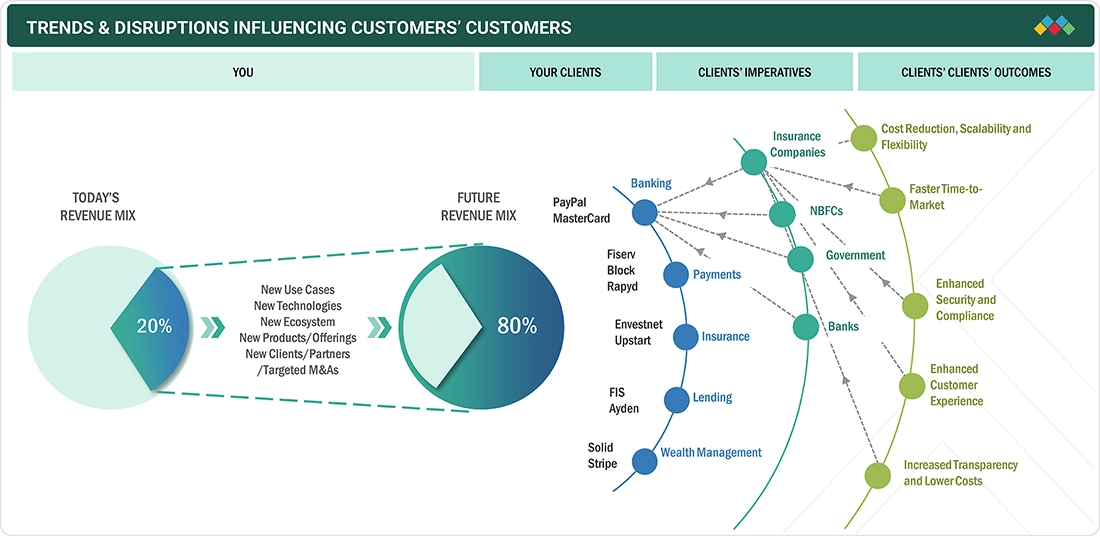
TRENDS & DISRUPTIONS IMPACTING CUSTOMERS' CUSTOMERS
The Fintech as a Service (FaaS) market is undergoing rapid change, driven by several disruptive trends that are reshaping customer businesses. One of the most important shifts is the rise of embedded finance, where non-financial platforms incorporate financial services such as payments, lending, or insurance directly into their offerings, broadening access and improving user experiences. At the same time, Banking-as-a-Service (BaaS) platforms are enabling fintechs and non-banking organizations to quickly launch licensed financial products through API-driven models. The growing demand for real-time payments and instant settlements is encouraging businesses to adopt faster and more efficient transaction infrastructures. Additionally, technologies like AI and ML are being integrated into FaaS platforms for personalized customer experiences, fraud detection, and automated credit underwriting. With increasing regulatory challenges, RegTech solutions are becoming vital for automating compliance and reducing risk exposure. As digital finance expands, cybersecurity has become a top concern, leading to the use of advanced security measures such as tokenization and multi-factor authentication. Meanwhile, the adoption of blockchain and decentralized finance (DeFi) is opening up new business models around crypto payments, identity verification, and smart contracts. The growth of open banking and API-first architectures is also enabling customers to easily access and control their financial data, fostering more interconnected ecosystems. These trends together are transforming how financial services are created, delivered, and used in the digital economy.
Source: Secondary Research, Interviews with Experts, MarketsandMarkets Analysis
MARKET DYNAMICS
Level
-
Operational flexibility and scalability with advent of cloud computing technology

-
Increasing demand for real-time payments and transactions

Level
-
Complexity involved in integration with legacy systems

-
Issues related to data security and privacy

Level
-
Increased demand for Regulatory Technology (RegTech)

-
Expansion of cross-border payments and remittances

Level
-
Dependency on third-party APIs and infrastructure

-
Growing competition in fast-moving digital financial landscape

Source: Secondary Research, Interviews with Experts, MarketsandMarkets Analysis
Driver: Increasing demand for real-time payments and transactions
The rising demand for real-time payments and transactions is a major factor driving the growth of the Fintech as a Service (FaaS) market. In a more digital-centric world, consumers and businesses expect instant money transfers available 24/7. This change has created a strong need for infrastructure capable of supporting real-time settlements across various scenarios such as peer-to-peer (P2P) transfers, gig economy payouts, e-commerce transactions, and on-demand loan disbursements. FaaS providers meet this need by offering API-based solutions that allow for instant initiation, authorization, and settlement of payments across both global and domestic payment networks. The adoption of real-time payment systems like UPI (India), RTP (US), and SEPA Instant (Europe) is speeding up the integration of these features. Additionally, businesses gain benefits like improved cash flow, fewer operational delays, and better user experiences, often monetizing real-time features as premium services. As the financial landscape evolves, supported by advancements such as ISO 20022 and embedded finance, the importance of real-time payments through FaaS platforms will grow even more central to digital financial transformation.
Restraint: Complexity involved in integration with legacy systems
The complexity of integrating FaaS solutions with legacy systems is a major hurdle in the market. Many banks and financial institutions rely on outdated systems that were not built to work with newer technologies, creating a barrier to smoothly adopting FaaS solutions. This integration can be both time-consuming and costly, requiring substantial investments in infrastructure, staff, and training. Additionally, legacy systems are often very complex, with many layers of code, making it hard to identify and fix integration problems. Each institution may have its own unique requirements and systems, which complicates FaaS providers’ efforts to develop solutions that can easily work across multiple platforms. Legacy systems can also pose security threats, as they might lack the latest security protocols and be vulnerable to cyber-attacks, posing significant risks to institutions and their customers. Despite these difficulties, FaaS providers are increasingly creating solutions that work with legacy systems and aim to offer integrations that do not require major changes to existing infrastructure or processes. Fintech companies are also investing in technologies like APIs, microservices, and cloud computing to make integration easier and boost compatibility across different systems. As the financial industry continues to evolve, being able to smoothly connect new technologies with legacy systems will be crucial for banks and NBFCs to stay competitive.
Opportunity: Rise of digital assets & currencies
The rise of digital assets and currencies significantly drives the Fintech-as-a-Service market, as the quick adoption of stablecoins, central bank digital currencies (CBDCs), and tokenized real-world assets boosts demand for scalable, compliant, and developer-friendly financial infrastructure. Businesses and institutions increasingly need custody solutions, fiat-to-digital currency payment systems, token issuance platforms, and regulatory compliance tools accessible via APIs, making FaaS providers vital for connecting traditional finance with digital asset ecosystems. The growth of stablecoins for settlement, CBDC pilot projects, and asset tokenization are speeding up use cases in cross-border payments, treasury management, and post-trade settlement. Meanwhile, clearer regulations in key markets are encouraging financial institutions and enterprises to adopt RegTech and compliance-as-a-service solutions designed for digital assets. By providing custody-as-a-service, tokenization tools, programmable payments, and embedded finance features, FaaS vendors are well placed to generate recurring revenue and increase platform loyalty, making digital asset integration one of the most powerful growth drivers in the sector.
Challenge: Growing competition in fast-moving digital financial landscape
The increasing competition in the fast-changing digital financial landscape presents a major challenge for the Fintech as a Service market, as more technology providers, financial institutions, and new fintech startups compete to offer agile, scalable, and innovative financial solutions. Traditional banks and payment providers are updating their technology infrastructure and launching white-label digital services, while major tech firms are integrating financial services into their platforms, increasing pressure on specialized FaaS vendors. The rapid pace of technological advancement, driven by developments in APIs, blockchain, AI, and cloud-native architectures, requires providers to continually innovate to stay relevant, all while maintaining reliability, scalability, and security. Furthermore, the commodification of core services such as payments processing, digital wallets, and KYC/AML compliance has created margin pressures, making differentiation through value-added features like embedded finance, data-driven insights, or cross-border remittance capabilities essential for survival. FaaS players also operate in a fragmented competitive environment where startups can scale quickly thanks to cloud-native models, and established incumbents benefit from strong customer trust and regulatory expertise.
Fintech as a Service Market: COMMERCIAL USE CASES ACROSS INDUSTRIES
| COMPANY | USE CASE DESCRIPTION | BENEFITS |
|---|---|---|
 |
PayMyTuition is a fintech company specializing in providing global payment solutions to educational institutions and their students. Sending and receiving tuition payments across borders became a major challenge for both students and universities. Traditional methods, such as wire transfers and credit cards, can be slow and expensive, limiting accessibility for students worldwide. PayMyTuition wanted a solution that can offer different local payment options, quick and cost-efficient money transfers, quick responsiveness to changing customer expectations and expansion of business across Latin America and Asia Pacific. | PayMyTuition has successfully expanded its reach and gained access to millions of new customers by utilizing Rapyd Collect. Rapyd’s platform has enabled PayMyTuition to add more than 38 local payment methods, making it more convenient and accessible for millions of consumers worldwide. PayMyTuition has been able to streamline its payment collection process and reduce the complexity of cross-border transactions. This has resulted in faster and more efficient payment processing, reducing the time and resources required for administrative tasks. |
 |
Zalando needed a payments partner that could help the business scale in both new and existing markets while optimizing acceptance rates, reducing fraud, and delivering a fast and frictionless checkout process. | FIS Exemption Engine is a PSD2 solution that minimizes friction at checkout, reduces costs, and protects revenue. Integrating the Exemption Engine solution delivered a premium customer payment experience while optimizing acceptance, reducing fraud, ensuring compliance with PSD2 and scaling with growth. This helped Zalando minimize exemptions to deliver a fast, secure, seamless payment experience while reducing fraud and risk by analyzing transaction data. |
 |
Tradera’s seller base is mostly Swedish; buyers are mostly from across Scandinavia and the European Economic Area. Marketplaces that act as intermediaries for buyers and sellers need to comply with PSD2 requirements and the enforcement of the 4th European Union Directive for Anti-Money Laundering. | Tradera implemented a customized platform of two unique PayPal products: Hyperwallet and Braintree. Hyperwallet’s “Know Your Payee” Program is an identification and verification system. It is specifically aligned with these regulatory requirements that involve the collection and verification of individual or business information which removed friction by offering a flexible, seamless and secure payment experience. |
 |
Scaling up online operations and adopting multiple payment gateways led to difficulties in managing and tracking performance. However, fluctuating transaction success rates and a lack of insights into payment errors and customer drop-offs created hurdles in providing a seamless payment experience. | The implementation of Razorpay’s Optimizer brought about a positive transformation in FabIndia’s payment processing landscape. Real-time insights empowered proactive monitoring of transaction success rates, resulting in a substantial increase, contributing to happier customers, and boosting revenue. Access to Optimizer’s detailed Payment Performance Report gave FabIndia a deeper understanding of their Payment Gateway rule sets. This empowered them to make necessary adjustments, optimizing transaction routing and ultimately improving payment success rates. |
Logos and trademarks shown above are the property of their respective owners. Their use here is for informational and illustrative purposes only.
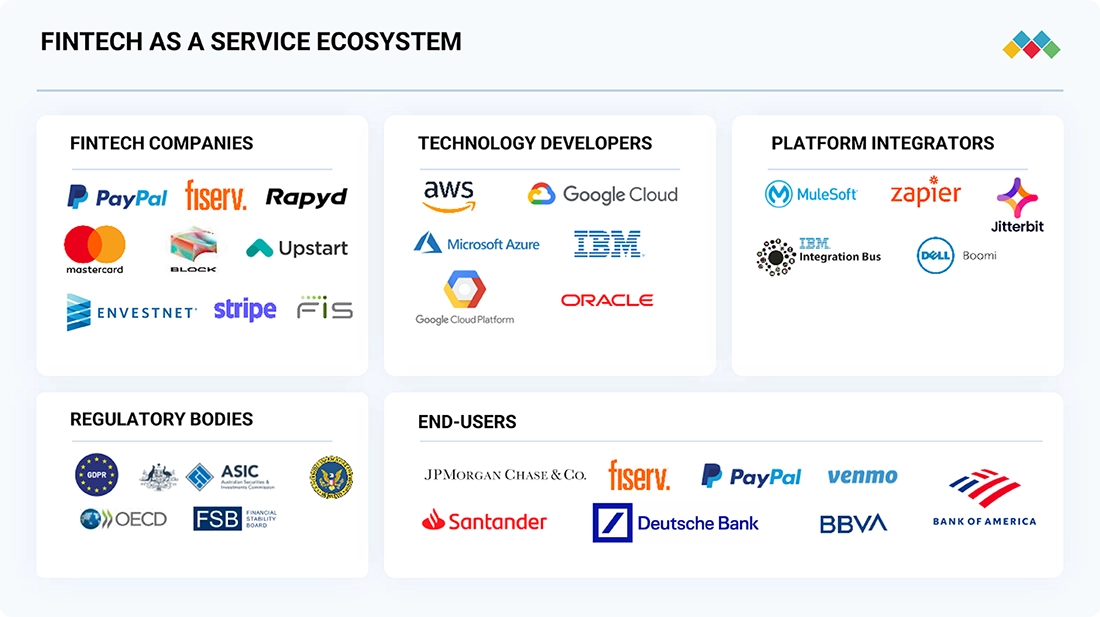
MARKET ECOSYSTEM
Prominent players in this market include well-established, financially stable Fintech-as-a-Service solutions and providers, along with regulatory agencies. These companies have been operating for several years and offer diverse product portfolios supported by cutting-edge technologies. The vendors are engaged in various partnerships and collaborations to develop comprehensive solutions that meet a wide range of requirements.
Logos and trademarks shown above are the property of their respective owners. Their use here is for informational and illustrative purposes only.
MARKET SEGMENTS
Source: Secondary Research, Interviews with Experts, MarketsandMarkets Analysis
Fintech as a Service Market, By Type
Payments is the largest and fastest-growing segment in FaaS, enabling businesses to access ready-to-deploy platforms for payment processing, mobile wallets, real-time transactions, and cross-border remittances. With APIs and cloud infrastructure, payment FaaS providers simplify integration for e-commerce players, retailers, and financial institutions, ensuring security, speed, and global scalability. The segment is driven by rising digital transactions, demand for frictionless checkout experiences, and embedded payments in apps, helping businesses diversify revenue streams while ensuring compliance with payment regulations such as PCI DSS. FaaS providers in the payment segment bridge the gap between traditional payment methods and technology by offering a wide range of services, including mobile payments, digital wallets, peer-to-peer transfers, and online payment gateways.
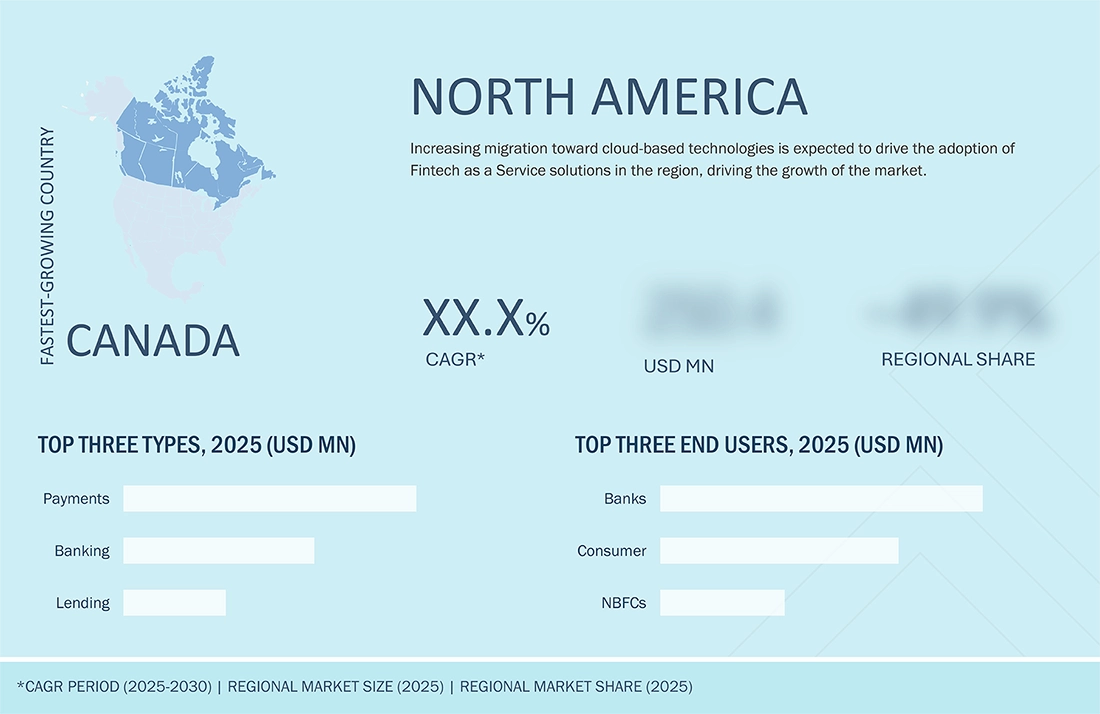
REGION
North America is estimated to account for the largest market share during the forecast period
The Fintech as a Service market in North America is undergoing a major transformation, reshaping the financial services industry. Thanks to its technological expertise and innovation ecosystem, North America has become a center for Fintech innovation. The region's advanced infrastructure, including cloud computing and data analytics capabilities, has laid a strong foundation for market growth. Regulatory agencies in the region have welcomed innovation, supporting the adoption of FaaS solutions. This friendly regulatory environment builds trust and allows financial institutions to explore the benefits of FaaS solutions. Additionally, North America's diverse and tech-savvy market demands smooth and customized financial experiences, increasing the demand for FaaS solutions. These solutions meet changing customer expectations through user-friendly mobile apps, personalized suggestions, and data-driven insights. Government initiatives show a commitment to encouraging innovation, providing regulatory clarity, and fostering competition within the Fintech sector. By establishing supportive policies and frameworks, North American governments are promoting the adoption of FaaS solutions, boosting economic growth, and expanding financial inclusion in the region. Furthermore, North America hosts major FaaS providers such as PayPal, Mastercard, Fiserv, Block, and FIS. The presence of these large vendors is accelerating the use of FaaS solutions and services across the region.
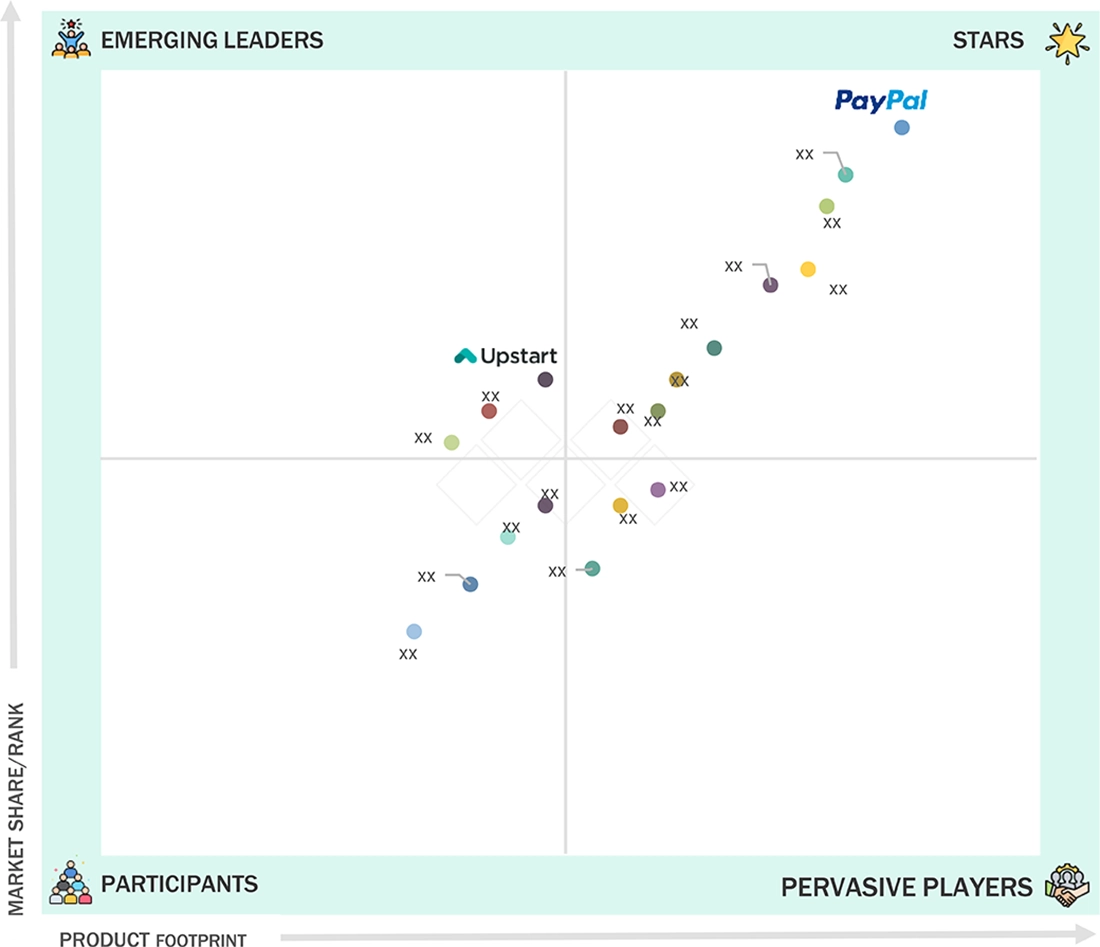
Fintech as a Service Market: COMPANY EVALUATION MATRIX
In the Fintech as a Service market matrix, AT&T (Star) secures its position with a large market share in global digital payments and merchant solutions, while investing heavily to maintain dominance in areas like BNPL and embedded finance. Arista Networks (Emerging leader) is gaining momentum by focusing on the high-potential Lending as a Service sector, where its AI-powered platform aims to disrupt traditional credit models and achieve significant future growth.
Source: Secondary Research, Interviews with Experts, MarketsandMarkets Analysis
KEY MARKET PLAYERS
MARKET SCOPE
| REPORT METRIC | DETAILS |
|---|---|
| Market Size in 2024 (Value) | USD 407.88 Billion |
| Market Forecast in 2030 (value) | USD 906.14 Billion |
| Growth Rate | CAGR of 14.0% from 2025-2030 |
| Years Considered | 2020–2030 |
| Base Year | 2024 |
| Forecast Period | 2025–2030 |
| Units Considered | Value (USD) Million/Billion |
| Report Coverage | Revenue forecast, company ranking, competitive landscape, growth factors, and trends |
| Segments Covered |
|
| Regions Covered | North America, Europe, Asia Pacific, Middle East & Africa, Latin America |
WHAT IS IN IT FOR YOU: Fintech as a Service Market REPORT CONTENT GUIDE
DELIVERED CUSTOMIZATIONS
We have successfully delivered the following deep-dive customizations:
| CLIENT REQUEST | CUSTOMIZATION DELIVERED | VALUE ADDS |
|---|---|---|
| Leading Service Provider (US) |
|
|
| Company Information | Detailed analysis and profiling of additional market players (up to 5) |
|
RECENT DEVELOPMENTS
- July 2025 : PayPal partnered with Wix Advance, to provide a consolidated view for merchants to streamline payment management, enhance conversions, and meet the growing demand for flexible payment options.
- July 2025 : Mastercard partnered with BMO to expand BMO’s Global Money Transfer service, powered by Mastercard Move’s global money movement capabilities. With new destinations and currencies added, BMO’s Canadian personal banking clients can now send money to family and friends in nearly 70 locations across Europe, the Middle East, Africa, Asia Pacific, Latin America, and the Caribbean.
- July 2025 : FIS partnered with a subsidiary of Circle Internet Group, Inc. (Circle) to enable financial institutions to conduct transactions in USDC, the world’s largest regulated stablecoin. This partnership follows new US stablecoin legislation that facilitates the integration of digital assets with traditional finance in the US. It is part of FIS’s broader strategy to support digital assets and currencies, demonstrating FIS’s commitment to delivering innovative technology solutions across the entire money lifecycle.
- July 2025 : Fiserv and PayPal teamed up to develop future interoperability between FIUSD and PayPal USD (PYUSD), enabling consumers and businesses to transfer funds both domestically and internationally. Leveraging the global reach of Fiserv and PayPal across banking, consumer, and merchant payments, this interoperability will help both companies expand the use of stablecoins and programmable payments worldwide.
- June 2025 : Stripe established a partnership with Shopify, whereby Stripe will assist countless Shopify merchants in accepting stablecoin payments. Merchants across 34 countries will have the capability to accept payments in USDC on Base utilizing their preferred cryptocurrency wallets.
- June 2025 : Rapyd enabled its merchants in the UK and Ireland to effortlessly and securely accept in-person contactless payments with Tap to Pay on iPhone. Tap to Pay on iPhone allows merchants to accept all types of contactless payments, including contactless credit and debit cards, Apple Pay, and other digital wallets, using only an iPhone and the Rapyd Pay app – no extra hardware or payment terminal required.
Table of Contents
 Exclusive indicates content/data unique to MarketsandMarkets and not available with any competitors.
Methodology
This research study on the Fintech as a Service market involved extensive secondary sources, directories, and several journals, databases, such as D&B Hoovers, Bloomberg Businessweek, and Factiva, to identify and collect information useful for this technical, market-oriented, and commercial study of the Fintech as a Service market. Primary sources were industry experts from core and related industries, preferred system developers, service providers, resellers, partners, and organizations related to the various segments of the industry’s value chain. In-depth interviews were conducted with different primary respondents, including key industry participants and subject-matter experts, to obtain and verify critical qualitative and quantitative information, as well as to assess the market’s prospects. These included key industry participants, subject-matter experts, C-level executives of key companies, and industry consultants. Primary sources were mainly industry experts from the core and related industries, preferred Fintech as a Service providers, third-party service providers, consulting service providers, end users, and other commercial enterprises. In-depth interviews were conducted with various primary respondents, including key industry participants and subject matter experts, to obtain and verify critical qualitative and quantitative information and assess growth prospects.
Secondary Research
The market size of companies offering Fintech as a Service was determined based on secondary data available through paid and unpaid sources. It was also arrived at by analyzing the product portfolios of major companies and rating the companies based on their performance and quality. In the secondary research process, various sources were referred to for identifying and collecting information for this study. Secondary sources included annual reports, press releases, and investor presentations of companies; white papers, journals, and certified publications; and articles from recognized authors, directories, and databases. The data was also collected from other secondary sources, such as journals and related magazines. Fintech as a Service spending in various countries was extracted from the respective sources. Secondary research was mainly used to obtain the key information related to the industry’s value chain and supply chain to identify key players, market classification, and segmentation according to offerings of major players; industry trends related to offering, deployment, application, and regions; and key developments from both market and technology-oriented perspectives.
Primary Research
In the primary research process, various primary sources from both the supply and demand sides were interviewed to obtain qualitative and quantitative information for the report. The primary sources from the supply side included industry experts, such as Chief Executive Officers (CEOs), Vice Presidents (VPs), marketing directors, technology and innovation directors, and related key executives from various key companies and organizations providing Fintech as a Service solutions and services. The primary sources from the demand side included end users, such as Chief Information Officers (CIOs), consultants, service professionals, technicians and technologists, and managers at public and investor-owned utilities.
In the market engineering process, top-down and bottom-up approaches were extensively used, along with several data triangulation methods, to perform market estimation and market forecasting for the overall market segments and subsegments listed in the report. Extensive qualitative and quantitative analyses were performed on the complete market engineering process to list key information/insights throughout the report.
After the complete market engineering (including calculations for market statistics, market breakup, market size estimations, market forecasting, and data triangulation), extensive primary research was conducted to gather information. Primary research was conducted to identify the segmentation, industry trends, key players, competitive landscape, and key market dynamics, such as drivers, restraints, opportunities, and challenges.

Note 1: Tier 1 companies have revenues greater than USD 10 billion; tier 2 companies' revenues range
between USD 1 and 10 billion; and tier 3 companies' revenues range between USD 500 million and 1 billion
Note 2: Others include sales, marketing, and product managers.
Source: Secondary Literature, Interviews with Experts, and MarketsandMarkets Analysis
To know about the assumptions considered for the study, download the pdf brochure
Market Size Estimation
Multiple approaches were adopted to estimate and forecast the Fintech as a Service market. The first approach involved estimating the market size by summing up the companies’ revenue generated through the sale of services.
The research methodology used to estimate the market size included the following:
- We used primary and secondary research to determine the revenue contributions of the major market participants in each country after secondary research helped identify them.
- Throughout the process, we obtained critical insights by conducting in-depth interviews with industry professionals, including directors, CEOs, VPs, and marketing executives, and by reading the annual and financial reports of the top firms in the market.
- We used primary sources to verify all percentage splits and breakups, which we calculated using secondary sources.
Fintech as a Service Market : Top-Down and Bottom-Up Approach

Data Triangulation
Once the overall market size was determined, we divided the market into segments and subsegments using the previously described market size estimation procedures. When required, market breakdown and data triangulation procedures were employed to complete the market engineering process and specify the exact figures for every market segment and subsegment. The data was triangulated by examining several variables and patterns from the government entities' supply and demand sides.
Market Definition
Fintech as a Service (FaaS) is a cloud-based model in which third-party providers offer modular financial technology solutions, such as payments, banking, and lending, via APIs or white-label platforms. It enables businesses to seamlessly integrate and offer branded financial services without developing complex infrastructure, reducing costs and time to market.
Stakeholders
- Solution Architects
- CISOs
- Data Privacy Officers
- Chief Identity Officers
- Government Bodies and Public Safety Agencies
- Project Managers
- Developers
- Business Analysts
- Quality Assurance (QA)/Test Engineers
- Providers of Fintech as a Service Solutions and Services
- Consulting Firms
- Third-party Vendors
- Investors and Venture Capitalists
- Technology Providers
Report Objectives
- To define, describe, and forecast the Fintech as a Service market in terms of value
- To provide detailed information regarding drivers, restraints, opportunities, and challenges influencing the growth of the market
- To forecast the market by type, deployment model, end user, and region
- To forecast the market size of segments for five main regions: North America, Europe, Asia Pacific, the Middle East & Africa, and Latin America
- To analyze the opportunities in the market and provide details of the competitive landscape for stakeholders and market leaders
- To profile the key market players, including top vendors and startups; provide a comparative analysis based on business overviews, regional presence, product offerings, business strategies, and key financials; and provide a detailed competitive landscape of the market
- To analyze the competitive developments, such as mergers & acquisitions (M&A), product launches/enhancements, agreements, partnerships, collaborations, expansions, and R&D activities, in the market
Available Customizations
MarketsandMarkets provides customizations based on the company's unique requirements using market data. The following customization options are available for the report:
Product Analysis
- The product matrix provides a detailed comparison of each company's portfolio.
Geographic Analysis as per Feasibility
- Further breakup of the Fintech as a Service market
Company Information
- Detailed analysis and profiling of five additional market players
Key Questions Addressed by the Report
What is the definition of the Fintech as a Service market?
Fintech as a Service (FaaS) is a cloud-based model in which third-party providers offer modular financial technology solutions, such as payments, banking, and lending, via APIs or white-label platforms. It enables businesses to seamlessly integrate and offer branded financial services without developing complex infrastructure, reducing costs and time to market.
What is the market size of the Fintech as a Service market?
The Fintech as a Service market is estimated to grow from USD 470.94 billion in 2025 to USD 906.14 billion by 2030, at a compounded annual growth rate (CAGR) of 14.0% from 2025 to 2030.
What are the major drivers in the Fintech as a Service market?
The major drivers in the Fintech as a Service market are the operational flexibility and scalability with the advent of cloud computing technology, increasing demand for real-time payments and transactions, and the rise in demand for streamlined compliance and regulatory solutions.
Who are the key players operating in the Fintech as a Service market?
The key market players profiled in the Fintech as a Service market include PayPal (US), Mastercard (US), Stripe (US), Fiserv (US), Block, Inc. (US), Rapyd (UK), Envestnet (US), Upstart (US), Solid Financial Technologies (US), FIS (US), Synctera (US), Adyen (Netherlands), SoFi (US), Marqeta (US), Dwolla (US), Finastra (UK), Temenos (Switzerland), PolicyBazaar (India), Razorpay (India), Revolut (UK), Fispan (Canada), NIUM (SG), Airwallex (AUS), Finix (US), Synapse (US), Volante Technologies (US), Plaid (US), Currencycloud (UK), Mambu (Netherlands), Form3 (UK), Solaris (Germany), Chime (US), M2P Fintech (India), and Railsr (UK).
What are the key technological trends prevailing in the Fintech as a Service market?
The Fintech as a Service market is seeing key trends such as APIs, cloud computing, artificial intelligence, machine learning, blockchain, distributed ledger technology (DLT), open banking platforms, robotic process automation (RPA), big data analytics, cybersecurity solutions, biometric authentication, Internet of Things (IoT), RegTech, digital identity verification, and edge computing.
Need a Tailored Report?
Customize this report to your needs
Get 10% FREE Customization
Customize This ReportPersonalize This Research
- Triangulate with your Own Data
- Get Data as per your Format and Definition
- Gain a Deeper Dive on a Specific Application, Geography, Customer or Competitor
- Any level of Personalization
Let Us Help You
- What are the Known and Unknown Adjacencies Impacting the Fintech as a Service Market
- What will your New Revenue Sources be?
- Who will be your Top Customer; what will make them switch?
- Defend your Market Share or Win Competitors
- Get a Scorecard for Target Partners

Custom Market Research Services
We Will Customise The Research For You, In Case The Report Listed Above Does Not Meet With Your Requirements
Get 10% Free CustomisationTESTIMONIALS


Growth opportunities and latent adjacency in Fintech as a Service Market