Contactless Payment Market by Component (Hardware (PoS and Cards), Solutions, and Services (Consulting, Integration and Deployment, and Support and Maintenance)), Vertical (Retail and hospitality), and Region - Global Forecast to 2025


Contactless Payments Market Size & Share - Worldwide | Forecast - 2025
[154 Pages Report] The global Contactless Payment Market size was valued at $10.3 billion in 2020 and is poised to reach over $17.9 Billion by the cease of 2025, at a increasing CAGR of 11.7% during the forecast period (2020 to 2025). The base year for estimation is 2019 and the market size available for the years 2018-2025.
Contactless payment is the combination of smart hardware, smart software, and smart services to bring advancements in traditional payment systems with the aim to introduce smart transactions. The demand for contactless payment technologies is driven by the requirement to replace cash in society and increase the volume of cashless transactions across various outlets, from convenience stores and coffee houses, to transport networks. The contactless payment market is expected to grow at a rapid pace due to the evolution of new payment technologies, such as HCE and NFC. These technologies enable payment transactions through contactless chips embedded in payment cards, tags, key fobs, wearables, and mobile phones. These chips communicate with a contactless reader that uses either Radio Frequenecy (RF) or NFC standards. The technology further enables machine-to-machine communication, including RFID. The presence of various key players in the ecosystem has led to competitive and diverse market.

To know about the assumptions considered for the study, Request for Free Sample Report
COVID-19 has impacted the global economy. It has had a significant economic impact on various financial and industrial sectors, such as energy, oil and gas, transportation and logistics, manufacturing, and aviation. It is predicted that the global economy will go into recession due to the loss of trillions of dollars. With the increasing number of countries imposing and extending lockdowns, economic activities are declining, which would impact the global economy. Every individual and government, irrespective of federal, state, central, local, and provinces, has been in constant touch with one other in the society to provide and get real-time information on COVID-19.
COVID-19 cases are growing day-by-day, as several infected cases have been on the rise. In line with individuals, COVID-19 has a massive impact on large enterprises and SMEs. Core industries, such as manufacturing, automotive, textile, transportation and logistics, travel and hospitality, and consumer goods, have been closed due to country-level lockdown across the globe. This would have a substantial impact on the global economy in terms of the decline in GDP. Since ages, SMEs are acting as the backbone of the economy. In the current situation, SMEs are the most affected due to the COVID-19 pandemic.
Contactless Payment Market Growth Dynamics
Driver: Enhance purchase experience
One of the biggest complaints about the EMV chip technology is the additional time these transactions take. Contactless payments eliminate friction and offer customers a better buying experience. Positive results from reduced transaction time are completely dependent on the percentage of transactions conducted during peak hours. A shorter queue simply indicates that several customers have been served. Contactless payment technologies, such as NFC, HCE, and RFID ensure faster transactions with touch-and-go payments leading to quicker customer throughput during peak periods in the retail, BFSI, hospitality, and transportation sectors and helps reduce queues. The increased throughput will directly result the increment of revenues.
Restraint: High cost of deploying contactless payment technologies
NFC-enabled readers are relatively expensive as compared to readers of other kinds. An industry that is ready to invest in new contactless technology-enabled readers or POS terminals will have to shed out a large amount of money to adopt, purchase, and maintain related machines and other equipment. While large and well-established companies have successfully incorporated this technology, smaller companies may find it difficult to sustain their existing turnover and enhance profits, while adopting the technology. Installing the hardware and software and hiring technicians to maintain the same could result in spiraling expenses for the concerned company.
Opportunity: Rising demand for mobile and wearable payment devices
NFC-enabled mobile handsets are embedded with smart chips that allow phones to securely store payment applications and consumer account information. This data can be easily used as virtual payment cards. The embedded smart chips are available in many forms, such as Subscriber Identification Module (SIM) cards, embedded secure elements in the phone, and Secure Digital (SD) memory cards. NFC chips in mobile devices can act as a card and a reader, enabling consumer devices to safely share information and make secure payments quickly. The introduction of the HCE technology specifically for mobile phones further offers major growth opportunities for the contactless payment market vendors in the next 10 years specifically for the MEA and APAC.
Challenge: Lack of customer awareness
Lack of acceptable standards for contactless cards hinders the global acceptance of this technology. Consumers are in need of a viable alternative to cash for making payments; however, they are not aware of the options available in the market. In developing countries, consumers are mostly unaware of the contactless card payment technology. Financial regulators have to make huge efforts to educate people in these countries about the availability of different types of cards that are scalable and secure. The lack of standard payment technology in countries is also a major challenge for contactless payment vendors.
The solutions to record a higher growth rate during the forecast period
In the Contactless payment market by component, the solutions is expected to record a higher growth rate during the forecast period. Contactless payment solutions include software and applications required to build contactless payment functionalities to integrate into electronic devices, such as apps for smartphones and smartwatches, thus making them NFC-enabled. For instance, PayCore Contactless Level 2 (L2) Kernel is a middleware application between terminal OS and terminal payment application that offers an EMV transaction between a terminal and card.

To know about the assumptions considered for the study, download the pdf brochure
APAC to have a higher growth rate during the forecast period
By region, APAC is expected to grow at the highest CAGR during the forecast period. This is because of the rapid deployment of contactless payment technologies in the countries, such as China, Japan, Singapore, Australia, India, and South Korea. The contactless payment market in MEA has just started gaining traction and hence exhibits good revenue opportunities for contactless payment vendors. Latin America is a comparatively smaller market due to the lack of technological advancements in the region. However, the overall development and penetration of contactless technology in countries, such as Brazil and Mexico is expected to drive the growth of the contactless payment market in the region during the forecast period
Key Market Players
The report covers the competitive landscape and profiles major market players, as Gemalto (Netherlands), Infineon (Germany), Ingenico (France), WIrecard (Germany), Verifone (US), Geisecke+Devrient (Germany), Idemia (France), On Track innovations (Israel), Identiv (US), CPI Card Group (US), Bitel (South Korea), Setomatic systems (US), Valitor (Iceland), Pax Global Technology (china), Mypinpad (UK), Mobeewave (Canada), Alcineo (South Africa), Castles (Taiwan), Sumup (UK) and Paycore (Istanbul). These players have adopted several organic and inorganic growth strategies, including new product launches, partnerships and collaborations, and acquisitions, to expand their offerings and market shares in the global contactless payment market.
Scope of the Report
|
Report Metrics |
Attributes |
|
Revenue Forecast in 2025 |
$17.9 Billion |
|
Market Size in 2020 |
$10.3 Billion |
|
CAGR (2020-2025) |
11.7% |
|
Key Market Opportunities |
Rising demand for mobile and wearable payment devices |
|
Key Growth Drivers |
Enhance purchase experience |
|
Market size available for years |
2018–2025 |
|
Base year considered |
2019 |
|
Forecast period |
2020–2025 |
|
Forecast units |
Value (USD) |
|
Market Segmentation |
Component (Hardware [POS, Cards, and Others], Solutions, and Services [Consulting, Integration and Deployment, and Support and Maintenance]), Vertical (Retail, Hospitality, Healthcare, Energy and Utilities, Transportation and Logistics, BFSI, and Others), and Region |
|
Regions Covered |
North America, Europe, APAC, MEA, and Latin America |
|
Key Players |
Gemalto (Netherlands), Infineon (Germany), Ingenico (France), Wirecard (Germany), Verifone (US), Giesecke+Devrient (Germany), IDEMIA (France), On Track Innovations (Israel), Identiv (US), CPI Card Group (US), Bitel (South Korea), Setomatic Systems (US), Valitor (Iceland), PAX Global Technology (China), MYPINPAD (UK), Mobeewave (Canada), Alcineo (South Africa), Castles (Taiwan), SumUp (UK), and PayCore (Istanbul) |
The research report categorizes the Contactless Payment Market based on component (hardware, solutions, and services), vertical, and region.
By Component
-
Hardware
- POS
- Cards
- Others (Wearables, readers, key fobs, and tags)
- Solutions
-
Services
- Consulting
- Integration and Deployment
- Support and Maintenance
By Vertical:
- Retail
- Hospitality
- Healthcare
- Energy and Utilities
- Transportation and Logistics
- BFSI
- Others (Government, telecommunications, and education)
By Region:
- North America
- Europe
- APAC
- MEA
- Latin America
Recent Developments:
- In January 2019, ICBC, a bank in China, awarded Gemalto a three-year agreement to continue supplying them with contactless cards. The contract addresses multiple card scheme-brands, such as Amex, China UnionPay, JCB, Mastercard, and Visa.
- In February 2019, Infineon developed sensor and security solutions introducing REAL3 and SECORA Pay to meet consumer requirements. Infineon’s REAL3 image sensor chip built into a mobile device allows fast, seamless, and secured user authentication. Infineon’s SECORA Pay portfolio consists of turnkey solutions for contactless payment cards, such as Visa and Mastercard.
- In April 2018, Ingenico introduced the Moby/C150 ECR, an EMV pre-certified, and a full-featured Android-based tablet PoS solution with a 15.6-inch display that can be customized for merchant business needs.
Frequently Asked Questions (FAQ):
What is the Contactless Payments Market Size?
What is the Contactless Payment Market Growth?
What are the key opportunities in the Contactless Payment market?
Who are the key players in Contactless Payment market?
Who will be the leading hub for Contactless Payment market?
What is the Contactless Payment market Segmentation?
To speak to our analyst for a discussion on the above findings, click Speak to Analyst
 Exclusive indicates content/data unique to MarketsandMarkets and not available with any competitors.
TABLE OF CONTENTS
1 INTRODUCTION (Page No. - 17)
1.1 OBJECTIVES OF THE STUDY
1.2 MARKET DEFINITION
1.2.1 INCLUSIONS AND EXCLUSIONS
1.3 MARKET SCOPE
1.3.1 MARKET SEGMENTATION
1.4 YEARS CONSIDERED FOR THE STUDY
1.5 CURRENCY CONSIDERED
1.6 STAKEHOLDERS
2 RESEARCH METHODOLOGY (Page No. - 21)
2.1 RESEARCH DATA
2.1.1 SECONDARY DATA
2.1.2 PRIMARY DATA
2.1.2.1 Breakup of primary profiles
2.2 MARKET BREAKUP AND DATA TRIANGULATION
2.3 MARKET SIZE ESTIMATION
2.4 MARKET FORECAST
2.5 COMPETITIVE LEADERSHIP MAPPING METHODOLOGY
2.6 ASSUMPTIONS FOR THE STUDY
2.7 LIMITATIONS OF THE STUDY
3 EXECUTIVE SUMMARY (Page No. - 29)
4 PREMIUM INSIGHTS (Page No. - 34)
4.1 ATTRACTIVE MARKET OPPORTUNITIES IN THE CONTACTLESS PAYMENT MARKET
4.2 GLOBAL CONTACTLESS PAYMENT MARKET, BY COMPONENT AND REGION
4.3 MARKET, BY REGION
4.4 MARKET: INVESTMENT SCENARIO
5 MARKET OVERVIEW AND INDUSTRY TRENDS (Page No. - 37)
5.1 INTRODUCTION
5.2 MARKET DYNAMICS
5.2.1 DRIVERS
5.2.1.1 Contactless payments ensure faster transactions
5.2.1.2 Increased customer satisfaction and improved loyalty programs
5.2.1.3 Enhanced purchase experience
5.2.2 RESTRAINTS
5.2.2.1 Risk of stolen or lost contactless cards
5.2.2.2 High cost of deploying contactless payment technologies
5.2.3 OPPORTUNITIES
5.2.3.1 Use of security features of emerging technologies, such as blockchain and 5G
5.2.3.2 Rising demand for mobile and wearable payment devices
5.2.4 CHALLENGES
5.2.4.1 Lack of consumer awareness
5.2.4.2 Banking laws and payment association rules
5.3 STANDARDS AND REGULATIONS
5.3.1 ISO/IEC 14443
5.3.1.1 Part 1
5.3.1.2 Part 2
5.3.1.3 Part 3
5.3.1.4 Part 4
5.3.2 ISO/IEC 15693
5.3.2.1 Part 1
5.3.2.2 Part 2
5.3.2.3 Part 3
5.3.3 ISO/IEC 18092
5.3.3.1 Read/Write
5.3.3.2 Peer-to-Peer
5.4 USE CASES
5.4.1 USE CASE: TRANSPORT AND LOGISTICS
5.4.2 USE CASE: HOSPITALITY
5.4.3 USE CASE: TRANSPORTATION AND LOGISTICS
5.5 IMPACT OF DISRUPTIVE TECHNOLOGIES
5.5.1 BLOCKCHAIN
5.5.2 5G
5.5.3 AUGMENTED REALITY
6 CONTACTLESS PAYMENT MARKET, BY TECHNOLOGY (Page No. - 45)
6.1 INTRODUCTION
6.1.1 TECHNOLOGY: MARKET DRIVERS
6.1.2 TECHNOLOGY: VENDOR INITIATIVES AND DEVELOPMENTS
6.2 RADIO FREQUENCY IDENTIFICATION
6.3 NEAR FIELD COMMUNICATION
6.4 HOST CARD EMULATION
7 CONTACTLESS PAYMENT MARKET, BY PAYMENT MODE (Page No. - 47)
7.1 INTRODUCTION
7.1.1 PAYMENT MODES: MARKET DRIVERS
7.1.2 PAYMENT MODES: VENDOR INITIATIVES AND DEVELOPMENTS
7.2 SMARTPHONES
7.3 SMARTCARDS
7.4 OTHERS
8 CONTACTLESS PAYMENT MARKET, BY COMPONENT (Page No. - 49)
8.1 INTRODUCTION
8.1.1 COMPONENT: MARKET DRIVERS
8.1.2 COMPONENT: VENDOR INITIATIVES AND DEVELOPMENTS
8.2 HARDWARE
8.2.1 POINT OF SALE
8.2.2 CARDS
8.2.3 OTHERS
8.3 SERVICES
8.3.1 CONSULTING
8.3.2 INTEGRATION AND DEPLOYMENT
8.3.3 SUPPORT AND MAINTENANCE
8.4 SOLUTIONS
9 CONTACTLESS PAYMENT MARKET, BY VERTICAL (Page No. - 66)
9.1 INTRODUCTION
9.1.1 VERTICALS: MARKET DRIVERS
9.1.2 VERTICALS: VENDOR INITIATIVES AND DEVELOPMENTS
9.2 RETAIL
9.3 HEALTHCARE
9.4 HOSPITALITY
9.5 ENERGY AND UTILITIES
9.6 TRANSPORTATION AND LOGISTICS
9.7 BANKING, FINANCIAL SERVICES AND INSURANCE
9.8 OTHER VERTICALS
9.8.1 EDUCATION
9.8.2 TELECOMMUNICATIONS
9.8.3 GOVERNMENT
10 CONTACTLESS PAYMENT MARKET, BY REGION (Page No. - 81)
10.1 INTRODUCTION
10.2 NORTH AMERICA
10.2.1 NORTH AMERICA: MARKET DRIVERS
10.2.2 NORTH AMERICA: VENDOR INITIATIVES AND DEVELOPMENTS
10.2.3 UNITED STATES
10.2.4 CANADA
10.3 EUROPE
10.3.1 EUROPE: MARKET DRIVERS
10.3.2 EUROPE: VENDOR INITIATIVES AND DEVELOPMENTS
10.3.3 UNITED KINGDOM
10.3.4 GERMANY
10.3.5 SWEDEN
10.3.6 REST OF EUROPE
10.4 ASIA PACIFIC
10.4.1 ASIA PACIFIC: MARKET DRIVERS
10.4.2 ASIA PACIFIC: VENDOR INITIATIVES AND DEVELOPMENTS
10.4.3 CHINA
10.4.4 SOUTH KOREA
10.4.5 AUSTRALIA
10.4.6 INDIA
10.4.7 SINGAPORE
10.4.8 REST OF ASIA PACIFIC
10.5 MIDDLE EAST AND AFRICA
10.5.1 MIDDLE EAST AND AFRICA: MARKET DRIVERS
10.5.2 MIDDLE EAST AND AFRICA: VENDOR INITIATIVES AND DEVELOPMENTS
10.5.3 UNITED ARAB EMIRATES
10.5.4 KINGDOM OF SAUDI ARABIA
10.5.5 ISRAEL
10.5.6 SOUTH AFRICA
10.5.7 QATAR
10.5.8 REST OF MIDDLE EAST AND AFRICA
10.6 LATIN AMERICA
10.6.1 LATIN AMERICA: MARKET DRIVERS
10.6.2 LATIN AMERICA: VENDOR INITIATIVES AND DEVELOPMENTS
10.6.3 BRAZIL
10.6.4 MEXICO
10.6.5 REST OF LATIN AMERICA
11 COMPETITIVE LANDSCAPE (Page No. - 114)
11.1 OVERVIEW
11.2 COMPETITIVE LEADERSHIP MAPPING
11.2.1 VISIONARY LEADERS
11.2.2 DYNAMIC DIFFERENTIATORS
11.2.3 INNOVATORS
11.2.4 EMERGING COMPANIES
11.3 STRENGTH OF PRODUCT PORTFOLIO
11.4 BUSINESS STRATEGY EXCELLENCE
11.5 RANKING OF KEY PLAYERS
12 COMPANY PROFILES (Page No. - 119)
12.1 INTRODUCTION
(Business Overview, Solutions & Services, Key Insights, Recent Developments, SWOT Analysis, MnM View)*
12.2 GEMALTO
12.3 INFINEON
12.4 INGENICO
12.5 WIRECARD
12.6 VERIFONE
12.7 GIESECKE+DEVRIENT
12.8 IDEMIA
12.9 ON TRACK INNOVATIONS
12.10 IDENTIV
12.11 CPI CARD GROUP
12.12 BITEL
12.13 SETOMATIC SYSTEMS
12.14 VALITOR
12.15 PAX GLOBAL TECHNOLOGY
12.16 MYPINPAD
12.17 MOBEEWAVE
12.18 ALCINEO
12.19 CASTLES
12.20 SUMUP
12.21 PAYCORE
*Details on Business Overview, Solutions & Services, Key Insights, Recent Developments, SWOT Analysis, MnM View might not be captured in case of unlisted companies.
12.22 RIGHT-TO-WIN
13 APPENDIX (Page No. - 159)
13.1 DISCUSSION GUIDE
13.2 KNOWLEDGE STORE: MARKETSANDMARKETS’ SUBSCRIPTION PORTAL
13.3 AVAILABLE CUSTOMIZATIONS
13.4 RELATED REPORTS
13.5 AUTHOR DETAILS
LIST OF TABLES (104 Tables)
TABLE 1 UNITED STATES DOLLAR EXCHANGE RATE, 2017-2019
TABLE 2 CONTACTLESS PAYMENT MARKET SIZE, BY COMPONENT, 2018–2025 (USD MILLION)
TABLE 3 HARDWARE: MARKET SIZE, BY REGION, 2018–2025 (USD MILLION)
TABLE 4 NORTH AMERICA: HARDWARE MARKET SIZE, BY COUNTRY, 2018–2025 (USD MILLION)
TABLE 5 EUROPE: HARDWARE MARKET SIZE, BY COUNTRY, 2018–2025 (USD MILLION)
TABLE 6 HARDWARE: CONTACTLESS PAYMENT MARKET SIZE, BY TYPE, 2018–2025 (USD MILLION)
TABLE 7 POINT OF SALE MARKET SIZE, BY REGION, 2018–2025 (USD MILLION)
TABLE 8 NORTH AMERICA: POINT OF SALE MARKET SIZE, BY COUNTRY, 2018–2025 (USD MILLION)
TABLE 9 EUROPE: POINT OF SALE MARKET SIZE, BY COUNTRY, 2018–2025 (USD MILLION)
TABLE 10 CARDS MARKET SIZE, BY REGION, 2018–2025 (USD MILLION)
TABLE 11 NORTH AMERICA: CARDS MARKET SIZE, BY COUNTRY, 2018–2025 (USD MILLION)
TABLE 12 EUROPE: CARDS MARKET SIZE, BY COUNTRY, 2018–2025 (USD MILLION)
TABLE 13 OTHERS MARKET SIZE, BY REGION, 2018–2025 (USD MILLION)
TABLE 14 NORTH AMERICA: OTHERS MARKET SIZE, BY COUNTRY, 2018–2025 (USD MILLION)
TABLE 15 EUROPE: OTHERS MARKET SIZE, BY COUNTRY, 2018–2025 (USD MILLION)
TABLE 16 SERVICES: CONTACTLESS PAYMENT MARKET SIZE, BY REGION, 2018–2025 (USD MILLION)
TABLE 17 NORTH AMERICA: SERVICES MARKET SIZE, BY COUNTRY, 2018–2025 (USD MILLION)
TABLE 18 EUROPE: SERVICES MARKET SIZE, BY COUNTRY, 2018–2025 (USD MILLION)
TABLE 19 SERVICES: MARKET SIZE, BY TYPE, 2018–2025 (USD MILLION)
TABLE 20 CONSULTING MARKET SIZE, BY REGION, 2018–2025 (USD MILLION)
TABLE 21 NORTH AMERICA: CONSULTING MARKET SIZE, BY COUNTRY, 2018–2025 (USD MILLION)
TABLE 22 EUROPE: CONSULTING MARKET SIZE, BY COUNTRY, 2018–2025 (USD MILLION)
TABLE 23 INTEGRATION AND DEPLOYMENT MARKET SIZE, BY REGION, 2018–2025 (USD MILLION)
TABLE 24 NORTH AMERICA: INTEGRATION AND DEPLOYMENT MARKET SIZE, BY COUNTRY, 2018–2025 (USD MILLION)
TABLE 25 EUROPE: INTEGRATION AND DEPLOYMENT MARKET SIZE, BY COUNTRY, 2018–2025 (USD MILLION)
TABLE 26 SUPPORT AND MAINTENANCE MARKET SIZE, BY REGION, 2018–2025 (USD MILLION)
TABLE 27 NORTH AMERICA: SUPPORT AND MAINTENANCE MARKET SIZE, BY COUNTRY, 2018–2025 (USD MILLION)
TABLE 28 EUROPE: SUPPORT AND MAINTENANCE MARKET SIZE, BY COUNTRY, 2018–2025 (USD MILLION)
TABLE 29 SOLUTIONS: CONTACTLESS PAYMENT MARKET SIZE, BY REGION, 2018–2025 (USD MILLION)
TABLE 30 NORTH AMERICA: SOLUTIONS MARKET SIZE, BY COUNTRY, 2018–2025 (USD MILLION)
TABLE 31 EUROPE: SOLUTIONS MARKET SIZE, BY COUNTRY, 2018–2025 (USD MILLION)
TABLE 32 CONTACTLESS PAYMENT MARKET SIZE, BY VERTICAL, 2018–2025 (USD MILLION)
TABLE 33 RETAIL: MARKET SIZE, BY REGION, 2018–2025 (USD MILLION)
TABLE 34 NORTH AMERICA: RETAIL MARKET SIZE, BY COUNTRY, 2018–2025 (USD MILLION)
TABLE 35 EUROPE: RETAIL MARKET SIZE, BY COUNTRY, 2018–2025 (USD MILLION)
TABLE 36 HEALTHCARE: CONTACTLESS PAYMENT MARKET SIZE, BY REGION, 2018–2025 (USD MILLION)
TABLE 37 NORTH AMERICA: HEALTHCARE MARKET SIZE, BY COUNTRY, 2018–2025 (USD MILLION)
TABLE 38 EUROPE: HEALTHCARE MARKET SIZE, BY COUNTRY, 2018–2025 (USD MILLION)
TABLE 39 HOSPITALITY: MARKET SIZE, BY REGION, 2018–2025 (USD MILLION)
TABLE 40 NORTH AMERICA: HOSPITALITY MARKET SIZE, BY COUNTRY, 2018–2025 (USD MILLION)
TABLE 41 EUROPE: HOSPITALITY MARKET SIZE, BY COUNTRY, 2018–2025 (USD MILLION)
TABLE 42 ENERGY AND UTILITIES: CONTACTLESS PAYMENT MARKET SIZE, BY REGION, 2018–2025 (USD MILLION)
TABLE 43 NORTH AMERICA: ENERGY AND UTILITIES MARKET SIZE, BY COUNTRY, 2018–2025 (USD MILLION)
TABLE 44 EUROPE: ENERGY AND UTILITIES MARKET SIZE, BY COUNTRY, 2018–2025 (USD MILLION)
TABLE 45 TRANSPORTATION AND LOGISTICS: CONTACTLESS PAYMENT MARKET SIZE, BY REGION, 2018–2025 (USD MILLION)
TABLE 46 NORTH AMERICA: TRANSPORTATION AND LOGISTICS MARKET SIZE, BY COUNTRY, 2018–2025 (USD MILLION)
TABLE 47 EUROPE: TRANSPORTATION AND LOGISTICS MARKET SIZE, BY COUNTRY, 2018–2025 (USD MILLION)
TABLE 48 BANKING, FINANCIAL SERVICES AND INSURANCE: MARKET SIZE, BY REGION, 2018–2025 (USD MILLION)
TABLE 49 NORTH AMERICA: BANKING, FINANCIAL SERVICES AND INSURANCE MARKET SIZE, BY COUNTRY, 2018–2025 (USD MILLION)
TABLE 50 EUROPE: BANKING, FINANCIAL SERVICES AND INSURANCE MARKET SIZE, BY COUNTRY, 2018–2025 (USD MILLION)
TABLE 51 OTHER VERTICALS: MARKET SIZE, BY REGION, 2018–2025 (USD MILLION)
TABLE 52 NORTH AMERICA: OTHER VERTICALS MARKET SIZE, BY COUNTRY, 2018–2025 (USD MILLION)
TABLE 53 EUROPE: OTHER VERTICALS MARKET SIZE, BY COUNTRY, 2018–2025 (USD MILLION)
TABLE 54 CONTACTLESS PAYMENT MARKET SIZE, BY REGION, 2018–2025 (USD MILLION)
TABLE 55 NORTH AMERICA: CONTACTLESS PAYMENT MARKET SIZE, BY COMPONENT, 2018–2025 (USD MILLION)
TABLE 56 NORTH AMERICA: MARKET SIZE, BY HARDWARE, 2018–2025 (USD MILLION)
TABLE 57 NORTH AMERICA: MARKET SIZE, BY SERVICE, 2018–2025 (USD MILLION)
TABLE 58 NORTH AMERICA: MARKET SIZE, BY VERTICAL, 2018–2025 (USD MILLION)
TABLE 59 NORTH AMERICA: MARKET SIZE, BY COUNTRY, 2018–2025 (USD MILLION)
TABLE 60 UNITED STATES: MARKET SIZE, BY COMPONENT, 2018–2025 (USD MILLION)
TABLE 61 UNITED STATES: MARKET SIZE, BY HARDWARE, 2018–2025 (USD MILLION)
TABLE 62 UNITED STATES: MARKET SIZE, BY SERVICE, 2018–2025 (USD MILLION)
TABLE 63 UNITED STATES: MARKET SIZE, BY VERTICAL, 2018–2025 (USD MILLION)
TABLE 64 CANADA: MARKET SIZE, BY COMPONENT, 2018–2025 (USD MILLION)
TABLE 65 CANADA: MARKET SIZE, BY HARDWARE, 2018–2025 (USD MILLION)
TABLE 66 CANADA: MARKET SIZE, BY SERVICE, 2018–2025 (USD MILLION)
TABLE 67 CANADA: MARKET SIZE, BY VERTICAL, 2018–2025 (USD MILLION)
TABLE 68 EUROPE: CONTACTLESS PAYMENT MARKET SIZE, BY COMPONENT, 2018–2025 (USD MILLION)
TABLE 69 EUROPE: MARKET SIZE, BY HARDWARE, 2018–2025 (USD MILLION)
TABLE 70 EUROPE: MARKET SIZE, BY SERVICE, 2018–2025 (USD MILLION)
TABLE 71 EUROPE: MARKET SIZE, BY VERTICAL, 2018–2025 (USD MILLION)
TABLE 72 EUROPE: MARKET SIZE, BY COUNTRY, 2018–2025 (USD MILLION)
TABLE 73 UNITED KINGDOM: MARKET SIZE, BY COMPONENT, 2018–2025 (USD MILLION)
TABLE 74 UNITED KINGDOM: MARKET SIZE, BY HARDWARE, 2018–2025 (USD MILLION)
TABLE 75 UNITED KINGDOM: MARKET SIZE, BY SERVICE, 2018–2025 (USD MILLION)
TABLE 76 UNITED KINGDOM: MARKET SIZE, BY VERTICAL, 2018–2025 (USD MILLION)
TABLE 77 GERMANY: MARKET SIZE, BY COMPONENT, 2018–2025 (USD MILLION)
TABLE 78 GERMANY: MARKET SIZE, BY HARDWARE, 2018–2025 (USD MILLION)
TABLE 79 GERMANY: MARKET SIZE, BY SERVICE, 2018–2025 (USD MILLION)
TABLE 80 GERMANY: MARKET SIZE, BY VERTICAL, 2018–2025 (USD MILLION)
TABLE 81 SWEDEN: MARKET SIZE, BY COMPONENT, 2018–2025 (USD MILLION)
TABLE 82 SWEDEN: MARKET SIZE, BY HARDWARE, 2018–2025 (USD MILLION)
TABLE 83 SWEDEN: MARKET SIZE, BY SERVICE, 2018–2025 (USD MILLION)
TABLE 84 SWEDEN: MARKET SIZE, BY VERTICAL, 2018–2025 (USD MILLION)
TABLE 85 REST OF EUROPE: MARKET SIZE, BY COMPONENT, 2018–2025 (USD MILLION)
TABLE 86 REST OF EUROPE: MARKET SIZE, BY HARDWARE, 2018–2025 (USD MILLION)
TABLE 87 REST OF EUROPE: MARKET SIZE, BY SERVICE, 2018–2025 (USD MILLION)
TABLE 88 REST OF EUROPE: MARKET SIZE, BY VERTICAL, 2018–2025 (USD MILLION)
TABLE 89 ASIA PACIFIC: CONTACTLESS PAYMENT MARKET SIZE, BY COMPONENT, 2018–2025 (USD MILLION)
TABLE 90 ASIA PACIFIC: MARKET SIZE, BY HARDWARE, 2018–2025 (USD MILLION)
TABLE 91 ASIA PACIFIC: MARKET SIZE, BY SERVICE, 2018–2025 (USD MILLION)
TABLE 92 ASIA PACIFIC: MARKET SIZE, BY VERTICAL, 2018–2025 (USD MILLION)
TABLE 93 ASIA PACIFIC: MARKET SIZE, BY COUNTRY, 2018–2025 (USD MILLION)
TABLE 94 MIDDLE EAST AND AFRICA: CONTACTLESS PAYMENT MARKET SIZE, BY COMPONENT, 2018–2025 (USD MILLION)
TABLE 95 MIDDLE EAST AND AFRICA: MARKET SIZE, BY HARDWARE, 2018–2025 (USD MILLION)
TABLE 96 MIDDLE EAST AND AFRICA: MARKET SIZE, BY SERVICE, 2018–2025 (USD MILLION)
TABLE 97 MIDDLE EAST AND AFRICA: MARKET SIZE, BY VERTICAL, 2018–2025 (USD MILLION)
TABLE 98 MIDDLE EAST AND AFRICA: MARKET SIZE, BY COUNTRY, 2018–2025 (USD MILLION)
TABLE 99 LATIN AMERICA: CONTACTLESS PAYMENT MARKET SIZE, BY COMPONENT, 2018–2025 (USD MILLION)
TABLE 100 LATIN AMERICA: MARKET SIZE, BY HARDWARE, 2018–2025 (USD MILLION)
TABLE 101 LATIN AMERICA: MARKET SIZE, BY SERVICE, 2018–2025 (USD MILLION)
TABLE 102 LATIN AMERICA: MARKET SIZE, BY VERTICAL, 2018–2025 (USD MILLION)
TABLE 103 LATIN AMERICA: MARKET SIZE, BY COUNTRY, 2018–2025 (USD MILLION)
TABLE 104 EVALUATION CRITERIA
LIST OF FIGURES (38 Figures)
FIGURE 1 CONTACTLESS PAYMENT MARKET: RESEARCH DESIGN
FIGURE 2 MARKET SIZE ESTIMATION METHODOLOGY: APPROACH 1 (SUPPLY SIDE): REVENUE OF COMPONENT OF THE CONTACTLESS PAYMENT MARKET
FIGURE 3 MARKET SIZE ESTIMATION METHODOLOGY: APPROACH 1 BOTTOM-UP (SUPPLY SIDE): COLLECTIVE REVENUE OF ALL OFFERINGS OF THE CONTACTLESS PAYMENT MARKET
FIGURE 4 MARKET SIZE ESTIMATION METHODOLOGY: APPROACH 2 TOP-DOWN (DEMAND SIDE): SHARE OF THE CONTACTLESS PAYMENT MARKET THROUGH VENDOR OFFERINGS
FIGURE 5 FACTOR ANALYSIS
FIGURE 6 COMPETITIVE LEADERSHIP MAPPING: CRITERIA WEIGHTAGE
FIGURE 7 MARKET TO WITNESS A STEADY GROWTH DURING THE FORECAST PERIOD
FIGURE 8 TOP 3 LEADING SEGMENTS IN THE CONTACTLESS PAYMENT MARKET IN 2020
FIGURE 9 REGIONAL MARKET SCENARIO
FIGURE 10 TOP 3 SEGMENTS, 2020
FIGURE 11 HARDWARE SEGMENT TO HOLD THE HIGHEST MARKET SHARE IN 2020
FIGURE 12 EVOLUTION OF PAYMENT TECHNOLOGIES FOR DELIVERING CUSTOMER CENTRIC SERVICES TO DRIVE THE GLOBAL CONTACTLESS PAYMENT MARKET
FIGURE 13 HARDWARE SEGMENT AND EUROPE TO HOLD THE HIGHEST MARKET SHARES IN 2020
FIGURE 14 ASIA PACIFIC TO GROW AT THE HIGHEST CAGR DURING THE FORECAST PERIOD
FIGURE 15 NORTH AMERICA AND ASIA PACIFIC TO EMERGE AS THE BEST MARKETS FOR INVESTMENTS OVER THE NEXT 5 YEARS
FIGURE 16 DRIVERS, RESTRAINTS, OPPORTUNITIES, AND CHALLENGES: CONTACTLESS PAYMENT MARKET
FIGURE 17 SOLUTIONS SEGMENT TO GROW AT THE HIGHEST CAGR DURING THE FORECAST PERIOD
FIGURE 18 CARDS SEGMENT TO GROW AT THE HIGHEST CAGR DURING THE FORECAST PERIOD
FIGURE 19 TRANSPORTATION AND LOGISTICS SEGMENT TO GROW AT THE HIGHEST CAGR DURING THE FORECAST PERIOD
FIGURE 20 ASIA PACIFIC TO GROW AT THE HIGHEST CAGR DURING THE FORECAST PERIOD
FIGURE 21 EUROPE: MARKET SNAPSHOT
FIGURE 22 ASIA PACIFIC: MARKET SNAPSHOT
FIGURE 23 CONTACTLESS PAYMENT MARKET , COMPETITIVE LEADERSHIP MAPPING, 2020
FIGURE 24 PRODUCT PORTFOLIO ANALYSIS OF TOP PLAYERS IN THE MARKET
FIGURE 25 BUSINESS STRATEGY EXCELLENCE OF TOP PLAYERS IN THE MARKET
FIGURE 26 RANKING OF KEY PLAYERS IN THE CONTACTLESS PAYMENT MARKET, 2020
FIGURE 27 GEMALTO: COMPANY SNAPSHOT
FIGURE 28 GEMALTO: SWOT ANALYSIS
FIGURE 29 INFINEON: COMPANY SNAPSHOT
FIGURE 30 INFINEON: SWOT ANALYSIS
FIGURE 31 INGENICO: COMPANY SNAPSHOT
FIGURE 32 INGENICO: SWOT ANALYSIS
FIGURE 33 WIRECARD: COMPANY SNAPSHOT
FIGURE 34 WIRECARD: SWOT ANALYSIS
FIGURE 35 GIESECKE+DEVRIENT: COMPANY SNAPSHOT
FIGURE 36 ON TRACK INNOVATIONS: COMPANY SNAPSHOT
FIGURE 37 IDENTIV: COMPANY SNAPSHOT
FIGURE 38 CPI CARD GROUP: COMPANY SNAPSHOT
The study involved four major steps to estimate the current market size for the contactless payment market. An exhaustive secondary research was done to collect information on the market for contactless payment, the peer market, and the parent market. The next step was to validate these findings, assumptions, and sizing with industry experts across the value chain through primary research. Both top-down and bottom-up approaches were employed to estimate the complete market size. Thereafter, the market breakup and data triangulation methods were used to estimate the market size of segments and subsegments.
Secondary Research
In the secondary research process, various secondary sources, such as Hoovers, Bloomberg BusinessWeek, and Dun & Bradstreet, have been referred to, to identify and collect information for the study. The secondary sources included companies’ annual reports, press releases, investor presentations, and white papers; certified publications, such as the UK Finance Limited, Forexbonuses.org, Payment Systems Regulator, and ResearchGate were referred to; and articles from recognized associations and government publishing sources.
Primary Research
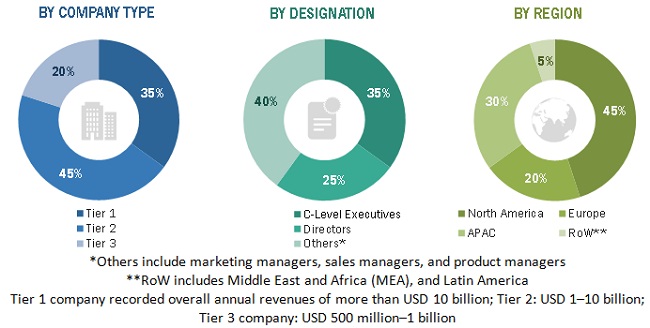
The contactless payment market comprises several stakeholders, such as hardware, solution and service providers, support and maintenance service providers, manufacturing enterprises, technology consultants, system design and development vendors, and logistics and supply chain management providers. The extensive primary research was conducted to gather information, and verify and validate the critical numbers arrived at. Primary research was further conducted to identify the segmentation types; industry trends; key players; the competitive landscape of different market players; and key market dynamics, such as drivers, restraints, opportunities, challenges, industry trends, and key strategies. Following is the breakup of the primary respondents:
Market Size Estimation
Both top-down and bottom-up approaches were used to estimate and validate the overall size of the contactless payment market. These methods were used extensively to estimate the size of various subsegments in the market. The research methodology used to estimate the market size includes the following:
- Key players in the industry and markets have been identified through extensive secondary research.
- The contactless payments market expenditure across regions, along with the geographic split in various segments, have been considered to arrive at the overall market size.
- All percentage shares, splits, and breakups have been determined using secondary sources and verified through primary sources.
Data Triangulation
After arriving at the overall market size, using the market size estimation processes as explained above, the market was split into several segments and subsegments. To complete the overall market engineering process and arrive at the exact statistics of each market segment and subsegment, data triangulation and market breakup procedures were employed, wherever applicable. The data was triangulated by studying various factors and trends from both the demand side and supply side in the contactless payment market.
Report Objectives:
- To define, describe, and forecast the contactless payment market by component (hardware, solutions, and services), vertical, and region
- To provide detailed information about the major factors (drivers, restraints, opportunities, and industry-specific challenges) influencing the market growth
- To analyze the opportunities in the market and provide details about the competitive landscape for stakeholders and market leaders
- To forecast the market size of the market segments with respect to five main regions, namely, North America, Europe, Asia Pacific (APAC), Middle East and Africa (MEA), and Latin America
- To profile the key players and comprehensively analyze their market rankings and core competencies
- To analyze competitive developments, such as partnerships, new product launches, and mergers and acquisitions, in the contactless payment market
Company Information
- Detailed analysis and profiling of additional market players (up to 5)


Growth opportunities and latent adjacency in Contactless Payment Market
which is fastest growing region and what are their predictions still 2023?