Flotation Reagents Market by Type (Flocculants, Collectors, Frothers, Dispersants), Application (Explosives & Drilling, Mineral Processing, Water & wastewater treatment), Region (APAC, Europe, North America, MEA) - Global Forecast to 2023


[114 Pages Report] Flotation Reagents Market is projected to grow from USD 3.93 billion in 2017 to USD 5.55 billion by 2023, at a CAGR of 6.0% between 2018 and 2023. The flotation reagents market across the globe is driven by their increasing use in water & wastewater treatment, explosives & drilling, and mineral processing applications. The base year considered for the study is 2017 while the forecast period is between 2018 and 2023.
The main objective of this study is to define, describe, and forecast the flotation reagents market on the basis of type, application, and region. The report includes detailed information about the major factors such as drivers, restraints, challenges, and opportunities influencing the growth of the flotation reagents market. This report strategically analyzes different segments of the flotation reagents market with respect to the individual growth trends, future growth prospects, and their contribution to the overall market. Based on type, the flotation reagents market has been classified into flocculants, frothers, collectors, dispersants, and others. Based on application, the market has been classified into water & wastewater treatment, explosives & drilling, mineral processing, and others. The flotation reagents market in APAC, Europe, North America, the Middle East & Africa, and South America has been studied, and its size has been estimated, in terms of both, value and volume.
Both, the top-down and bottom-up approaches have been used to estimate and validate the size of the flotation reagents market and to estimate the size of various other dependent submarkets. Extensive secondary sources, directories, and databases such as Hoovers, Bloomberg, Chemical Weekly, Factiva, the Organization for the Economic Co-operation and Development (OECD), the World Bank, the Securities and Exchange Commission (SEC), and other government and private websites have been referred to identify and collect information useful for this technical, market-oriented, and commercial study of the flotation reagents market.
To know about the assumptions considered for the study, download the pdf brochure
Some of the major players operating in the flotation reagents market are BASF SE (Germany), Cytec Solvay Group (Belgium), Clariant AG (Switzerland), Kemira OYJ (Finland), Huntsman (US), Dow Chemical (US), AkzoNobel (Netherland), SNF FLOERGER SAS (France), Evonik (Switzerland), and Orica (Australia).
Key Target Audience:
- Manufacturers of flotation reagents
- Raw material suppliers
- Providers of technologies for manufacturing flotation reagents
- Traders, distributors, and suppliers of flotation reagents
- End-use industries
- Government and regional agencies and research organizations
- Investment and research firms
�The study answers several questions for the stakeholders, primarily which market segments to focus on in the next two to five years for prioritizing their efforts and investments.�
Scope of the Report:
This research report categorizes the flotation reagents market based on type, application, and region.
Flotation Reagents Market, by Type:
- Flocculants
- Frothers
- Collectors
- Dispersants
- Others (Grinding Aids, Solvent Extractors, Activators, and Promoters)
Flotation Reagents Market, by Application:
- Water & Wastewater Treatment
- Explosives & Drilling
- Mineral Processing
- Others (Leaching and Abrasive Blasting)
Flotation Reagents Market, by Region:
- APAC
- Europe
- North America
- Middle East & Africa
- South America
The market has been further analyzed for the key countries in each of these regions.
Available Customizations:
With the given market data, MarketsandMarkets offers customizations according to the specific requirements of companies. The following customization options are available for the report:
Application Analysis
- A product matrix, which gives a detailed analysis of various types of flotation reagents used in various applications.
Regional Analysis
- A further breakdown of the regional flotation reagents market to the country level
Company information
- Detailed analysis and profiling of additional market players (up to 5)
The flotation reagents market is projected to grow from USD 4.15 billion in 2018 to USD 5.55 billion by 2023, at a CAGR of 6.0% from 2018 to 2023.
The market has witnessed significant growth in the recent years, owing to the increasing investment in mining projects in APAC and South America. Rapid industrialization and urbanization in key countries such as China and India have spurred the demand for metals and minerals in the past few years.
Based on type, the flotation reagents market has been segmented into collectors, frothers, dispersants, flocculants, and others. The flocculants segment is expected to have the highest share in the flotation reagents market in 2018, in terms of value. The growth of this segment can be attributed to their increasing consumption in a variety of mines and mineral processing plants, ranging from coal to base and precious metals.
Based on application, the flotation reagents market has been segmented into explosives & drilling, mineral processing, water & wastewater treatment, and others. The water & wastewater treatment segment is projected to lead the flotation reagents market, in terms of value during the forecast period due to the increase in demand for freshwater and stringent environmental regulation.
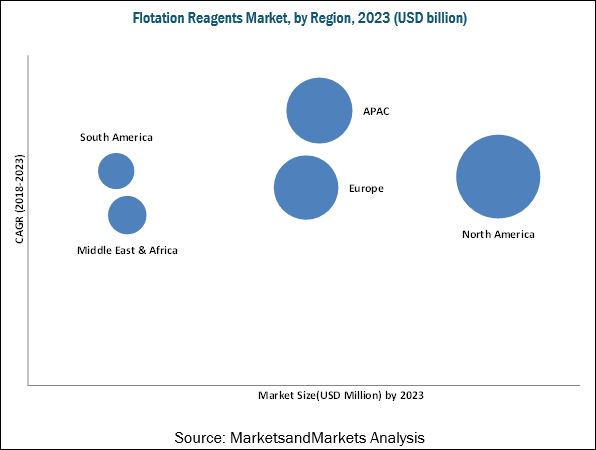
The flotation reagents market has been studied for North America, Europe, APAC, the Middle East & Africa, and South America. The APAC flotation reagents market is projected to register the highest CAGR, in terms of value, during the forecast period. The growth of the flotation reagents market in the region is primarily due to the rapid expansion of economies which is attracting huge investments from global mining companies, hence driving the market. The APAC region is witnessing high demand for flotation reagents, especially from China, Japan, India, and other Southeast Asian countries. Factors such as stringent regulations imposed by the government on wastewater treatment, and presence of vast mineral resources of copper, zinc, coal, and aluminum are contributing to the growth of the flotation reagents market in APAC.
The flotation reagents market is expected to witness significant growth during the forecast period. However, slow growth of the mining industry in developed economies is expected to hinder the growth of the market across the globe.
BASF SE (Germany), Cytec Solvay group (Belgium), Clariant AG (Switzerland), Kemira OYJ (Finland), Huntsman (US), Dow Chemical (US), AkzoNobel (Netherland), SNF FLOERGER SAS (France), Evonik (Switzerland), and Orica (Australia) are the key companies operating in the flotation reagents market.
To speak to our analyst for a discussion on the above findings, click Speak to Analyst
 Exclusive indicates content/data unique to MarketsandMarkets and not available with any competitors.
Table of Contents
1 Introduction (Page No. - 14)
1.1 Objectives of the Study
1.2 Market Definition
1.3 Market Scope
1.3.1 Regional Scope
1.3.2 Years Considered for the Study
1.4 Currency
1.5 Unit Considered
1.6 Stakeholders
2 Research Methodology (Page No. - 17)
2.1 Research Data
2.2 Secondary Data
2.2.1 Key Data From Secondary Sources
2.3 Primary Data
2.3.1 Key Data From Primary Sources
2.3.2 Key Industry Insights
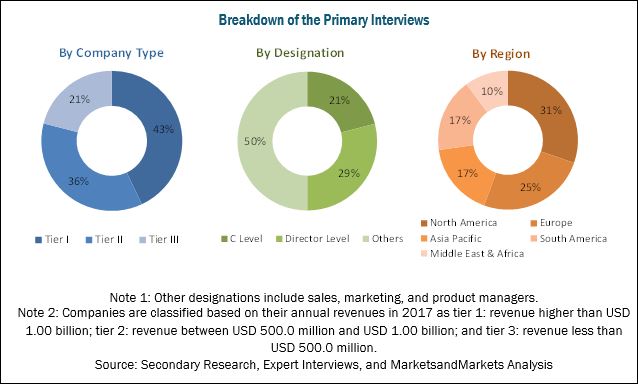
2.3.3 Breakdown of Primary Interviews
2.4 Market Size Estimation
2.5 Data Triangulation
2.6 Assumptions
2.7 Limitations
3 Executive Summary (Page No. - 25)
4 Premium Insights (Page No. - 28)
4.1 Attractive Opportunities in the Flotation Reagents Market
4.2 Flotation Reagents Market, By Region
4.3 Flotation Reagents Market, By Region and Application
4.4 Flotation Reagents Market, By Application
4.5 Flotation Reagents Market Attractiveness
5 Market Overview (Page No. - 31)
5.1 Introduction
5.2 Market Dynamics
5.2.1 Drivers
5.2.1.1 Increased Investments in Mining Industry in South America and APAC
5.2.1.2 Stringent Regulations and Mandates Concerning the Environment
5.2.2 Restraints
5.2.2.1 Slow Growth of the Mining Industry in Developed Economies
5.2.3 Opportunities
5.2.3.1 Growing Mining Industry in Eastern Europe and Africa
5.2.4 Challenges
5.2.4.1 Environmental Concerns Related to Mining Chemicals
5.3 Porter�s Five Forces Analysis
5.3.1 Threat of New Entrants
5.3.2 Threat of Substitutes
5.3.3 Bargaining Power of Suppliers
5.3.4 Bargaining Power of Buyers
5.3.5 Intensity of Competitive Rivalry
5.4 Macroeconomic Overview
5.4.1 Trends and Forecast of GDP
6 Flotation Reagents Market, By Type (Page No. - 38)
6.1 Introduction
6.2 Flocculants
6.3 Collectors
6.4 Frothers
6.5 Dispersants
6.6 Others
7 Flotation Reagents Market, By Application (Page No. - 42)
7.1 Introduction
7.2 Explosives & Drilling
7.3 Mineral Processing
7.4 Water & Wastewater Treatment
7.5 Others
8 Flotation Reagents Market, By Region (Page No. - 48)
8.1 Introduction
8.2 North America
8.2.1 US
8.2.2 Canada
8.2.3 Mexico
8.3 Europe
8.3.1 Germany
8.3.2 France
8.3.3 UK
8.3.4 Italy
8.3.5 Russia
8.3.6 Spain
8.3.7 Rest of Europe
8.4 APAC
8.4.1 China
8.4.2 Japan
8.4.3 India
8.4.4 South Korea
8.4.5 Indonesia
8.4.6 Australia & New Zealand
8.4.7 Rest of APAC
8.5 Middle East & Africa
8.5.1 Saudi Arabia
8.5.2 South Africa
8.5.3 UAE
8.5.4 Rest of the Middle East & Africa
8.6 South America
8.6.1 Brazil
8.6.2 Argentina
8.6.3 Rest of South America
9 Competitive Landscape (Page No. - 82)
9.1 Introduction
9.2 Market Ranking
9.3 Competitive Scenario
9.3.1 Agreements
9.3.2 Acquisitions
9.3.3 New Product Launches
10 Company Profiles (Page No. - 86)
Business Overview, Products Offered, Recent Developments, SWOT Analysis, MnM View
10.1 Huntsman
10.2 BASF SE
10.3 The DOW Chemical Company
10.4 Akzonobel
10.5 Clariant AG
10.6 Kemira OYJ
10.7 Cytec Solvay Group
10.8 Evonik Industries
10.9 Orica Limited
10.10 SNF Floerger SAS
*Details on (Business Overview, Products Offered, Recent Developments, SWOT Analysis, MnM View)
10.11 Other Key Players
10.11.1 Exxonmobil
10.11.2 Ecolab
10.11.3 IXOM
10.11.4 Nalco Company
10.11.5 CP Kelco
10.11.6 Solenis
10.11.7 Hychem, Inc.
10.11.8 Moly-Cop
10.11.9 Cochran Chemical Company Inc.
10.11.10 Nasaco International Ltd.
10.11.11 Shandong Shuiheng Chemical Co., Ltd
10.11.12 Yixing Bluwat Chemicals Co., Ltd.
11 Appendix (Page No. - 108)
11.1 Discussion Guide
11.2 Knowledge Store: Marketsandmarkets Subscription Portal
11.3 Available Customizations
11.4 Related Reports
11.5 Author Details
List of Tables (86 Tables)
Table 1 Real GDP Growth, By Key Countries, 2016�2022 (USD Billion)
Table 2 Flotation Reagents By Market Size, By Type, 2016�2023 (USD Million)
Table 3 Flotation Reagents By Market Size, By Type, 2016�2023 (Kiloton)
Table 4 Flotation Reagents By Market Size, By Application, 2016�2023 (USD Million)
Table 5 Flotation Reagents By Market Size, By Application, 2016�2023 (Kiloton)
Table 6 Flotation Reagents By Market Size in Explosives & Drilling Application, By Region, 2016�2023 (USD Million)
Table 7 Flotation Reagents By Market Size in Explosives & Drilling Application, By Region, 2016�2023 (Kiloton)
Table 8 Flotation Reagents By Market Size in Mineral Processing Application, By Region, 2016�2023 (USD Million)
Table 9 Flotation Reagents By Market Size in Mineral Processing Application, By Region, 2016�2023 (Kiloton)
Table 10 Flotation Reagents By Market Size in Water & Wastewater Treatment Application, By Region, 2016�2023 (USD Million)
Table 11 Flotation Reagents By Market Size in Water & Wastewater Treatment Application, By Region, 2016�2023 (Kiloton)
Table 12 Flotation Reagents By Market Size in Other Applications, By Region, 2016�2023 (USD Million)
Table 13 Flotation Reagents By Market Size in Other Applications, By Region, 2016�2023 (Kiloton)
Table 14 Flotation Reagents By Market Size, By Region, 2016�2023 (USD Million)
Table 15 Flotation Reagents By Market Size, By Region, 2016�2023 (Kiloton)
Table 16 North America: By Market Size, By Country, 2016�2023 (USD Million)
Table 17 North America: By Market Size, By Country, 2016�2023 (Kiloton)
Table 18 North America: By Market Size, By Application, 2016�2023 (USD Million)
Table 19 North America: By Market Size, By Application, 2016�2023 (Kiloton)
Table 20 US: By Market Size, By Application, 2016�2023 (USD Million)
Table 21 US: By Market Size, By Application, 2016�2023 (Kiloton)
Table 22 Canada: By Market Size, By Application, 2016�2023 (USD Million)
Table 23 Canada: By Market Size, By Application, 2016�2023 (Kiloton)
Table 24 Mexico: By Market Size, Application, 2016�2023 (USD Million)
Table 25 Mexico: By Market Size, Application, 2016�2023 (Kiloton)
Table 26 Europe: By Market Size, By Country, 2016�2023 (USD Million)
Table 27 Europe: By Market Size, By Country, 2016�2023 (Kiloton)
Table 28 Europe: By Market Size, By Application, 2016�2023 (USD Million)
Table 29 Europe: By Market Size, By Application, 2016�2023 (Kiloton)
Table 30 Germany: By Market Size, By Application, 2016�2023 (USD Million)
Table 31 Germany: By Market Size, By Application, 2016�2023 (Kiloton)
Table 32 France: By Market Size, By Application, 2016�2023 (USD Million)
Table 33 France: By Market Size, By Application, 2016�2023 (Kiloton)
Table 34 UK: By Market Size, By Application, 2016�2023 (USD Million)
Table 35 UK: By Market Size, By Application, 2016�2023 (Kiloton)
Table 36 Italy: By Market Size, By Application, 2016�2023 (USD Million)
Table 37 Italy: By Market Size, By Application, 2016�2023 (Kiloton)
Table 38 Russia: By Market Size, By Application, 2016�2023 (USD Million)
Table 39 Russia: By Market Size, By Application, 2016�2023 (Kiloton)
Table 40 Spain: By Market Size, By Application, 2016�2023 (USD Million)
Table 41 Spain: By Market Size, By Application, 2016�2023 (Kiloton)
Table 42 Rest of Europe: By Market Size, By Application, 2016�2023 (USD Million)
Table 43 Rest of Europe: By Market Size, By Application, 2016�2023 (Kiloton)
Table 44 APAC: By Market Size, By Country, 2016�2023 (USD Million)
Table 45 APAC: By Market Size, By Country, 2016�2023 (Kiloton)
Table 46 APAC: By Market Size, By Application, 2016�2023 (USD Million)
Table 47 APAC: By Market Size, By Application, 2016�2023 (Kiloton)
Table 48 China: By Market Size, By Application, 2016�2023 (USD Million)
Table 49 China: By Market Size, By Application, 2016�2023 (Kiloton)
Table 50 Japan: By Market Size, By Application, 2016�2023 (USD Million)
Table 51 Japan: By Market Size, By Application, 2016�2023 (Kiloton)
Table 52 India: By Market Size, By Application, 2016�2023 (USD Million)
Table 53 India: By Market Size, By Application, 2016�2023 (Kiloton)
Table 54 South Korea: By Market Size, By Application, 2016�2023 (USD Million)
Table 55 South Korea: By Market Size, By Application, 2016�2023 (Kiloton)
Table 56 Indonesia: By Market Size, By Application, 2016�2023 (USD Million)
Table 57 Indonesia: By Market Size, By Application, 2016�2023 (Kiloton)
Table 58 Australia & New Zealand: By Market Size, By Application, 2016�2023 (USD Million)
Table 59 Australia & New Zealand: By Market Size, By Application, 2016�2023 (Kiloton)
Table 60 Rest of APAC: By Market Size, By Application, 2016�2023 (USD Million)
Table 61 Rest of APAC: By Market Size, By Application, 2016�2023 (Kiloton)
Table 62 Middle East & Africa: By Market Size, By Country, 2016�2023 (USD Million)
Table 63 Middle East & Africa: By Market Size, By Country, 2016�2023 (Kiloton)
Table 64 Middle East & Africa: By Market Size, By Application, 2016�2023 (USD Million)
Table 65 Middle East & Africa: By Market Size, By Application, 2016�2023 (Kiloton)
Table 66 Saudi Arabia: By Market Size, By Application, 2016�2023 (USD Million)
Table 67 Saudi Arabia: By Market Size, By Application, 2016�2023 (Kiloton)
Table 68 South Africa: By Market Size, By Application, 2016�2023 (USD Million)
Table 69 South Africa: By Market Size, By Application, 2016�2023 (Kiloton)
Table 70 UAE: By Market Size, By Application, 2016�2023 (USD Million)
Table 71 UAE: By Market Size, By Application, 2016�2023 (Kiloton)
Table 72 Rest of the Middle East & Africa: By Market Size, By Application, 2016�2023 (USD Million)
Table 73 Rest of the Middle East & Africa: By Market Size, By Application, 2016�2023 (Kiloton)
Table 74 South America: By Market Size, By Country, 2016�2023 (USD Million)
Table 75 South America: By Market Size, By Country, 2016�2023 (Kiloton)
Table 76 South America: By Market Size, By Application, 2016�2023 (USD Million)
Table 77 South America: By Market Size, By Application, 2016�2023 (Kiloton)
Table 78 Brazil: By Market Size, By Application, 2016�2023 (USD Million)
Table 79 Brazil: By Market Size, By Application, 2016�2023 (Kiloton)
Table 80 Argentina: By Market Size, By Application, 2016�2023 (USD Million)
Table 81 Argentina: By Market Size, By Application, 2016�2023 (Kiloton)
Table 82 Rest of South America: By Market Size, By Application, 2016�2023 (USD Million)
Table 83 Rest of South America: By Market Size, By Application, 2016�2023 (Kiloton)
Table 84 Agreements, 2015�2018
Table 85 Acquisitions, 2015�2018
Table 86 New Product Launches, 2015�2018
List of Figures (37 Figures)
Figure 1 Flotation Reagents Market Segmentation
Figure 2 Flotation Reagents Market, By Region
Figure 3 Flotation Reagents Market: Research Design
Figure 4 Market Size Estimation: Bottom-Up Approach
Figure 5 Market Size Estimation: Top-Down Approach
Figure 6 Flotation Reagents Market: Data Triangulation
Figure 7 Flocculants to Lead the Flotation Reagents Market
Figure 8 Water & Wastewater Treatment to Be the Largest Application of Flotation Reagents
Figure 9 APAC to Be Fastest-Growing Flotation Reagents Market
Figure 10 Flotation Reagents Market to Witness Rapid Growth Between 2018 and 2023
Figure 11 APAC to Be the Fastest-Growing Flotation Reagents Market
Figure 12 Water & Wastewater Application Segment Accounted for the Largest Share in 2017
Figure 13 Flocculants Segment to Account for the Largest Market Share
Figure 14 India to Be Fastest-Growing Market Between 2018 and 2023
Figure 15 Overview of Factors Governing the Flotation Reagents Market
Figure 16 Porter�s Five Forces Analysis of the Flotation Reagents Market
Figure 17 Flocculants to Be the Largest Type of Flotation Reagents
Figure 18 Water & Wastewater Treatment Segment to Dominate the Flotation Reagents Market
Figure 19 Flotation Reagents Market in China to Register the Highest CAGR
Figure 20 North America: Flotation Reagents Market Snapshot
Figure 21 APAC: Flotation Reagents Market Snapshot
Figure 22 Companies Adopted New Product Launch as the Key Growth Strategy Between 2015 and 2018
Figure 23 BASF SE Lead the Flotation Reagents Market in 2017
Figure 24 Huntsman: Company Snapshot
Figure 25 Huntsman: SWOT Analysis
Figure 26 BASF SE: Company Snapshot
Figure 27 BASF SE: SWOT Analysis
Figure 28 The DOW Chemical Company: Company Snapshot
Figure 29 The DOW Chemical Company: SWOT Analysis
Figure 30 Akzonobel: Company Snapshot
Figure 31 Akzonobel: SWOT Analysis
Figure 32 Clariant AG: Company Snapshot
Figure 33 Clariant AG: SWOT Analysis
Figure 34 Kemira OYJ: Company Snapshot
Figure 35 Cytec Solvay Group: Company Snapshot
Figure 36 Evonik Industries: Company Snapshot
Figure 37 Orica Limited: Company Snapshot


Growth opportunities and latent adjacency in Flotation Reagents Market