Focused Ion Beam Market

Focused Ion Beam Market by Ion Source (Ga+ Liquid Metal, Plasma, Gas Field), Application (Failure Analysis, Nanofabrication, Device Modification, Circuit Edit, Counterfeit Detection), Vertical and Region - Global Forecast to 2028

Report Code: SE 7422 Dec, 2022, by marketsandmarkets.com

Updated on : October 19 , 2023

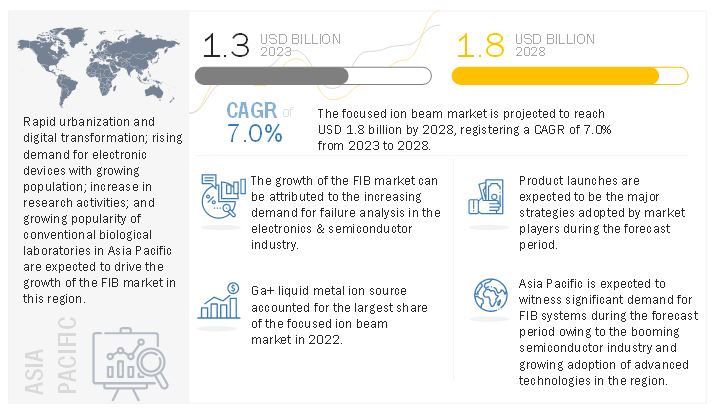
The global focused ion beam market is projected to reach USD 1.8 billion by 2028 from an estimated USD 1.3 billion in 2023, at a CAGR of 7.0% from 2023 to 2028.

The growth of the focused ion beam market can be attributed to initiatives of US government to strengthen semiconductor manufacturing, adoption of FIB systems by research laboratories and manufacturing firms worldwide, and deployment of focused ion beam industry for applications in material science industry.
Focused Ion Beam Market

Focused Ion Beam Market Forecast to 2028

To know about the assumptions considered for the study, Request for Free Sample Report

Market Dynamics of Focused Ion Beam Market

Drivers: Deployment of focused ion beam systems for applications in material science industry

Characterization and testing of materials are important prior to their use on a large scale. Appropriate testing of materials increases their flexibility and durability. Material science deals with discovering and developing new materials and methods for their study. It is a multidisciplinary science that involves different fields, such as physics, chemistry, and engineering. It focuses on analyzing materials' chemical, electrical, mechanical, magnetic, optical, and thermal characteristics. The field can be divided into biomaterials, electronic and photonic materials, nanomaterials, organic materials, structural and composite materials, and smart materials. Exponential growth has been observed in research activities related to material science across the globe. Research activities require sophisticated analytical tools to analyze and understand new materials with prominent physical properties. This leads to an increased demand for FIB systems that offer analytical and patterning capabilities in a single instrument.

FIB systems can prepare site-specific cross-sections stress-freely, irrespective of the materials used. Ga+ ion beam source is used for imaging conductive and other raw materials in the material science vertical. Sections of material samples prepared by FIB systems are remarkable as they help identify and determine defects. They are also used to cut various materials, including silicon, indium phosphide, gallium arsenide, and metal, without distorting them. These systems are used for sectioning materials in sizes ranging from a few tens of atoms to a few tens of microns. FIB systems are used for the preparation of TEM cross-section lamellae and the production of solid-state nanopores. These systems are also used in thin films and devices for 3D visualization. They also find applications in next-generation memory solutions and processors. These systems are to carry out the microanalysis of cell morphology and biotechnology, nanoscale machining, and metallurgy. FIB systems can remove or add atoms to raw materials with submicron precision. As a result, it is hard to replace FIB systems in failure analysis and masking and (IC) repairing applications.

Material science researchers are making efforts to develop new and strong materials based on the materials that occur naturally. For instance, Nacre, the iridescent and super-strong material, also known as the mother-of-pearl, is sectioned using FIB systems to study it through SEM to develop strong materials based on its properties for the Institute of Soldier Nanotechnologies.

Restraints: Requirement for highly skilled workforce to operate advanced FIB systems

Analysis of devices and recommendations for improving them involves using multiple techniques, equipment, and technical expertise. For instance, skilled engineers must perform the failure analysis of faulty chips by decapsulating and analyzing them to segregate and identify the reason for their fault. Moreover, they should be capable of encapsulating chips into their package for smooth functioning. Different companies are developing new technologies to gain an edge over their competitors and strengthen their market position. For instance, in 2014, US-based IONpath, Inc. developed multiplexed ion beam imaging (MIBI) technology for FIB systems to examine small cellular structures and intact tissue tumor microenvironments and carry out different biological analyses simultaneously to use a single slide.

Moreover, zerok NanoTech developed low-temperature ion source (LoTIS) technology for FIB-based circuit edit applications. As FIB technology is evolving day by day, there is a requirement for a highly skilled workforce to adapt to these latest advancements in this technology. The highly skilled workforce is essential to operate new and advanced FIB systems and gathering accurate data by analyzing samples. Moreover, it should also be able to handle the operational complexity of FIB systems that requires technical expertise and knowledge.

Opportunities: Rising use of FIB systems to study biological samples and biomaterials

Initially, FIB systems were restricted to the electronics & semiconductor and the material sciences verticals. Presently, they are evolving as powerful tools for the ultrastructural and nanoscale cellular imaging of biological samples and biomaterials (materials that associate immediately with the living tissues without causing any adverse immune rejection reaction). Earlier, confocal light microscopy, in combination with the traditional fluorescent labeling technique, was used by biologists and life scientists for a detailed study of the biological structures of tissues and cells. However, with the advent of FIB systems, they are being preferred over traditional techniques as it is easy to obtain information from these systems at small scales. FIB systems can be coupled with complementary cryogenic, dual-beam SEM, environmental SEM, and energy-dispersive X-ray spectroscopy (EDX) tools to analyze biomaterials and cells and their interfaces for TEM sample preparation by imaging them.

Moreover, FIB systems are used as sculpting tools, such as lamellae and needles, to create specimen shapes that can be analyzed further by TEM. The FIB cross-sectioning technique helps extract damageable biological specimens of human hair and housefly eyes. Thus, the increasing use of FIB systems to study and analyze biological samples and biomaterials is expected to act as a growth opportunity for the focused ion beam market during the forecast period.

Challenges: 3D reconstruction of porous materials

Data processing for the 3D reconstruction of porous materials is the most challenging aspect of FIB-SEM tomography. FIB-SEM tomography generates 3D images of materials by acquiring and visualizing their different sections. The serial sectioning tomography technique of FIB-SEM systems creates 3D data with nanoscale resolution. 3D acquisitions of porous materials are necessary to determine the mesopores (pores smaller than 2nm in diameter) and macropores (pores larger than 50nm in diameter) and distinguish interactions between them. This information is necessary to know the transport properties and formation mechanisms of materials, which are subject to textural analysis. For instance, in the oil & gas industry, the analysis of the transport properties of fine-grained sediments is essential to enable the recovery of reservoir rocks.

Treating or processing data related to porous materials is difficult due to their unknown porosity and pore size distribution. As a result, it is difficult for FIB systems to evaluate the accuracy of the segmentation procedure of the internal microstructure of porous materials. As there is no fixed segmentation procedure, the effect of different segmentation procedures is expected to impact the ?nal results directly. Moreover, the final result is dependent on the operators of FIB systems.

Focused Ion Beam Ecosystem
Focused Ion Beam Market Size, and Ecosystem

The Ga+ liquid metal ion source is projected to register the highest CAGR 2023 to 2028

The Ga+ liquid metal ion source is projected to register the highest CAGR 2023 to 2028. The growth can be attributed to rising use of Ga+ liquid metal FIB systems in the electronics & semiconductor vertical for failure analysis, TEM sample preparation, IC repair and modification, nanofabrication, and ion microscopy applications. In addition, most of the commercial FIB systems used globally are designed using Ga+ liquid metal as an ion source, owing to the small emission area requirements, which enable the use of small-diameter beams that offer brightness as high as 106 A/cm-sr (square radian) and current density ranging between 2 and 10 A/cm2.

Failure analysis segment is projected to register the highest CAGR during the forecast period

The failure analysis segment is projected to grow at the highest CAGR during the forecast period. The growth of the segment can be attributed to an increase in the adoption of FIB systems to perform failure analysis for submicron level etching, site-specific cross sections, advanced microscopy, circuit rewiring and debugging, and vapor deposition processes.

Asia Pacific is expected to register the highest growth in the focused ion beam market during the forecast period

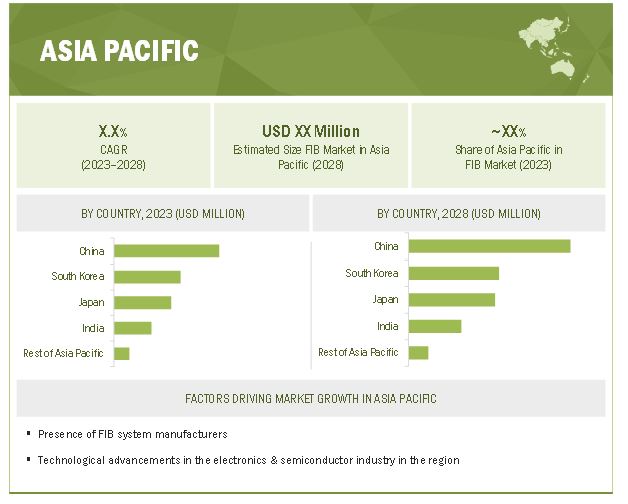
The market in Asia Pacific is expected to grow significantly during the forecast period. The major factor contributing to the growth of the focused ion beam market in APAC can be attributed to the increasing adoption of robotics and automation in the electronics & semiconductor manufacturing industry. With the rising adoption of robots, the demand for ICs and other electronic devices is also increasing. Thus, companies manufacturing electronic devices and ICs require FIB systems for material and failure analyses. This, in turn, is spurring the growth of the electronics & semiconductor segment of the focused ion beam market. In addition, countries such as China and Japan also have huge growth potential for the focused ion beam market.
Focused Ion Beam Market Size, and Share

To know about the assumptions considered for the study, download the pdf brochure

Key Market Players

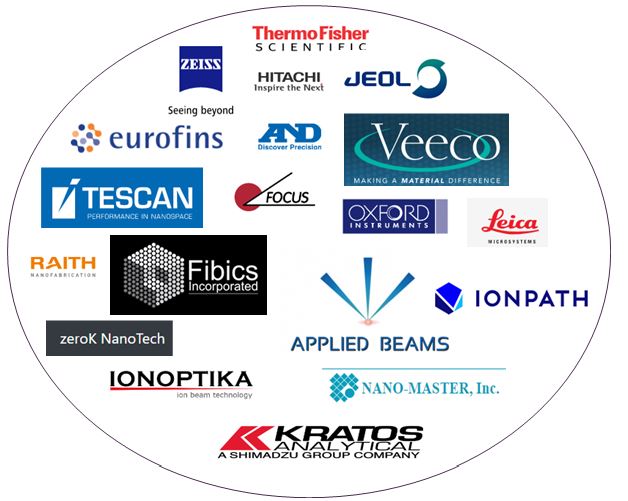
Thermo Fisher Scientific Inc. (US); ZEISS International (Germany); Hitachi, Ltd. (Japan); JEOL Ltd. (Japan); TESCAN ORSAY HOLDING, a.s. (Czech Republic); Eurofins Scientific (Luxembourg); A&D Company, Limited (Japan); Veeco Instruments Inc. (US); Raith GmbH (Germany); and FOCUS GmbH (Germany); are some of the key players in the focused ion beam companies.

Get online access to the report on the World's First Market Intelligence Cloud

  • Easy to Download Historical Data & Forecast Numbers
  • Company Analysis Dashboard for high growth potential opportunities
  • Research Analyst Access for customization & queries
  • Competitor Analysis with Interactive dashboard
  • Latest News, Updates & Trend analysis
Request Sample

Scope of the Report

Report Metric

Details

  Estimated Market Size USD 1.3 billion in 2023
  Projected Market Size USD 1.8 billion by 2028
  Growth Rate CAGR of 7.0%

  Market size available for years

2018–2028

  Base year considered

2022

  Forecast period

2023–2028

  Forecast unit

Value (USD Million/Thousand)

  Segments Covered

By Ion Source, By Application, By Vertical, and By Region

  Geographies covered

North America, Europe, Asia Pacific, and RoW

Companies covered

Thermo Fisher Scientific Inc. (US); ZEISS International (Germany); Hitachi, Ltd. (Japan); JEOL Ltd. (Japan); TESCAN ORSAY HOLDING, a.s. (Czech Republic); Eurofins Scientific (Luxembourg); A&D Company, Limited (Japan); Veeco Instruments Inc. (US); Raith GmbH (Germany); and FOCUS GmbH (Germany); are some of the key players in the focused ion beam market.
A total of 20 players are covered.

Focused Ion Beam Market Highlights

This research report categorizes the focused ion beam market based ion source, application, vertical, and region.

Aspect

Details

Based on Ion Source

  • Ga+ Liquid Metal
  • Gas Field
  • Plasma

Based on Application 

  • Failure Analysis
  • Nanofabrication
  • Device Modification
  • Circuit Edit
  • Counterfeit Detection

Based on Vertical 

  • Electronics & Semiconductor
    • Semiconductor Manufacturing
    • Mems and Thin-Film Production
  • Industrial Science
    • Oil & Gas
    • Automotive & Aerospace
    • Chemicals
    • Power Generation
  • Bioscience
    • Cellular Biology
    • Structural Biology
    • Biomedical Engineering
    • Neuroscience
  • Material Science
    • Metals & Mining
    • Paper & Fiber Materials
    • Ceramic & Glass
    • Polymers

Based on Region

  • North America
    • US
    • Canada
    • Mexico
  • Europe
    • Germany
    • UK
    • France
    • Rest of Europe
  • Aisa Pacific
    • China
    • Japan
    • India
    • South Korea
    • Rest of Asia Pacific
  • Rest of the world
    • Middle East & Africa
    • South Americ

Recent Developments

  • In August 2022, Thermo Fisher Scientific Inc. launched the Thermo Scientific Arctis Cryo-Plasma Focused Ion Beam (Cryo-PFIB), a new connected and automated microscope designed to advance the pace of cryo-electron tomography (cryo-ET) research.
  • In July 2022, TESCAN ORSAY HOLDING a.s. supplied the AMBER X focused ion beam-scanning electron microscope (FIB-SEM) to the Institute for Factory Automation and Production Systems (FAPS) in Germany. FAPS will use the FIB-SEM for silver printing and copper coating analysis to improve mechatronic systems, battery components, and additive manufacturing.
  • In June 2021, MIT.nano acquired a Raith VELION focused ion beam scanning electron microscope (FIB-SEM) as a demonstration unit in its characterization facility. The VELION will augment the MIT.nano fabrication and characterization tool sets and enable next-generation nanofabrication by allowing users to fabricate two- and three-dimensional nanostructures with high resolution over large areas.
  • In May 2021, Thermo Fisher Scientific Inc. launched the Thermo Scientific iFLM Correlative System, the integrated fluorescence light microscope and a value-added component for the Thermo Scientific Aquilos 2 Cryo-FIB. This enhancement enables cell biologists to streamline their sample preparation process for cellular cryo-ET.
  • In February 2021, TESCAN ORSAY HOLDING a.s. launched a nanomanipulator for TESCAN SEM and FIB-SEM instruments. TESCAN Nanomanipulator supports TEM sample lift-out and micro- and nanoscale manipulation under room temperature and cryo conditions.

Frequently Asked Questions (FAQ):

To speak to our analyst for a discussion on the above findings, click Speak to Analyst

TABLE OF CONTENTS
 
1 INTRODUCTION (Page No. - 33)
    1.1 STUDY OBJECTIVES 
    1.2 MARKET DEFINITION 
           1.2.1 INCLUSIONS AND EXCLUSIONS
    1.3 STUDY SCOPE 
           1.3.1 MARKETS COVERED
           1.3.2 GEOGRAPHIC SCOPE
           1.3.3 YEARS CONSIDERED
    1.4 CURRENCY CONSIDERED 
    1.5 UNIT CONSIDERED 
    1.6 MARKET STAKEHOLDERS 
 
2 RESEARCH METHODOLOGY (Page No. - 37)
    2.1 RESEARCH DATA 
           FIGURE 1 FOCUSED ION BEAM MARKET: RESEARCH DESIGN
           2.1.1 SECONDARY AND PRIMARY RESEARCH
           2.1.2 SECONDARY DATA
                    2.1.2.1 Secondary sources
           2.1.3 PRIMARY DATA
                    2.1.3.1 Primary interviews with experts
                    2.1.3.2 Breakdown of primaries
                    2.1.3.3 Key data from primary sources
                    2.1.3.4 Key industry insights
    2.2 FACTOR ANALYSIS 
           FIGURE 2 MARKET SIZE ESTIMATION METHODOLOGY: APPROACH 1 – TOP-DOWN (SUPPLY SIDE): REVENUES GENERATED BY COMPANIES FROM SALES OF FIB SYSTEMS
           FIGURE 3 MARKET SIZE ESTIMATION METHODOLOGY: APPROACH 1 – TOP-DOWN (SUPPLY SIDE): ILLUSTRATION OF REVENUE ESTIMATION FOR ONE COMPANY IN FOCUSED ION BEAN MARKET
           FIGURE 4 MARKET SIZE ESTIMATION METHODOLOGY: APPROACH 2 – BOTTOM-UP (DEMAND SIDE): DEMAND FOR FIB SYSTEMS, BY VERTICAL
    2.3 MARKET SIZE ESTIMATION 
           2.3.1 BOTTOM-UP APPROACH
                    2.3.1.1 Approach to obtain market size through bottom-up analysis (demand side)
                               FIGURE 5 MARKET SIZE ESTIMATION METHODOLOGY: BOTTOM-UP APPROACH
           2.3.2 TOP-DOWN APPROACH
                    2.3.2.1 Approach to obtain market size through top-down analysis (supply side)
                               FIGURE 6 MARKET SIZE ESTIMATION METHODOLOGY: TOP-DOWN APPROACH
           2.3.3 GROWTH PROJECTIONS AND FORECASTING ASSUMPTIONS
                    TABLE 1 MARKET GROWTH ASSUMPTIONS
    2.4 MARKET BREAKDOWN AND DATA TRIANGULATION 
           FIGURE 7 DATA TRIANGULATION
    2.5 RESEARCH ASSUMPTIONS AND LIMITATIONS 
           2.5.1 RESEARCH ASSUMPTIONS
           2.5.2 RESEARCH LIMITATIONS
    2.6 RISK ASSESSMENT 
 
3 EXECUTIVE SUMMARY (Page No. - 51)
    FIGURE 8 GA+ LIQUID METAL ION SOURCE TO REGISTER HIGHEST CAGR IN FOCUSED ION BEAM MARKET FROM 2023 TO 2028
    FIGURE 9 BIOSCIENCE TO EXHIBIT HIGHEST CAGR IN MARKET, BY VERTICAL, FROM 2023 TO 2028
    FIGURE 10 FAILURE ANALYSIS APPLICATION TO RECORD HIGHEST CAGR IN MARKET FROM 2023 TO 2028
    FIGURE 11 MARKET IN ASIA PACIFIC TO GROW AT HIGHEST CAGR FROM 2023 TO 2028
 
4 PREMIUM INSIGHTS (Page No. - 55)
    4.1 ATTRACTIVE GROWTH OPPORTUNITIES FOR PLAYERS IN MARKET 
           FIGURE 12 THRIVING ELECTRONICS & SEMICONDUCTOR INDUSTRY TO SPUR GROWTH OF MARKET FROM 2023 TO 2028
    4.2 FOCUSED ION BEAM MARKET, BY ION SOURCE 
           FIGURE 13 GA+ LIQUID METAL ION SOURCE TO HOLD LARGEST SHARE OF MARKET IN 2028
    4.3 MARKET, BY APPLICATION 
           FIGURE 14 FAILURE ANALYSIS TO BE FASTEST-GROWING APPLICATION IN MARKET DURING FORECAST PERIOD
    4.4 MARKET, BY VERTICAL 
           FIGURE 15 ELECTRONICS & SEMICONDUCTOR VERTICAL TO DOMINATE MARKET IN 2028
    4.5 MARKET, BY REGION 
           FIGURE 16 NORTH AMERICA TO CAPTURE LARGEST SHARE OF MARKET IN 2028
    4.6 MARKET, BY COUNTRY 
           FIGURE 17 CHINA TO REGISTER HIGHEST CAGR IN GLOBAL MARKET DURING FORECAST PERIOD
 
5 MARKET OVERVIEW (Page No. - 58)
    5.1 INTRODUCTION 
           FIGURE 18 FOCUSED ION BEAM MARKET: DRIVERS, RESTRAINTS, OPPORTUNITIES, AND CHALLENGES
           5.1.1 DRIVERS
                    5.1.1.1 Initiatives of US government to strengthen semiconductor manufacturing
                    5.1.1.2 Use of FIB systems in electronics & semiconductor industry for failure analysis applications
                    5.1.1.3 Adoption of FIB systems by research laboratories and manufacturing firms worldwide
                    5.1.1.4 Requirement for ion beam lithography technology-integrated FIB systems
                    5.1.1.5 Deployment of FIB systems for applications in material science industry
                               FIGURE 19 DRIVERS AND THEIR IMPACT ON FOCUSED ION BEAM MARKET
           5.1.2 RESTRAINTS
                    5.1.2.1 High costs of FIB systems
                    5.1.2.2 Requirement for highly skilled workforce to operate advanced FIB systems
                               FIGURE 20 RESTRAINTS AND THEIR IMPACT ON MARKET
           5.1.3 OPPORTUNITIES
                    5.1.3.1 Ongoing research to prepare damage-free TEM specimens using plasma ion source
                    5.1.3.2 Rising use of FIB systems to study biological samples and biomaterials
                    5.1.3.3 Increasing adoption of automation and robotics in electronic & electrical device manufacturing industry in Asia Pacific
                               FIGURE 21 NUMBER OF INDUSTRIAL ROBOTS INSTALLED IN CHINA, 2011–2021 (THOUSAND UNITS)
                               FIGURE 22 OPPORTUNITIES AND THEIR IMPACT ON MARKET
           5.1.4 CHALLENGES
                    5.1.4.1 Gaps in processing time, quality assurance, and planning time for fabrication of components on substrates
                    5.1.4.2 3D reconstruction of porous materials
                               FIGURE 23 CHALLENGES AND THEIR IMPACT ON MARKET
    5.2 VALUE CHAIN ANALYSIS 
           FIGURE 24 FOCUSED ION BEAM MARKET: VALUE CHAIN ANALYSIS
    5.3 LIST OF UNIVERSITIES OFFERING FIB SERVICES TO DIFFERENT VERTICALS 
           TABLE 2 UNIVERSITIES OFFERING FIB SERVICES
 
6 FOCUSED ION BEAM MARKET, BY ION SOURCE (Page No. - 73)
    6.1 INTRODUCTION 
           FIGURE 25 MARKET, BY ION SOURCE
           TABLE 3 MARKET, BY ION SOURCE, 2018–2022 (USD MILLION)
           FIGURE 26 GA+ LIQUID METAL ION SOURCE TO DOMINATE MARKET FROM 2023 TO 2028
           TABLE 4 MARKET, BY ION SOURCE, 2023–2028 (USD MILLION)
           TABLE 5 MARKET, 2018–2022 (UNITS)
           TABLE 6 MARKET, 2023–2028 (UNITS)
    6.2 GA+ LIQUID METAL 
           6.2.1 RISING ADOPTION OF GA+ LIQUID METAL FOCUSED ION BEAM SYSTEMS IN NANO- AND MICRO-MACHINING APPLICATIONS
                    TABLE 7 GA+ LIQUID METAL: FOCUSED ION BEAM MARKET, BY APPLICATION, 2018–2022 (USD MILLION)
                    TABLE 8 GA+ LIQUID METAL: MARKET, BY APPLICATION, 2023–2028 (USD MILLION)
                    TABLE 9 GA+ LIQUID METAL: MARKET, BY VERTICAL, 2018–2022 (USD MILLION)
                    FIGURE 27 BIOSCIENCE VERTICAL TO EXHIBIT HIGHEST CAGR IN GA+ LIQUID METAL MARKET DURING FORECAST PERIOD
                    TABLE 10 GA+ LIQUID METAL: MARKET, BY VERTICAL, 2023–2028 (USD MILLION)
                    TABLE 11 GA+ LIQUID METAL: MARKET, BY REGION, 2018–2022 (USD MILLION)
                    TABLE 12 GA+ LIQUID METAL: MARKET, BY REGION, 2023–2028 (USD MILLION)
                    TABLE 13 GA+ LIQUID METAL: MARKET FOR ELECTRONICS & SEMICONDUCTOR, BY REGION, 2018–2022 (USD MILLION)
                    TABLE 14 GA+ LIQUID METAL: MARKET FOR ELECTRONICS & SEMICONDUCTOR, BY REGION, 2023–2028 (USD MILLION)
                    TABLE 15 GA+ LIQUID METAL: MARKET FOR MATERIAL SCIENCE, BY REGION, 2018–2022 (USD MILLION)
                    TABLE 16 GA+ LIQUID METAL: FOCUSED ION BEAM MARKET FOR MATERIAL SCIENCE, BY REGION, 2023–2028 (USD MILLION)
                    TABLE 17 GA+ LIQUID METAL: MARKET FOR BIOSCIENCE, BY REGION, 2018–2022 (USD MILLION)
                    TABLE 18 GA+ LIQUID METAL: MARKET FOR BIOSCIENCE, BY REGION, 2023–2028 (USD MILLION)
                    TABLE 19 GA+ LIQUID METAL: MARKET FOR INDUSTRIAL SCIENCE, BY REGION, 2018–2022 (USD MILLION)
                    TABLE 20 GA+ LIQUID METAL: MARKET FOR INDUSTRIAL SCIENCE, BY REGION, 2023–2028 (USD MILLION)
    6.3 GAS FIELD 
           6.3.1 INCREASING USE OF GAS-FIELD FOCUSED ION BEAM SYSTEMS IN CIRCUIT EDIT AND DEVICE MODIFICATION APPLICATIONS
                    TABLE 21 GAS FIELD: FOCUSED ION BEAM MARKET, BY APPLICATION, 2018–2022 (USD THOUSAND)
                    TABLE 22 GAS FIELD: MARKET, BY APPLICATION, 2023–2028 (USD THOUSAND)
                    TABLE 23 GAS FIELD: MARKET, BY VERTICAL, 2018–2022 (USD THOUSAND)
                    TABLE 24 GAS FIELD: MARKET, BY VERTICAL, 2023–2028 (USD THOUSAND)
                    TABLE 25 GAS FIELD: MARKET, BY REGION, 2018–2022 (USD THOUSAND)
                    TABLE 26 GAS FIELD: MARKET, BY REGION, 2023–2028 (USD THOUSAND)
                    TABLE 27 GAS FIELD: MARKET FOR ELECTRONICS & SEMICONDUCTOR, BY REGION, 2018–2022 (USD THOUSAND)
                    TABLE 28 GAS FIELD: MARKET FOR ELECTRONICS & SEMICONDUCTOR, BY REGION, 2023–2028 (USD THOUSAND)
                    TABLE 29 GAS FIELD: MARKET FOR MATERIAL SCIENCE, BY REGION, 2018–2022 (USD THOUSAND)
                    TABLE 30 GAS FIELD: MARKET FOR MATERIAL SCIENCE, BY REGION, 2023–2028 (USD THOUSAND)
                    TABLE 31 GAS FIELD: MARKET FOR BIOSCIENCE, BY REGION, 2018–2022 (USD THOUSAND)
                    TABLE 32 GAS FIELD: MARKET FOR BIOSCIENCE, BY REGION, 2023–2028 (USD THOUSAND)
                    TABLE 33 GAS FIELD: MARKET FOR INDUSTRIAL SCIENCE, BY REGION, 2018–2022 (USD THOUSAND)
                    TABLE 34 GAS FIELD: MARKET FOR INDUSTRIAL SCIENCE, BY REGION, 2023–2028 (USD THOUSAND)
    6.4 PLASMA 
           6.4.1 INCREASING DEMAND FOR PLASMA FIB SYSTEMS IN INLINE METROLOGY, DEFECT REVIEW, AND PHOTOMASK REPAIR APPLICATIONS
                    TABLE 35 PLASMA: FOCUSED ION BEAM MARKET, BY APPLICATION, 2018–2022 (USD MILLION)
                    FIGURE 28 FAILURE ANALYSIS APPLICATION TO LEAD PLASMA MARKET FROM 2023 TO 2028
                    TABLE 36 PLASMA: MARKET, BY APPLICATION, 2023–2028 (USD MILLION)
                    TABLE 37 PLASMA: MARKET, BY VERTICAL, 2018–2022 (USD MILLION)
                    TABLE 38 PLASMA: MARKET, BY VERTICAL, 2023–2028 (USD MILLION)
                    TABLE 39 PLASMA: MARKET, BY REGION, 2018–2022 (USD MILLION)
                    TABLE 40 PLASMA: MARKET, BY REGION, 2023–2028 (USD MILLION)
                    TABLE 41 PLASMA: FOCUSED ION BEAM MARKET FOR ELECTRONICS & SEMICONDUCTOR, BY REGION, 2018–2022 (USD MILLION)
                    TABLE 42 PLASMA: MARKET FOR ELECTRONICS & SEMICONDUCTOR, BY REGION, 2023–2028 (USD MILLION)
                    TABLE 43 PLASMA: MARKET FOR MATERIAL SCIENCE, BY REGION, 2018–2022 (USD THOUSAND)
                    TABLE 44 PLASMA: MARKET FOR MATERIAL SCIENCE, BY REGION, 2023–2028 (USD THOUSAND)
                    TABLE 45 PLASMA: MARKET FOR BIOSCIENCE, BY REGION, 2018–2022 (USD THOUSAND)
                    TABLE 46 PLASMA: MARKET FOR BIOSCIENCE, BY REGION, 2023–2028 (USD THOUSAND)
                    TABLE 47 PLASMA: MARKET FOR INDUSTRIAL SCIENCE, BY REGION, 2018–2022 (USD THOUSAND)
                    TABLE 48 PLASMA: MARKET FOR INDUSTRIAL SCIENCE, BY REGION, 2023–2028 (USD THOUSAND)
 
7 FOCUSED ION BEAM MARKET, BY APPLICATION (Page No. - 93)
    7.1 INTRODUCTION 
           FIGURE 29 MARKET, BY APPLICATION
           TABLE 49 MARKET, BY APPLICATION, 2018–2022 (USD MILLION)
           FIGURE 30 FAILURE ANALYSIS APPLICATION TO REGISTER HIGHEST CAGR IN FOCUSED ION BEAM MARKET FROM 2023 TO 2028
           TABLE 50 MARKET, BY APPLICATION, 2023–2028 (USD MILLION)
    7.2 FAILURE ANALYSIS 
           7.2.1 RISING NEED FOR HIGH-QUALITY AND RELIABLE ELECTRONIC DEVICES AND COMPONENTS
                    TABLE 51 FAILURE ANALYSIS: MARKET, BY ION SOURCE, 2018–2022 (USD MILLION)
                    FIGURE 31 GA+ LIQUID METAL SEGMENT TO COMMAND MARKET FOR FAILURE ANALYSIS APPLICATION THROUGHOUT FORECAST PERIOD
                    TABLE 52 FAILURE ANALYSIS: MARKET, BY ION SOURCE, 2023–2028 (USD MILLION)
                    TABLE 53 FAILURE ANALYSIS: MARKET, BY VERTICAL, 2018–2022 (USD MILLION)
                    TABLE 54 FAILURE ANALYSIS: MARKET, BY VERTICAL, 2023–2028 (USD MILLION)
                    TABLE 55 FAILURE ANALYSIS: MARKET, BY REGION, 2018–2022 (USD MILLION)
                    TABLE 56 FAILURE ANALYSIS: MARKET, BY REGION, 2023–2028 (USD MILLION)
    7.3 NANOFABRICATION 
           7.3.1 INCREASING ADOPTION OF FIB SYSTEMS IN MICRO AND NANOFABRICATION APPLICATIONS
                    TABLE 57 NANOFABRICATION: FOCUSED ION BEAM MARKET, BY ION SOURCE, 2018–2022 (USD MILLION)
                    TABLE 58 NANOFABRICATION: MARKET, BY ION SOURCE, 2023–2028 (USD MILLION)
                    TABLE 59 NANOFABRICATION: MARKET, BY VERTICAL, 2018–2022 (USD MILLION)
                    TABLE 60 NANOFABRICATION: MARKET, BY VERTICAL, 2023–2028 (USD MILLION)
                    TABLE 61 NANOFABRICATION: MARKET, BY REGION, 2018–2022 (USD MILLION)
                    TABLE 62 NANOFABRICATION: MARKET, BY REGION, 2023–2028 (USD MILLION)
    7.4 DEVICE MODIFICATION 
           7.4.1 RISING FOCUS ON REDUCING MANUFACTURING TIME FOR MODIFIED INTEGRATED CIRCUITS
                    TABLE 63 DEVICE MODIFICATION: MARKET, BY ION SOURCE, 2018–2022 (USD THOUSAND)
                    TABLE 64 DEVICE MODIFICATION: MARKET, BY ION SOURCE, 2023–2028 (USD THOUSAND)
                    TABLE 65 DEVICE MODIFICATION: MARKET, BY VERTICAL, 2018–2022 (USD MILLION)
                    TABLE 66 DEVICE MODIFICATION: MARKET, BY VERTICAL, 2023–2028 (USD MILLION)
                    TABLE 67 DEVICE MODIFICATION: MARKET, BY REGION, 2018–2022 (USD THOUSAND)
                    FIGURE 32 ASIA PACIFIC TO EXHIBIT HIGHEST CAGR IN MARKET FOR DEVICE MODIFICATION APPLICATION FROM 2023 TO 2028
                    TABLE 68 DEVICE MODIFICATION: MARKET, BY REGION, 2023–2028 (USD THOUSAND)
    7.5 CIRCUIT EDIT 
           7.5.1 SURGING REQUIREMENT FOR ADVANCED PROTOTYPING, CROSS-SECTIONING, AND DEBUGGING OF UNDERPRODUCTION DEVICES
                    TABLE 69 CIRCUIT EDIT: MARKET, BY ION SOURCE, 2018–2022 (USD THOUSAND)
                    TABLE 70 CIRCUIT EDIT: MARKET, BY ION SOURCE, 2023–2028 (USD THOUSAND)
                    TABLE 71 CIRCUIT EDIT: MARKET, BY VERTICAL, 2018–2022 (USD MILLION)
                    FIGURE 33 ELECTRONICS & SEMICONDUCTOR VERTICAL TO HOLD LARGEST SHARE OF FOCUSED ION BEAM MARKET FOR CIRCUIT EDIT APPLICATION IN 2028
                    TABLE 72 CIRCUIT EDIT: MARKET, BY VERTICAL, 2023–2028 (USD MILLION)
                    TABLE 73 CIRCUIT EDIT: MARKET, BY REGION, 2018–2022 (USD MILLION)
                    TABLE 74 CIRCUIT EDIT: MARKET, BY REGION, 2023–2028 (USD MILLION)
    7.6 COUNTERFEIT DETECTION 
           7.6.1 INCREASING USE OF FIB SYSTEMS TO ELIMINATE PRODUCTION OF SUBSTANDARD OR FALSIFIED PRODUCTS
                    TABLE 75 COUNTERFEIT DETECTION: MARKET, BY VERTICAL, 2018–2022 (USD THOUSAND)
                    TABLE 76 COUNTERFEIT DETECTION: MARKET, BY VERTICAL, 2023–2028 (USD THOUSAND)
                    TABLE 77 COUNTERFEIT DETECTION: MARKET, BY REGION, 2018–2022 (USD THOUSAND)
                    TABLE 78 COUNTERFEIT DETECTION: MARKET, BY REGION, 2023–2028 (USD THOUSAND)
 
8 FOCUSED ION BEAM MARKET, BY VERTICAL (Page No. - 108)
    8.1 INTRODUCTION 
           FIGURE 34 MARKET, BY VERTICAL
           TABLE 79 MARKET, BY VERTICAL, 2018–2022 (USD MILLION)
           FIGURE 35 BIOSCIENCE VERTICAL TO REGISTER HIGHEST CAGR IN FOCUSED ION BEAM MARKET FROM 2023 TO 2028
           TABLE 80 MARKET, BY VERTICAL, 2023–2028 (USD MILLION)
    8.2 ELECTRONICS & SEMICONDUCTOR 
           8.2.1 INCREASING CONSUMER DEMAND FOR COMPACT AND HIGHLY POWER-EFFICIENT PORTABLE DEVICES
                    TABLE 81 ELECTRONICS & SEMICONDUCTOR: MARKET, BY ION SOURCE, 2018–2022 (USD MILLION)
                    TABLE 82 ELECTRONICS & SEMICONDUCTOR: MARKET, BY ION SOURCE, 2023–2028 (USD MILLION)
                    TABLE 83 ELECTRONICS & SEMICONDUCTOR: MARKET, BY APPLICATION, 2018–2022 (USD THOUSAND)
                    TABLE 84 ELECTRONICS & SEMICONDUCTOR: MARKET, BY APPLICATION, 2023–2028 (USD THOUSAND)
                    TABLE 85 ELECTRONICS & SEMICONDUCTOR: MARKET, BY REGION, 2018–2022 (USD MILLION)
                    TABLE 86 ELECTRONICS & SEMICONDUCTOR: MARKET, BY REGION, 2023–2028 (USD MILLION)
                    TABLE 87 ELECTRONICS & SEMICONDUCTOR: MARKET IN NORTH AMERICA, BY COUNTRY, 2018–2022 (USD MILLION)
                    FIGURE 36 US TO DOMINATE NORTH AMERICAN MARKET FOR ELECTRONICS & SEMICONDUCTOR VERTICAL DURING FORECAST PERIOD
                    TABLE 88 ELECTRONICS & SEMICONDUCTOR: MARKET IN NORTH AMERICA, BY COUNTRY, 2023–2028 (USD MILLION)
                    TABLE 89 ELECTRONICS & SEMICONDUCTOR: MARKET IN EUROPE, BY COUNTRY, 2018–2022 (USD MILLION)
                    TABLE 90 ELECTRONICS & SEMICONDUCTOR: MARKET IN EUROPE, BY COUNTRY, 2023–2028 (USD MILLION)
                    TABLE 91 ELECTRONICS & SEMICONDUCTOR: MARKET IN ASIA PACIFIC, BY COUNTRY, 2018–2022 (USD MILLION)
                    TABLE 92 ELECTRONICS & SEMICONDUCTOR: MARKET IN ASIA PACIFIC, BY COUNTRY, 2023–2028 (USD MILLION)
                    TABLE 93 ELECTRONICS & SEMICONDUCTOR: MARKET IN ROW, BY REGION, 2018–2022 (USD MILLION)
                    TABLE 94 ELECTRONICS & SEMICONDUCTOR: MARKET IN ROW, BY REGION, 2023–2028 (USD MILLION)
                    TABLE 95 ELECTRONICS & SEMICONDUCTOR: FOCUSED ION BEAM MARKET, BY UTILIZATION, 2018–2022 (USD MILLION)
                    TABLE 96 ELECTRONICS & SEMICONDUCTOR: MARKET, BY UTILIZATION, 2023–2028 (USD MILLION)
           8.2.2 SEMICONDUCTOR MANUFACTURING
                    8.2.2.1 Necessity to check reliability of semiconductor devices integrated with components having complex circuitries
           8.2.3 MEMS AND THIN-FILM PRODUCTION
                    8.2.3.1 Rising demand for FIB systems from MEMS and NEMS engineers
    8.3 MATERIAL SCIENCE 
           8.3.1 UTILIZATION OF FIB SYSTEMS FOR IMAGING, ANALYSIS, AND CHARACTERIZATION OF REFINED MATERIALS
                    TABLE 97 MATERIAL SCIENCE: MARKET, BY ION SOURCE, 2018–2022 (USD THOUSAND)
                    TABLE 98 MATERIAL SCIENCE: MARKET, BY ION SOURCE, 2023–2028 (USD THOUSAND)
                    TABLE 99 MATERIAL SCIENCE: MARKET, BY APPLICATION, 2018–2022 (USD THOUSAND)
                    FIGURE 37 FAILURE ANALYSIS SEGMENT HELD LARGEST SHARE OF MARKET FOR MATERIAL SCIENCE VERTICAL IN 2022
                    TABLE 100 MATERIAL SCIENCE: MARKET, BY APPLICATION, 2023–2028 (USD THOUSAND)
                    TABLE 101 MATERIAL SCIENCE: MARKET, BY REGION, 2018–2022 (USD MILLION)
                    TABLE 102 MATERIAL SCIENCE: MARKET, BY REGION, 2023–2028 (USD MILLION)
                    TABLE 103 MATERIAL SCIENCE: MARKET IN NORTH AMERICA, BY COUNTRY, 2018–2022 (USD MILLION)
                    TABLE 104 MATERIAL SCIENCE: MARKET IN NORTH AMERICA, BY COUNTRY, 2023–2028 (USD MILLION)
                    TABLE 105 MATERIAL SCIENCE: FOCUSED ION BEAM MARKET IN EUROPE, BY COUNTRY, 2018–2022 (USD MILLION)
                    TABLE 106 MATERIAL SCIENCE: MARKET IN EUROPE, BY COUNTRY, 2023–2028 (USD MILLION)
                    TABLE 107 MATERIAL SCIENCE: MARKET IN ASIA PACIFIC, BY COUNTRY, 2018–2022 (USD MILLION)
                    TABLE 108 MATERIAL SCIENCE: MARKET IN ASIA PACIFIC, BY COUNTRY, 2023–2028 (USD MILLION)
                    TABLE 109 MATERIAL SCIENCE: MARKET IN ROW, BY REGION, 2018–2022 (USD THOUSAND)
                    TABLE 110 MATERIAL SCIENCE: MARKET IN ROW, BY REGION, 2023–2028 (USD THOUSAND)
           8.3.2 METALS & MINING
           8.3.3 PAPER & FIBER MATERIALS
           8.3.4 CERAMIC & GLASS
           8.3.5 POLYMERS
    8.4 BIOSCIENCE 
           8.4.1 UTILIZATION OF FIB SYSTEMS TO ANALYZE BIOLOGICAL SPECIES
                    TABLE 111 BIOSCIENCE: FOCUSED ION BEAM MARKET, BY ION SOURCE, 2018–2022 (USD MILLION)
                    FIGURE 38 GA+ LIQUID METAL SEGMENT HELD LARGEST SHARE OF MARKET FOR BIOSCIENCE VERTICAL FROM 2023 TO 2028
                    TABLE 112 BIOSCIENCE: MARKET, BY ION SOURCE, 2023–2028 (USD MILLION)
                    TABLE 113 BIOSCIENCE: MARKET, BY APPLICATION, 2018–2022 (USD THOUSAND)
                    TABLE 114 BIOSCIENCE: MARKET, BY APPLICATION, 2023–2028 (USD THOUSAND)
                    TABLE 115 BIOSCIENCE: MARKET, BY REGION, 2018–2022 (USD MILLION)
                    TABLE 116 BIOSCIENCE: MARKET, BY REGION, 2023–2028 (USD MILLION)
                    TABLE 117 BIOSCIENCE: MARKET IN NORTH AMERICA, BY COUNTRY, 2018–2022 (USD MILLION)
                    TABLE 118 BIOSCIENCE: FOCUSED ION BEAM MARKET IN NORTH AMERICA, BY COUNTRY, 2023–2028 (USD MILLION)
                    TABLE 119 BIOSCIENCE: MARKET IN EUROPE, BY COUNTRY, 2018–2022 (USD MILLION)
                    TABLE 120 BIOSCIENCE: MARKET IN EUROPE, BY COUNTRY, 2023–2028 (USD MILLION)
                    TABLE 121 BIOSCIENCE: MARKET IN ASIA PACIFIC, BY COUNTRY, 2018–2022 (USD MILLION)
                    TABLE 122 BIOSCIENCE: MARKET IN ASIA PACIFIC, BY COUNTRY, 2023–2028 (USD MILLION)
                    TABLE 123 BIOSCIENCE: MARKET IN ROW, BY REGION, 2018–2022 (USD MILLION)
                    TABLE 124 BIOSCIENCE: MARKET IN ROW, BY REGION, 2023–2028 (USD MILLION)
           8.4.2 CELLULAR BIOLOGY
           8.4.3 STRUCTURAL BIOLOGY
           8.4.4 BIOMEDICAL ENGINEERING
           8.4.5 NEUROSCIENCE
    8.5 INDUSTRIAL SCIENCE 
           8.5.1 IMPLEMENTATION OF FIB SYSTEMS BY INDUSTRY PLAYERS TO STUDY CHARACTERISTICS OF DIFFERENT MATERIALS
                    TABLE 125 INDUSTRIAL SCIENCE: FOCUSED ION BEAM MARKET, BY ION SOURCE, 2018–2022 (USD THOUSAND)
                    TABLE 126 INDUSTRIAL SCIENCE: MARKET, BY ION SOURCE, 2023–2028 (USD THOUSAND)
                    TABLE 127 INDUSTRIAL SCIENCE: MARKET, BY APPLICATION, 2018–2022 (USD THOUSAND)
                    TABLE 128 INDUSTRIAL SCIENCE: MARKET, BY APPLICATION, 2023–2028 (USD THOUSAND)
                    TABLE 129 INDUSTRIAL SCIENCE: MARKET, BY REGION, 2018–2022 (USD MILLION)
                    FIGURE 39 NORTH AMERICA TO CAPTURE LARGEST SHARE OF MARKET FOR INDUSTRIAL SCIENCE THROUGHOUT FORECAST PERIOD
                    TABLE 130 INDUSTRIAL SCIENCE: MARKET, BY REGION, 2023–2028 (USD MILLION)
                    TABLE 131 INDUSTRIAL SCIENCE: MARKET IN NORTH AMERICA, BY COUNTRY, 2018–2022 (USD MILLION)
                    TABLE 132 INDUSTRIAL SCIENCE: MARKET IN NORTH AMERICA, BY COUNTRY, 2023–2028 (USD MILLION)
                    TABLE 133 INDUSTRIAL SCIENCE: MARKET IN EUROPE, BY COUNTRY, 2018–2022 (USD THOUSAND)
                    TABLE 134 INDUSTRIAL SCIENCE: FOCUSED ION BEAM MARKET IN EUROPE, BY COUNTRY, 2023–2028 (USD THOUSAND)
                    TABLE 135 INDUSTRIAL SCIENCE: MARKET IN ASIA PACIFIC, BY COUNTRY, 2018–2022 (USD MILLION)
                    TABLE 136 INDUSTRIAL SCIENCE: MARKET IN ASIA PACIFIC, BY COUNTRY, 2023–2028 (USD MILLION)
                    TABLE 137 INDUSTRIAL SCIENCE: MARKET IN ROW, BY REGION, 2018–2022 (USD THOUSAND)
                    TABLE 138 INDUSTRIAL SCIENCE: MARKET IN ROW, BY REGION, 2023–2028 (USD THOUSAND)
           8.5.2 OIL & GAS
           8.5.3 AUTOMOTIVE & AEROSPACE
           8.5.4 CHEMICAL
           8.5.5 POWER GENERATION
 
9 FOCUSED ION BEAM MARKET, BY REGION (Page No. - 137)
    9.1 INTRODUCTION 
           FIGURE 40 FOCUSED ION BEAM MARKET, BY REGION
           FIGURE 41 ASIA PACIFIC TO RECORD HIGHEST CAGR IN MARKET DURING FORECAST PERIOD
           TABLE 139 MARKET, BY REGION, 2018–2022 (USD MILLION)
           TABLE 140 MARKET, BY REGION, 2023–2028 (USD MILLION)
    9.2 NORTH AMERICA 
           FIGURE 42 NORTH AMERICA: MARKET SNAPSHOT
           TABLE 141 NORTH AMERICA: MARKET, BY ION SOURCE, 2018–2022 (USD MILLION)
           TABLE 142 NORTH AMERICA: MARKET, BY ION SOURCE, 2023–2028 (USD MILLION)
           TABLE 143 NORTH AMERICA: MARKET, BY APPLICATION, 2018–2022 (USD THOUSAND)
           TABLE 144 NORTH AMERICA: MARKET, BY APPLICATION, 2023–2028 (USD THOUSAND)
           TABLE 145 NORTH AMERICA: FOCUSED ION BEAM MARKET, BY VERTICAL, 2018–2022 (USD MILLION)
           FIGURE 43 BIOSCIENCE VERTICAL TO RECORD HIGHEST CAGR IN NORTH AMERICAN MARKET BETWEEN 2023 AND 2028
           TABLE 146 NORTH AMERICA: MARKET, BY VERTICAL, 2023–2028 (USD MILLION)
           TABLE 147 NORTH AMERICA: MARKET, BY COUNTRY, 2018–2022 (USD MILLION)
           TABLE 148 NORTH AMERICA: MARKET, BY COUNTRY, 2023–2028 (USD MILLION)
           9.2.1 US
                    9.2.1.1 Likely to be fastest-growing market in North America during forecast period
                               TABLE 149 US: MARKET, BY VERTICAL, 2018–2022 (USD MILLION)
                               TABLE 150 US: FOCUSED ION BEAM MARKET, BY VERTICAL, 2023–2028 (USD MILLION)
           9.2.2 CANADA
                    9.2.2.1 Anticipated to hold second position in North American market throughout forecast period
                               TABLE 151 CANADA: MARKET, BY VERTICAL, 2018–2022 (USD MILLION)
                               TABLE 152 CANADA: MARKET, BY VERTICAL, 2023–2028 (USD MILLION)
           9.2.3 MEXICO
                    9.2.3.1 Attractive government opportunities encouraging FDIs to accelerate market growth
                               TABLE 153 MEXICO: MARKET, BY VERTICAL, 2018–2022 (USD MILLION)
                               TABLE 154 MEXICO: MARKET, BY VERTICAL, 2023–2028 (USD MILLION)
    9.3 EUROPE 
           FIGURE 44 EUROPE: MARKET SNAPSHOT
           TABLE 155 EUROPE: MARKET, BY ION SOURCE, 2018–2022 (USD MILLION)
           TABLE 156 EUROPE: MARKET, BY ION SOURCE, 2023–2028 (USD MILLION)
           TABLE 157 EUROPE: MARKET, BY APPLICATION, 2018–2022 (USD MILLION)
           TABLE 158 EUROPE: FOCUSED ION BEAM MARKET, BY APPLICATION, 2023–2028 (USD MILLION)
           FIGURE 45 ELECTRONICS & SEMICONDUCTOR VERTICAL TO CAPTURE LARGEST SHARE OF EUROPEAN MARKET IN 2023
           TABLE 159 EUROPE: MARKET, BY VERTICAL, 2018–2022 (USD MILLION)
           TABLE 160 EUROPE: MARKET, BY VERTICAL, 2023–2028 (USD MILLION)
           TABLE 161 EUROPE: MARKET, BY COUNTRY, 2018–2022 (USD MILLION)
           TABLE 162 EUROPE: MARKET, BY COUNTRY, 2023–2028 (USD MILLION)
           9.3.1 UK
                    9.3.1.1 Presence of FIB manufacturers and research institutes to fuel market growth
                               TABLE 163 UK: MARKET, BY VERTICAL, 2018–2022 (USD MILLION)
                               TABLE 164 UK: MARKET, BY VERTICAL, 2023–2028 (USD MILLION)
           9.3.2 GERMANY
                    9.3.2.1 Bioscience industry to create growth opportunities for providers of FIB systems
                               TABLE 165 GERMANY: MARKET, BY VERTICAL, 2018–2022 (USD MILLION)
                               TABLE 166 GERMANY: MARKET, BY VERTICAL, 2023–2028 (USD MILLION)
           9.3.3 FRANCE
                    9.3.3.1 Existence of many laboratories having expertise in analyzing ion beams to propel market growth
                               TABLE 167 FRANCE: MARKET, BY VERTICAL, 2018–2022 (USD MILLION)
                               TABLE 168 FRANCE: MARKET, BY VERTICAL, 2023–2028 (USD MILLION)
           9.3.4 REST OF EUROPE
                    TABLE 169 REST OF EUROPE: FOCUSED ION BEAM MARKET, BY VERTICAL, 2018–2022 (USD MILLION)
                    TABLE 170 REST OF EUROPE: MARKET, BY VERTICAL, 2023–2028 (USD MILLION)
    9.4 ASIA PACIFIC 
           FIGURE 46 ASIA PACIFIC: MARKET SNAPSHOT
           TABLE 171 ASIA PACIFIC: MARKET, BY ION SOURCE, 2018–2022 (USD MILLION)
           TABLE 172 ASIA PACIFIC: MARKET, BY ION SOURCE, 2023–2028 (USD MILLION)
           TABLE 173 ASIA PACIFIC: MARKET, BY APPLICATION, 2018–2022 (USD MILLION)
           TABLE 174 ASIA PACIFIC: FOCUSED ION BEAM MARKET, BY APPLICATION, 2023–2028 (USD MILLION)
           TABLE 175 ASIA PACIFIC: MARKET, BY VERTICAL, 2018–2022 (USD MILLION)
           TABLE 176 ASIA PACIFIC: MARKET, BY VERTICAL, 2023–2028 (USD MILLION)
           TABLE 177 ASIA PACIFIC: MARKET, BY COUNTRY, 2018–2022 (USD MILLION)
           TABLE 178 ASIA PACIFIC: MARKET, BY COUNTRY, 2023–2028 (USD MILLION)
           9.4.1 CHINA
                    9.4.1.1 Rising use of FIB systems to analyze cause of device failure to drive market growth
                               FIGURE 47 ELECTRONICS & SEMICONDUCTOR VERTICAL TO LEAD MARKET IN CHINA THROUGHOUT FORECAST PERIOD
                               TABLE 179 CHINA: MARKET, BY VERTICAL, 2018–2022 (USD MILLION)
                               TABLE 180 CHINA: MARKET, BY VERTICAL, 2023–2028 (USD MILLION)
           9.4.2 JAPAN
                    9.4.2.1 Consistent and increased investments in R&D activities by key players to spur market growth
                               TABLE 181 JAPAN: MARKET, BY VERTICAL, 2018–2022 (USD MILLION)
                               TABLE 182 JAPAN: FOCUSED ION BEAM MARKET, BY VERTICAL, 2023–2028 (USD MILLION)
           9.4.3 SOUTH KOREA
                    9.4.3.1 Increased adoption of FIB systems in laboratories, universities, and manufacturing companies to support market growth
                               TABLE 183 SOUTH KOREA: MARKET, BY VERTICAL, 2018–2022 (USD MILLION)
                               TABLE 184 SOUTH KOREA: MARKET, BY VERTICAL, 2023–2028 (USD MILLION)
           9.4.4 INDIA
                    9.4.4.1 Government initiatives to support growth of electronics & semiconductor industry
                               TABLE 185 INDIA: MARKET, BY VERTICAL, 2018–2022 (USD MILLION)
                               TABLE 186 INDIA: MARKET, BY VERTICAL, 2023–2028 (USD MILLION)
           9.4.5 REST OF ASIA PACIFIC
                    TABLE 187 REST OF ASIA PACIFIC: MARKET, BY VERTICAL, 2018–2022 (USD MILLION)
           TABLE 188 REST OF ASIA PACIFIC: MARKET, BY VERTICAL, 2023–2028 (USD MILLION)
    9.5 REST OF THE WORLD 
           TABLE 189 ROW: FOCUSED ION BEAM MARKET, BY ION SOURCE, 2018–2022 (USD MILLION)
           TABLE 190 ROW: MARKET, BY ION SOURCE, 2023–2028 (USD MILLION)
           TABLE 191 ROW: MARKET, BY APPLICATION, 2018–2022 (USD THOUSAND)
           TABLE 192 ROW: MARKET, BY APPLICATION, 2023–2028 (USD THOUSAND)
           TABLE 193 ROW: MARKET, BY VERTICAL, 2018–2022 (USD MILLION)
           TABLE 194 ROW: MARKET, BY VERTICAL, 2023–2028 (USD MILLION)
           TABLE 195 ROW: MARKET, BY REGION, 2018–2022 (USD MILLION)
           TABLE 196 ROW: MARKET, BY REGION, 2023–2028 (USD MILLION)
           TABLE 197 MIDDLE EAST & AFRICA: FOCUSED ION BEAM MARKET, BY REGION, 2018–2022 (USD MILLION)
           TABLE 198 MIDDLE EAST & AFRICA: MARKET, BY REGION, 2023–2028 (USD MILLION)
           9.5.1 MIDDLE EAST & AFRICA
                    9.5.1.1 Research institutes, distributors, and universities to support market growth
                               FIGURE 48 ELECTRONICS & SEMICONDUCTOR VERTICAL TO CAPTURE LARGEST SHARE OF MARKET IN MIDDLE EAST & AFRICA DURING FORECAST PERIOD
                               TABLE 199 MIDDLE EAST & AFRICA: MARKET, BY VERTICAL, 2018–2022 (USD MILLION)
                               TABLE 200 MIDDLE EAST & AFRICA: MARKET, BY VERTICAL, 2023–2028 (USD MILLION)
           9.5.2 SOUTH AMERICA
                    9.5.2.1 Increased investments to drive focused ion beam market growth
                               TABLE 201 SOUTH AMERICA: MARKET, BY VERTICAL, 2018–2022 (USD MILLION)
                               TABLE 202 SOUTH AMERICA: MARKET, BY VERTICAL, 2023–2028 (USD MILLION)
 
10 COMPETITIVE LANDSCAPE (Page No. - 169)
     10.1 OVERVIEW 
     10.2 MARKET EVALUATION FRAMEWORK 
             TABLE 203 REVIEW OF STRATEGIES ADOPTED BY KEY PLAYERS IN MARKET
             10.2.1 PRODUCT PORTFOLIO
             10.2.2 REGIONAL FOCUS
             10.2.3 MANUFACTURING FOOTPRINT
             10.2.4 ORGANIC/INORGANIC STRATEGIES
     10.3 MARKET SHARE ANALYSIS, 2022 
             FIGURE 49 MARKET SHARE ANALYSIS OF TOP 5 PLAYERS IN FOCUSED ION BEAM MARKET, 2022
             TABLE 204 MARKET SHARE ANALYSIS OF TOP 5 COMPANIES (2022)
     10.4 COMPANY EVALUATION QUADRANT 
             10.4.1 STARS
             10.4.2 EMERGING LEADERS
             10.4.3 PERVASIVE PLAYERS
             10.4.4 PARTICIPANTS
                        FIGURE 50 COMPANY EVALUATION QUADRANT, 2022
     10.5 COMPETITIVE SCENARIO 
             10.5.1 PRODUCT LAUNCHES
                        TABLE 205 PRODUCT LAUNCHES, JANUARY 2020–DECEMBER 2022
             10.5.2 DEALS
                        TABLE 206 DEALS, JANUARY 2020–DECEMBER 2022
 
11 COMPANY PROFILES (Page No. - 177)
(Business Overview, Products Offered, Recent Developments, MnM View Right to win, Strategic choices made, Weaknesses and competitive threats) *  
     11.1 KEY PLAYERS 
             11.1.1 THERMO FISHER SCIENTIFIC INC.
                        TABLE 207 THERMO FISHER SCIENTIFIC INC.: BUSINESS OVERVIEW
                        FIGURE 51 THERMO FISHER SCIENTIFIC INC.: COMPANY SNAPSHOT
                        TABLE 208 THERMO FISHER SCIENTIFIC INC.: PRODUCT/SOLUTION/SERVICE OFFERINGS
                        TABLE 209 THERMO FISHER SCIENTIFIC INC.: PRODUCT LAUNCHES
             11.1.2 ZEISS INTERNATIONAL
                        TABLE 210 ZEISS INTERNATIONAL: BUSINESS OVERVIEW
                        FIGURE 52 ZEISS INTERNATIONAL: COMPANY SNAPSHOT
                        TABLE 211 ZEISS INTERNATIONAL: PRODUCT/SOLUTION/SERVICE OFFERINGS
             11.1.3 HITACHI, LTD. (HITACHI HIGH-TECHNOLOGIES CORPORATION)
                        TABLE 212 HITACHI, LTD.: BUSINESS OVERVIEW
                        FIGURE 53 HITACHI, LTD.: COMPANY SNAPSHOT
                        TABLE 213 HITACHI, LTD.: PRODUCT/SOLUTION/SERVICE OFFERINGS
             11.1.4 JEOL LTD.
                        TABLE 214 JEOL LTD.: BUSINESS OVERVIEW
                        FIGURE 54 JEOL LTD.: COMPANY SNAPSHOT
                        TABLE 215 JEOL LTD.: PRODUCT/SOLUTION/SERVICE OFFERINGS
             11.1.5 EUROFINS SCIENTIFIC
                        TABLE 216 EUROFINS SCIENTIFIC: BUSINESS OVERVIEW
                        FIGURE 55 EUROFINS SCIENTIFIC: COMPANY SNAPSHOT
                        TABLE 217 EUROFINS SCIENTIFIC: PRODUCT/SOLUTION/SERVICE OFFERINGS
             11.1.6 TESCAN ORSAY HOLDING A.S.
                        TABLE 218 TESCAN ORSAY HOLDING A.S.: BUSINESS OVERVIEW
                        TABLE 219 TESCAN ORSAY HOLDING A.S.: PRODUCT/SOLUTION/SERVICE OFFERINGS
                        TABLE 220 TESCAN ORSAY HOLDING A.S.: PRODUCT LAUNCHES
                        TABLE 221 TESCAN ORSAY HOLDING A.S.: DEALS
             11.1.7 A&D COMPANY, LIMITED
                        TABLE 222 A&D COMPANY, LIMITED: BUSINESS OVERVIEW
                        FIGURE 56 A&D COMPANY, LIMITED: COMPANY SNAPSHOT
                        TABLE 223 A&D COMPANY, LIMITED: PRODUCT/SOLUTION/SERVICE OFFERINGS
             11.1.8 VEECO INSTRUMENTS INC.
                        TABLE 224 VEECO INSTRUMENTS INC.: BUSINESS OVERVIEW
                        FIGURE 57 VEECO INSTRUMENTS INC.: COMPANY SNAPSHOT
                        TABLE 225 VEECO INSTRUMENTS INC.: PRODUCT/SOLUTION/SERVICE OFFERINGS
             11.1.9 RAITH GMBH
                        TABLE 226 RAITH GMBH: BUSINESS OVERVIEW
                        TABLE 227 RAITH GMBH: PRODUCT/SOLUTION/SERVICE OFFERINGS
                        TABLE 228 RAITH GMBH: DEALS
             11.1.10 FOCUS GMBH
                        TABLE 229 FOCUS GMBH: BUSINESS OVERVIEW
                        TABLE 230 FOCUS GMBH: PRODUCT/SOLUTION/SERVICE OFFERINGS
     11.2 OTHER KEY PLAYERS 
             11.2.1 OXFORD INSTRUMENTS PLC
             11.2.2 FIBICS INCORPORATED
             11.2.3 LEICA MICROSYSTEMS
             11.2.4 APPLIED BEAMS LLC
             11.2.5 ZEROK NANOTECH
             11.2.6 IONOPTIKA LTD
             11.2.7 NANO-MASTER, INC.
             11.2.8 KRATOS ANALYTICAL LTD.
             11.2.9 IC FAILURE ANALYSIS LAB
             11.2.10 IONPATH, INC.
*Details on Business Overview, Products Offered, Recent Developments, MnM View, Right to win, Strategic choices made, Weaknesses and competitive threats might not be captured in case of unlisted companies.  
 
12 APPENDIX (Page No. - 214)
     12.1 DISCUSSION GUIDE 
     12.2 KNOWLEDGESTORE: MARKETSANDMARKETS’ SUBSCRIPTION PORTAL 
     12.3 CUSTOMIZATION OPTIONS 
     12.4 RELATED REPORTS 
     12.5 AUTHOR DETAILS


The study involved four major activities in estimating the size of the focused ion beam market. Exhaustive secondary research was done to collect information on the market. The next step was to validate these findings, assumptions, and sizing with industry experts across the value chain through primary research. Both top-down and bottom-up approaches were employed to estimate the total market’s size. After that, market breakdown and data triangulation were used to determine the market sizes of segments and sub-segments.

Secondary Research

In the secondary research process, various secondary sources have been referred to identify and collect information relevant to this study. The secondary sources include annual reports, press releases, and investor presentations of companies; white papers, certified publications, and articles from recognized authors; directories; and databases. Secondary research has been mainly conducted to obtain key information about the industry's supply chain, value chain of the market, the total pool of key players, market classification and segmentation according to industry trends, geographic markets, and key developments from both market- and technology-oriented perspectives.

Primary Research

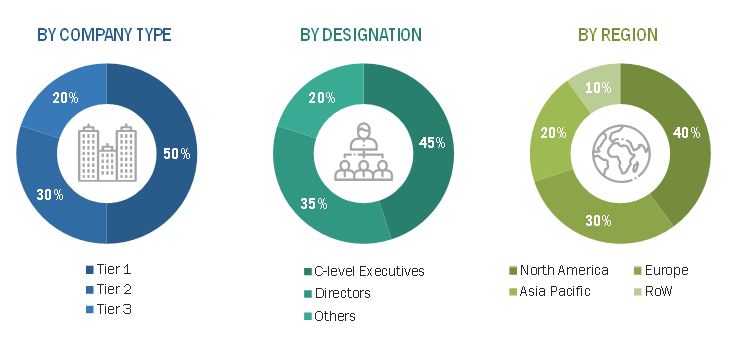
Extensive primary research has been conducted after understanding and analyzing the focused ion beam market scenario through secondary research. Several primary interviews have been conducted with key opinion leaders from both the demand- and supply-side vendors across four major regions—North America, Europe, Asia Pacific, and Rest of the World (South America, the Middle East, and Africa). Approximately 25% of the primary interviews have been conducted with the demand side and 75% with the supply side. This primary data has been collected mainly through telephonic interviews, which consists 80% of total primary interviews; however, questionnaires and e-mails have also been used to collect the data.

After interacting with industry experts, brief sessions were conducted with highly experienced independent consultants to reinforce the findings from our primaries. This, along with the in-house subject matter experts’ opinions, has led us to the findings as described in the remainder of this report.
Focused Ion Beam Market Size, and Share

To know about the assumptions considered for the study, download the pdf brochure

Market Size Estimation

The bottom-up approach has been implemented to arrive at the overall size of the focused ion beam market from the revenues of the key players in the market. Calculations based on the revenue of the key players identified in the market led to the overall market size.

  • Identifying various key players offering FIB systems and ion sources
  • Analyzing the global penetration of different ion source-based FIB systems in various applications and verticals
  • Estimating the market for FIB systems by ion source
  • Tracking the ongoing and upcoming developments in FIB applications and forecasting the market based on these developments and other critical parameters
  • Undertaking multiple discussions with key opinion leaders to understand the working principle of FIB systems and their applications, which helped analyze the impact of developments undertaken by each major company to increase their share in the focused ion beam market
  • Verifying and crosschecking estimates at every level with key opinion leaders, including chief executive officers (CEOs), directors, and operation managers, and then finally with the domain experts at MarketsandMarkets
  • Studying various paid and unpaid sources of information such as annual reports, press releases, white papers, and databases for the company- and region-specific developments undertaken in the focused ion beam market

Focused Ion Beam Market: Bottom-Up Approach

Focused Ion Beam Market Size, and bottom-up approach

In the top-down approach, the overall market size has been used to estimate the size of the individual markets (mentioned in the market segmentation) through percentage splits obtained from the secondary and primary research processes.

  • Focusing initially on investments and expenditures undertaken in the ecosystem of FIB; further splitting them into the ion source, application, vertical, and region and listing key developments in major market areas
  • Identifying key players in the focused ion beam market based on application and vertical and verifying the findings through secondary research and brief discussions with industry experts
  • Analyzing revenues, product mix, geographic presence, and key end-use applications of FIB to estimate and arrive at the percentage splits
  • Discussing these splits with industry experts to validate the information and identify key growth pockets across all major segments
  • Breaking down the total market based on verified splits and key growth pockets across all segments

Focused Ion Beam Market: Top-Down Approach

Focused Ion Beam Market Size, and top-down approach

Data Triangulation

After arriving at the overall market size from the market size estimation process explained above, the total market has been split into several segments and subsegments. To complete the overall market engineering process and arrive at the exact statistics for all segments and subsegments, the data triangulation and market breakdown procedure has been employed, wherever applicable. The data has been triangulated by studying various factors and trends in both the demand and supply sides. Along with this, the market has been validated using both top-down and bottom-up approaches.

Report Objectives:

  • To describe, segment, and forecast the overall size of the focused ion beam (FIB) market based on ion source, application, and vertical, in terms of value
  • To describe and forecast the market for four key regions: North America, Europe, Asia Pacific, and Rest of the World (RoW), in terms of value
  • To forecast the global market size in terms of volume
  • To provide detailed information regarding the major factors such as drivers, restraints, opportunities, and challenges influencing the growth of the focused ion beam market
  • To provide a detailed overview of the FIB value chain
  • To strategically analyze micromarkets1 with respect to individual growth trends, prospects, and contributions to the overall market
  • To analyze opportunities in the market for stakeholders and provide a competitive landscape of the market
  • To analyze competitive developments such as product launches and contracts in the focused ion beam market
  • To strategically profile the key players in the focused ion beam market and comprehensively analyze their market ranking and core competencies2

Available Customizations:

With the given market data, MarketsandMarkets offers customizations according to the company’s specific needs. The following customization options are available for the report:

  • Detailed analysis and profiling of additional market players based on various blocks of the supply chain
Custom Market Research Services

We will customize the research for you, in case the report listed above does not meet with your exact requirements. Our custom research will comprehensively cover the business information you require to help you arrive at strategic and profitable business decisions.

Request Customization

Instant Answers with GPT - Ask Now!

Ask real questions. Get complete answers !
Report Code
SE 7422
Published ON
Dec, 2022
Choose License Type
BUY NOW
  • SHARE
X
Request Customization
Speak to Analyst
Speak to Analyst
OR FACE-TO-FACE MEETING
PERSONALIZE THIS RESEARCH
  • Triangulate with your Own Data
  • Get Data as per your Format and Definition
  • Gain a Deeper Dive on a Specific Application, Geography, Customer or Competitor
  • Any level of Personalization
REQUEST A FREE CUSTOMIZATION
LET US HELP YOU!
  • What are the Known and Unknown Adjacencies Impacting the Focused Ion Beam Market
  • What will your New Revenue Sources be?
  • Who will be your Top Customer; what will make them switch?
  • Defend your Market Share or Win Competitors
  • Get a Scorecard for Target Partners
CUSTOMIZED WORKSHOP REQUEST
+1-888-600-6441
  • Call Us
  • +1-888-600-6441 (Corporate office hours)
  • +1-888-600-6441 (US/Can toll free)
  • +44-800-368-9399 (UK office hours)
CONNECT WITH US
ABOUT TRUST ONLINE
©2024 MarketsandMarkets Research Private Ltd. All rights reserved
DMCA.com Protection Status Website Feedback