The study involved major activities in estimating the current size of the Oil and gas pumps market. Exhaustive secondary research was done to collect information on the peer and parent markets. The next step was to validate these findings, assumptions, and sizing with industry experts across the value chain through primary research. Both top-down and bottom-up approaches were employed to estimate the total market size. Thereafter, market breakdown and data triangulation were used to estimate the market size of the segments and subsegments.
Secondary Research
This research study on the oil and gas pumps market involved the use of extensive secondary sources, directories, and databases, such as Hoover’s, Bloomberg, Factiva, IRENA, International Energy Agency, and Statista Industry Journal, to collect and identify information useful for a technical, market-oriented, and commercial study of the oil and gas pumps market. The other secondary sources included annual reports, press releases & investor presentations of companies, white papers, certified publications, articles by recognized authors, manufacturer associations, trade directories, and databases.
Primary Research
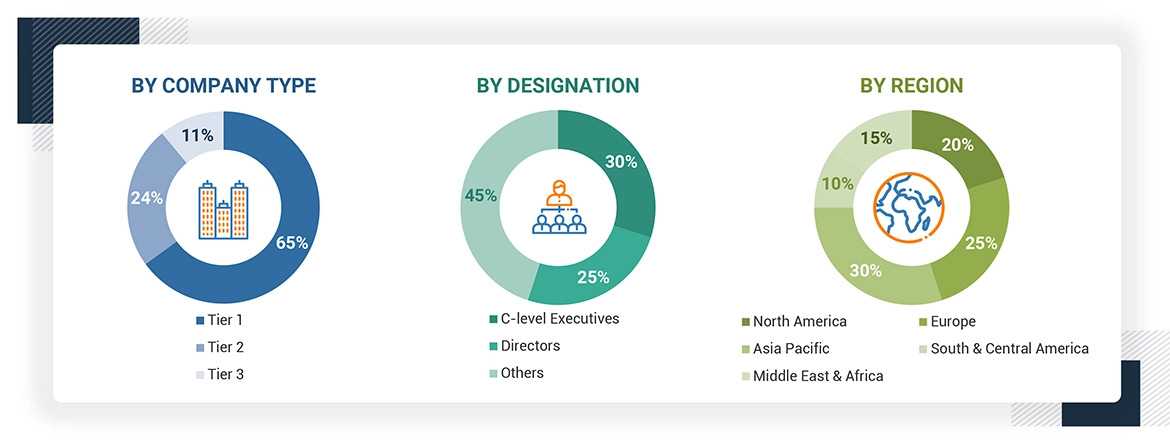
The oil and gas pumps market comprises several stakeholders, such as oil & gas pumps manufacturers, technology providers, and technical support providers in the supply chain. The demand side of this market is characterized by the rising demand for oil & gas pumps in various applications such as upstream, midstream, and downstream. The supply side is characterized by rising demand for contracts from the industrial sector and mergers & acquisitions among big players. Various primary sources from both the supply and demand sides of the market were interviewed to obtain qualitative and quantitative information. Following is the breakdown of primary respondents:
To know about the assumptions considered for the study, download the pdf brochure
Market Size Estimation
Both top-down and bottom-up approaches were used to estimate and validate the total size of the oil and gas pumps market. These methods were also used extensively to estimate the size of various subsegments in the market. The research methodology used to estimate the market size includes the following:
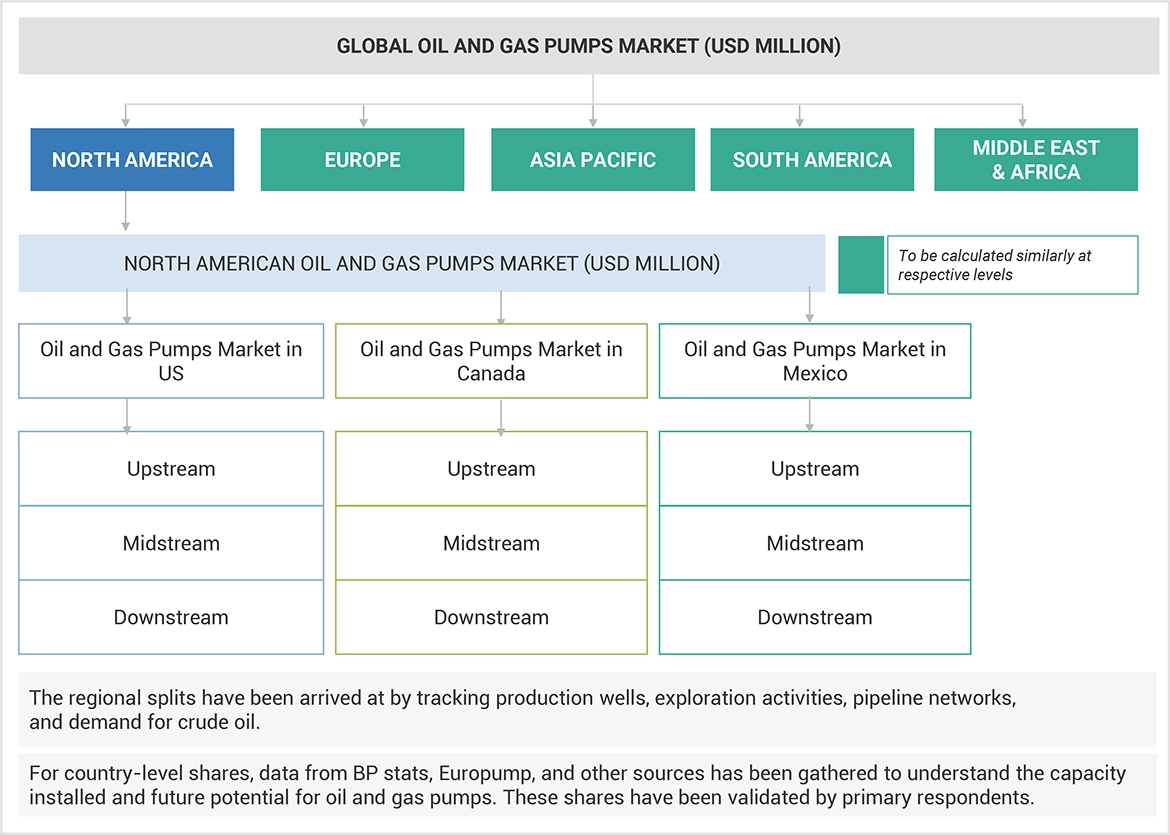
Oil and Gas Pumps Market Size: Top-Down Approach
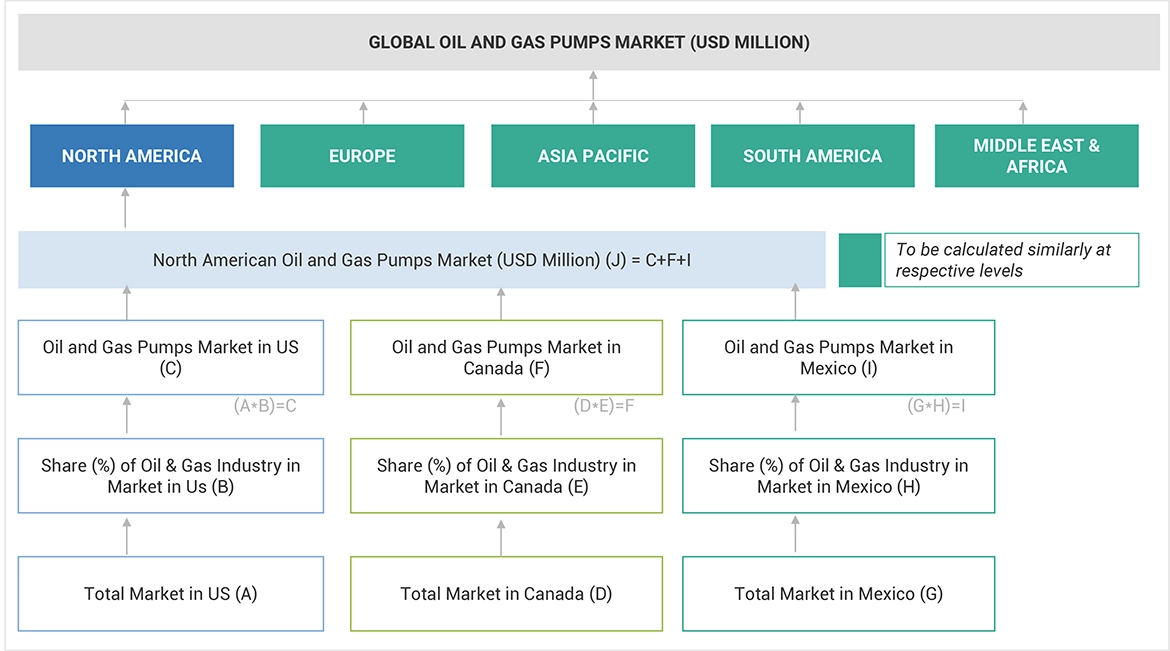
Oil and Gas Pumps Market Size: Bottom-Up Approach
Data Triangulation
After arriving at the overall market size from the above estimation process, the total market has been split into several segments and subsegments. Data triangulation and market breakdown processes have been employed to complete the overall market engineering process and arrive at the exact statistics for all the segments and sub-segments, wherever applicable. The data has been triangulated by studying various factors and trends from both the demand- and supply sides. Along with this, the market has been validated using both the top-down and bottom-up approaches.
Market Definition
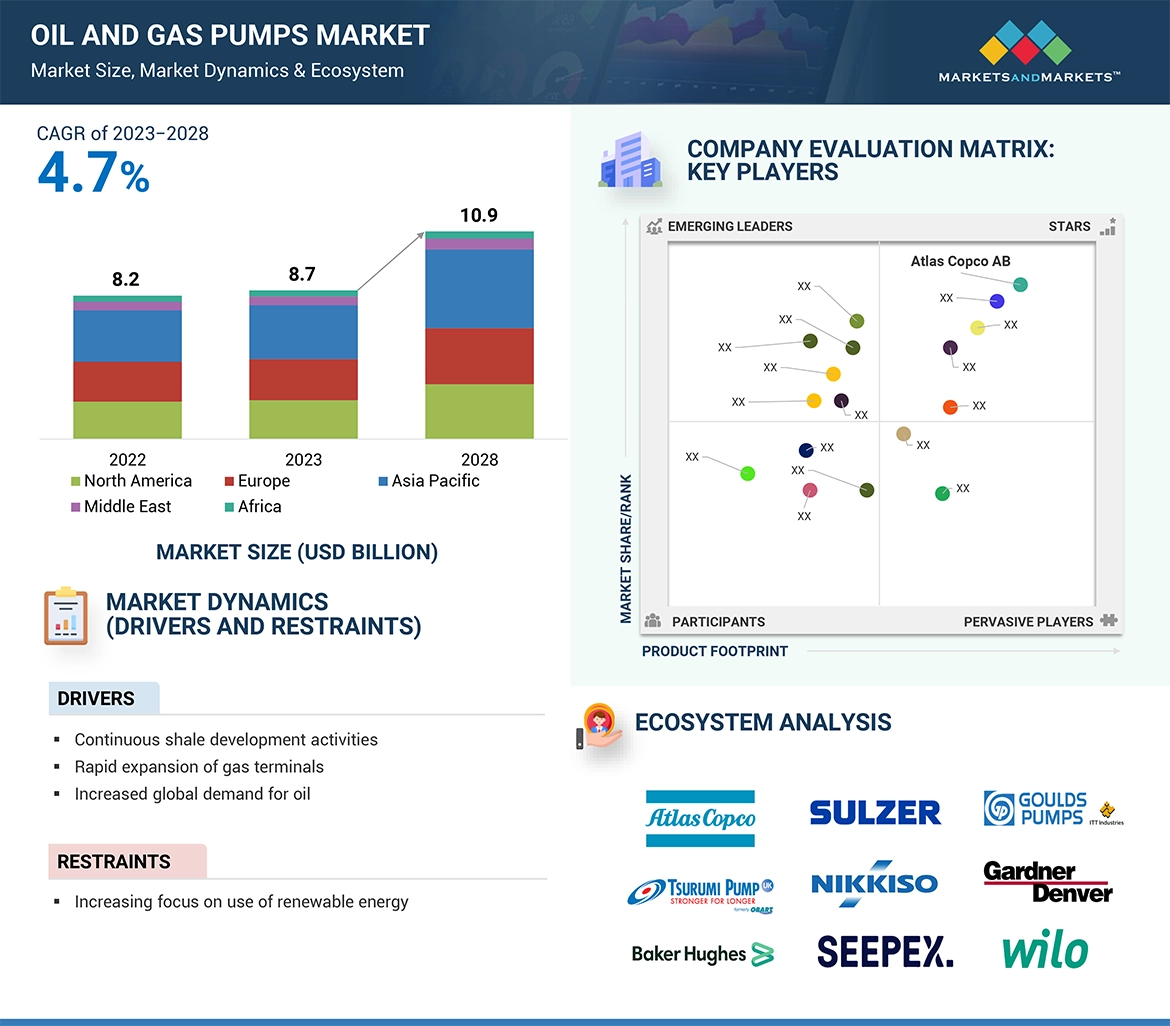
Pumps play a crucial role within the oil and gas sector, facilitating fluid transportation across upstream drilling sites, crude oil pipelines, and LNG export terminals. Traditionally powered by fixed-speed electric motors, they've now largely transitioned to variable-speed electric motors. These motors, linked with pumps, mitigate equipment failure risks by minimizing both electrical and mechanical strains, thereby reducing operational downtimes.
Stakeholders
-
Energy Regulators
-
Consulting companies in the energy and power sector
-
Distributors of oil & gas pumps solutions
-
Governments and research organizations
-
Power equipment and garden tool manufacturers
-
Oil & gas pumps providers
-
Spare parts and component suppliers
Report Objectives
-
To define, describe, and forecast the oil and gas pumps market based on type, pump type, application and region in terms of value
-
To define, describe, and forecast the market across five key regions, namely, North America, Europe, Asia Pacific, Middle East & Africa, and South America, along with the country-level market analyses in terms of value
-
To provide detailed information about industry-specific key drivers, restraints, opportunities, and challenges influencing the growth of the oil and gas pumps market
-
To strategically analyze the oil and gas pumps market with respect to individual growth trends, prospects, and contributions of each segment to the market
-
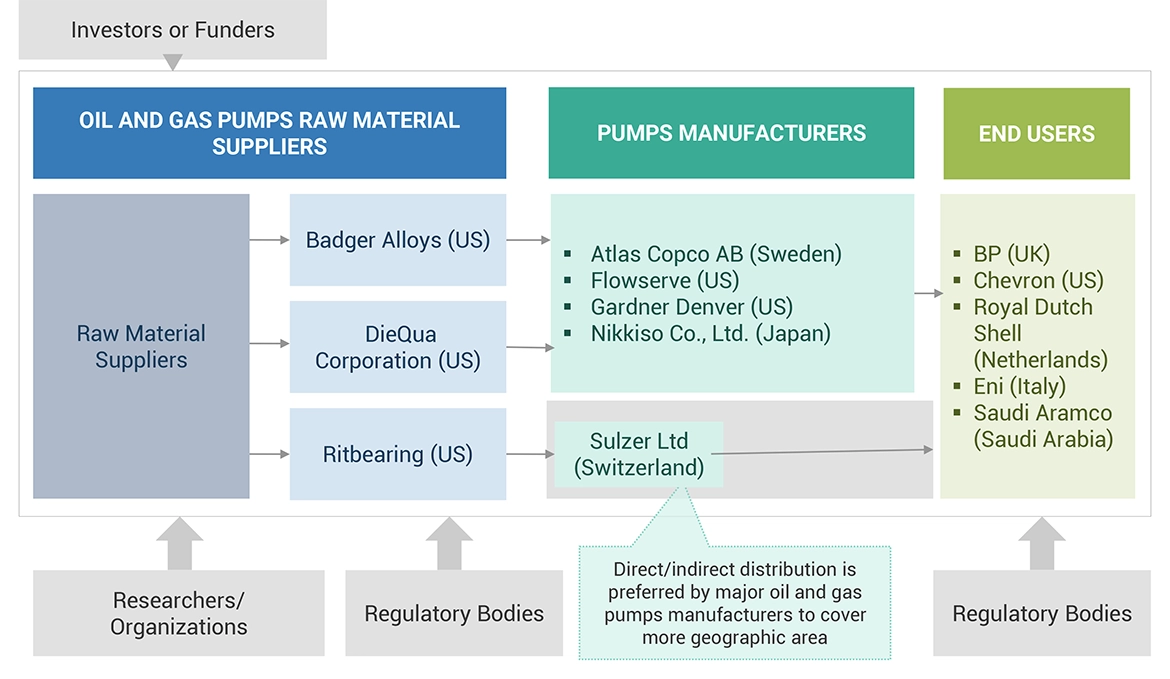
To provide information pertaining to the supply chain, trends/disruptions impacting customers’ businesses, market mapping, pricing of oil & gas pumps, and regulatory landscape pertaining to the oil and gas pumps market
-
To strategically analyze the micromarkets1 with respect to individual growth trends, upcoming expansions, and their contributions to the overall market
-
To analyze opportunities for stakeholders in the oil and gas pumps market and draw a competitive landscape for market players
-
To benchmark players within the market using the company evaluation matrix, which analyzes market players on various parameters within the broad categories of business and product strategies
-
To compare key market players with respect to the market share, product specifications, and applications
-
To strategically profile key players and comprehensively analyze their market ranking and core competencies2
-
To track and analyze competitive developments in the oil and gas pumps market, such as expansions, product launches, partnerships, and acquisitions.


 HIGHEST CAGR MARKET IN 2022
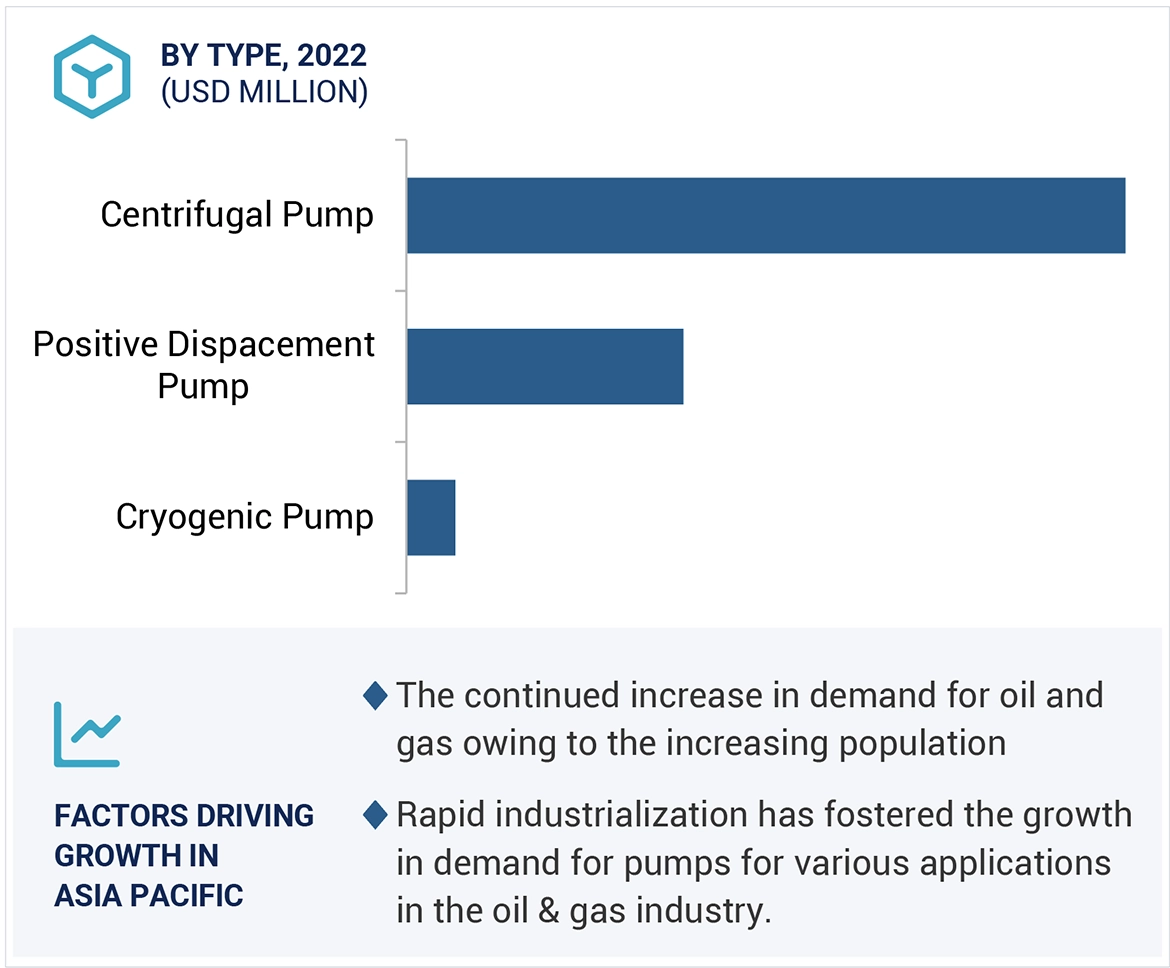


Growth opportunities and latent adjacency in Oil and Gas Pumps Market