Food Emulsifiers Market by Type (Mono and di-glycerides and their derivatives, Lecithin, Sorbitan esters, Polyglycerol esters, and Stearoyl lactylates), Source, Function (Emulsification, Starch Complexing, Protein Interaction, Aeration and Stabilization, Crystal Modification, Oil Structuring, Lubrication and Processing aids), Application and Region - Global Forecast to 2028
Food Emulsifiers Market Size, Share, and Industry Analysis (2023-2028)
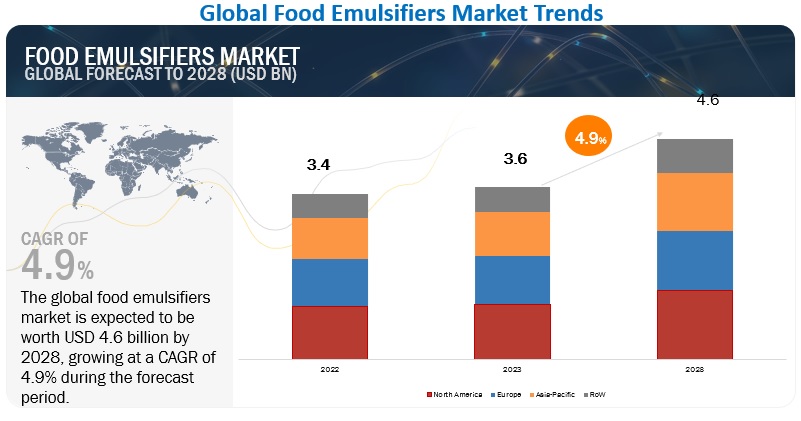
The global food emulsifiers market size is estimated to be valued at USD 3.6 billion in 2023. It is projected to reach USD 4.6 billion by 2028, recording a CAGR of 4.9% during the forecast period. Food emulsifiers have gained immense popularity in recent years due to their numerous benefits for improved texture and longer shelf life in food and beverage products. These food emulsifiers are added to food and beverages to create a smooth and consistent texture in foods that would otherwise normally separate or curdle, such as mayonnaise or ice cream. This improved texture can lead to greater consumer satisfaction, and can also improve the overall quality and value of the product. The global market is expected to grow at a significant pace in the coming years, owing to several factors that are driving the demand for these additives.
To know about the assumptions considered for the study, Request for Free Sample Report
To know about the assumptions considered for the study, download the pdf brochure
Food Emulsifiers Market Dynamics
Drivers: Increase in the consumption of convenience foods
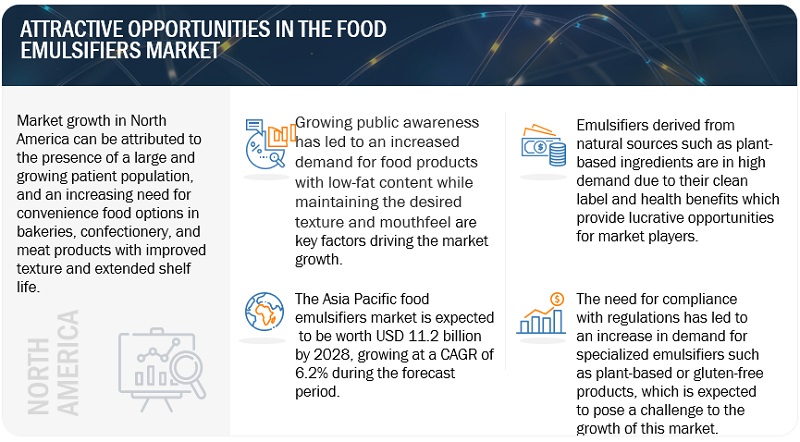
The food emulsifier market has experienced significant growth, largely driven by the increase in the consumption of convenience foods. Convenience foods refer to pre-prepared meals or ready-to-eat products that require minimal effort and time for preparation. Emulsifiers are extensively used in these products to ensure homogeneous mixing and prevent the settling of ingredients during storage. They also help create desirable textures and flavors that enhance the overall sensory experience of these products. The rise in demand for convenience foods is attributed to factors such as changes in lifestyle and work patterns, urbanization, and a need for faster and easier meal options. This trend is expected to continue, and the food emulsifier market is likely to witness sustained growth as a result.
Restraints: High costs associated with the extraction of food emulsifiers from natural resources
While the food emulsifier market has been growing rapidly, there are several factors that can restrain its growth, including limited extraction and additional costs associated with emulsifiers extracted from natural resources. Emulsifiers are often derived from natural resources like animal or plant fats, which can be both expensive and difficult to extract in large quantities. Consequently, this can lead to higher production expenses and result in higher prices for the end-consumers. Moreover, this limitation may lead to food loss or waste, as some ingredients are often discarded instead of being used to produce high-quality food products. Several factors contribute to the limited extraction and additional costs of natural emulsifiers, including the availability of raw materials, the complexity of the extraction process, and environmental regulations. To overcome these issues, the food industry is gradually turning to synthetic emulsifiers, which are often more readily available and less costly than their natural counterparts. While these synthetic emulsifiers have proven to be effective, there are concerns regarding their potential adverse effects on health and the environment. Therefore, continuous research and development efforts are required to address these challenges and ensure the sustainable growth of the food emulsifiers market.
Opportunities: Product innovations leading to better stabilization properties
Innovations in product development, particularly those related to the improvement of stabilization properties, are a significant opportunity for growth in the food emulsifier market. Emulsifiers play an essential role in stabilizing food products and enhancing their texture, appearance, and shelf life. Manufacturers are now developing a variety of starch-based emulsifiers from micro and nanoparticles, which are attributed to long-term stability in food emulsion systems, improving product structure, and shelf life. These starch-based emulsifiers are made using a variety of procedures and methods, including encapsulation, hydrolysis, cold gelatinization, dissolution-precipitation, sedimentation, and the addition of a hydrophobic element.
Challenges: Health problems associated with the consumption of emulsifiers
The food emulsifier market faces challenges due to the potential health risks associated with the consumption of emulsifiers. Emulsifiers, which are added to food products to improve their texture and shelf-life, have been linked to gut dysbiosis, increased intestinal permeability, weight gain, and other health problems such as allergic reactions and neurological disorders. As consumer awareness about the potential health risks of emulsifiers increases, there is a growing demand for safer and more natural alternatives. Therefore, food manufacturers need to invest in research and development to find alternative food additives that are less risky to health to address changing consumer preferences.
Food Emulsifiers Market Ecosystem
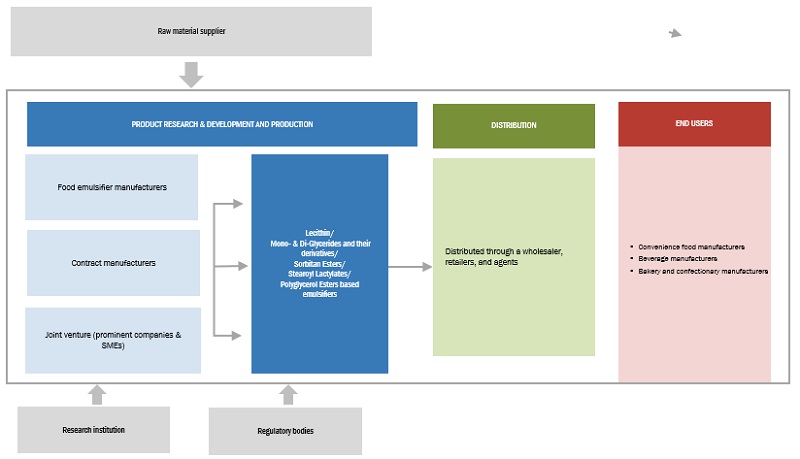
Prominent companies in this market include well-established, financially stable manufacturers of food emulsifiers. These companies have been operating in the market for several years and possess a diversified product portfolio, state-of-the-art technologies, and strong global sales and marketing networks. Prominent companies in this market are ADM (US), Cargill, Incorporated (US), Corbion (Netherlands), Ingredion (US), and Kerry Group plc. (Ireland).
Lecithin by type in the food emulsifiers market is projected to grow at the highest CAGR during the forecast period
The market growth of lecithin used as food emulsifiers has been increasing in recent years. Lecithin, a natural phospholipid found in various food sources, is widely used in the food industry to stabilize mixtures of oil and water, thereby improving the texture and appearance of many food products. One of the significant advantages of lecithin is its natural origin and cost-effectiveness, making it a popular choice among food manufacturers. Furthermore, the growing consumer demand for natural food ingredients and the potential health benefits associated with lecithin, including cognitive function improvement, lower cholesterol levels, and liver function improvement, is boosting the demand for lecithin as an emulsifier in the food industry.
Bakery products by application segment are estimated to be the largest segment over the forecasted period
The bakery products segment is expected to be the dominant application area in the food emulsifiers market, owing to several factors such as the increasing demand for bakery products and the benefits of emulsifiers in improving the texture, volume, and shelf-life of such products. Emulsifiers stabilize air bubbles formed during the baking process, resulting in lighter and fluffier baked goods, which are more visually appealing to consumers. The use of emulsifiers can also increase the shelf-life of baked goods and enhance their quality, appearance, and consistency, which is crucial for bakery products.
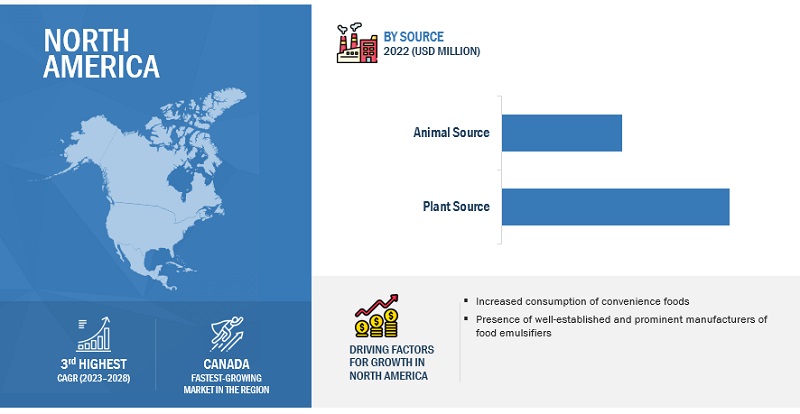
North America is projected to be the largest region in the food emulsifiers market, in 2022; it is anticipated to grow at a significant CAGR
The food emulsifiers market in North America is projected to be the largest region in 2022. This growth is primarily attributed to various factors, such as the increasing demand for convenience and processed food products, particularly in the United States. Consumers in the region are showing a preference for easy-to-prepare and ready-to-eat food products that require emulsifiers as a critical ingredient to maintain the product's stability and texture. The growing trend of clean label and organic food products, the increasing demand for bakery and confectionery products, and the popularity of functional food and beverages are also driving the growth of the food emulsifier market in North America. In addition, the presence of leading market players such as ADM (US), International Flavors & Fragrances Inc. (US), and Ingredion (US) in the region is further contributing to the growth of the food emulsifiers market in North America. These companies are making significant investments in research and development activities to introduce innovative and sustainable emulsifiers to the market.
Key Market Players
The key players in this market include ADM (US), Cargill, Incorporated (US), International Flavors & Fragrances Inc. (US), Ingredion (US), Kerry Group plc. (Ireland) and Corbion (Netherlands).
Scope of the Report
|
Report Metric |
Details |
|
Market size available for years |
2018–2028 |
|
Base year considered |
2022 |
|
Forecast period considered |
2023–2028 |
|
Units considered |
Value (USD), Volume (KT) |
|
Segments covered |
By Type, Source, Function, Application, and Region |
|
Regions covered |
North America, Asia Pacific, Europe, and RoW |
|
Companies studied |
|
This research report categorizes the food emulsifiers market, based on type, source, function, application, and region
By Type
- Mono- & Di-glycerides and their Derivatives
- Lecithin
- Sorbitan Esters
- Polyglycerol Esters
- Stearoyl Lactylates
- Other Types
By Source
- Plant Source
- Animal Source
By Function
- Emulsification
- Starch Complexing
- Protein Interaction
- Aeration and Stabilization
- Crystal Modification
- Oil Structuring
- Lubrication and Processing aids
By Application
- Bakery Products
- Dairy & Frozen Desserts
- Confectionery Products
- Convenience Foods
- Meat Products
- Other Applications
By Region
- North America
- Europe
- Asia Pacific
- Rest of the World (RoW)
Recent Developments
- In February 2023, Corbion (Netherlands) partnered with Belgium-based company Azelis as a distribution partner for food ingredients including food emulsifiers in Malaysia and Singapore. Azelis has already been representing Corbion’s food ingredients in India and Indonesia before. This helped the company strengthen its presence in the APAC region and boost the sales of food emulsifiers.
- In February 2021, International Flavors & Fragrances (US) merged its taste and nutrition business with DuPont’s (US) Nutrition & Biosciences business. This merger helped the company gain market share globally and become one of the global industry leaders in the nutrition and biosciences segment. This helped the company expand its product portfolio for nutrition and biosciences-related segments including food emulsifiers, scent, soy proteins, etc.
- In June 2020, Palsgaard (Denmark) invested approximately USD 114 million in its existing Danish facility to double its production facility. This will help the company produce more food emulsifiers and meet the increasing demand for emulsifiers globally.
Frequently Asked Questions (FAQ):
Which region is projected to have the fastest growth in the food emulsifiers market?
Asia Pacific is projected to be the fastest-growing region in the food emulsifiers market with a significant CAGR during the forecast period; it is also estimated to have a significant value in 2023.
What is the current size of the global food emulsifiers market? What are the market drivers?
The global food emulsifiers market is estimated to be valued at USD 3.6 billion in 2023. It is projected to reach USD 4.6 billion by 2028, recording a CAGR of 4.9% during the forecast period.
Increase in consumption of convenience foods
Which are the key players in the market, and how intense is the competition?
Key players in this market include ADM (US), Cargill, Incorporated (US), International Flavors & Fragrances Inc. (US), Ingredion (US), Kerry Group plc. (Ireland) and Corbion (Netherlands). Since food emulsifiers are a fast-growing market, with a lot of unexplored potential, the existing players are fixated on expanding their production capacities, while startups are being established rapidly. The food emulsifiers market can be classified as a competitive market as it has a mix of both large and small number players and none of them account for a major part of the market share. The large players are present at the global level, and unorganized players are present at the local level in several countries.
What are the restraining factors limiting growth in the food emulsifiers market?
High costs associated with the extraction of food emulsifiers from natural resources.
Which food emulsifier type is projected to dominate the food emulsifiers market?
Mono- & Di-Glycerides and Their Derivatives types are projected to dominate the food emulsifiers market.
To speak to our analyst for a discussion on the above findings, click Speak to Analyst


- 5.1 INTRODUCTION
-
5.2 MARKET DYNAMICSDRIVERS- Increase in consumption of convenience foods to boost demand for high-quality and premium food products- Growing number of end-use applications due to multi-functional attributes of emulsifiersRESTRAINTS- Limited extraction and additional costs associated with emulsifiers extracted from natural resourcesOPPORTUNITIES- Product innovations to promote better stabilization properties and lower costsCHALLENGES- Health problems with consumption of emulsifiers, to limit demand due to post-COVID-19 consumer behavior and altering choices
- 6.1 INTRODUCTION
-
6.2 VALUE CHAIN ANALYSISRAW MATERIAL SOURCINGMANUFACTURING OF FOOD EMULSIFIERSQUALITY AND SAFETY CONTROLLERSPACKAGINGMARKETING & DISTRIBUTIONEND-USE INDUSTRY
- 6.3 SUPPLY CHAIN ANALYSIS
- 6.4 TECHNOLOGY ANALYSIS
-
6.5 TRADE DATA: FOOD EMULSIFIERS MARKETOTHER FOOD EMULSIFIERSFOOD EMULSIFIERS AND OTHER FOOD EMULSIFIERS
- 6.6 PRICING ANALYSIS: FOOD EMULSIFIERS MARKET
-
6.7 MARKET MAP AND ECOSYSTEM OF FOOD EMULSIFIERS MARKETDEMAND SIDESUPPLY SIDE
- 6.8 TRENDS IMPACTING BUYERS
-
6.9 FOOD EMULSIFIERS: PATENT ANALYSIS
-
6.10 PORTER’S FIVE FORCES ANALYSISINTENSITY OF COMPETITIVE RIVALRYBARGAINING POWER OF SUPPLIERSBARGAINING POWER OF BUYERSTHREAT OF SUBSTITUTESTHREAT OF NEW ENTRANTS
-
6.11 CASE STUDIES
-
6.12 REGULATORY FRAMEWORKINTRODUCTIONEUROPEAN UNIONUS- Generally recognized as safe (GRAS)- Codex alimentariusCANADAJAPANINDIA
- 7.1 INTRODUCTION
-
7.2 BAKERY PRODUCTSYEAST-RAISED BAKERY PRODUCTS TO INCREASE USAGE OF EMULSIFIERS
-
7.3 DAIRY & FROZEN DESSERTSVARIETY OF PRODUCTS USING EMULSIFIERS TO BOOST MARKET
-
7.4 CONFECTIONERY PRODUCTSEMULSIFIERS TO AID IN PROCESSING AND STORAGE
-
7.5 CONVENIENCE FOODSINCREASE IN DEMAND FOR HEALTHIER CONVENIENCE FOODS TO DRIVE DEMAND FOR EMULSIFIERS
-
7.6 MEAT PRODUCTSCOST-EFFICIENCY DUE TO ADDITION OF EMULSIFIERS TO BOOST MARKET GROWTH
- 7.7 OTHER APPLICATIONS
- 8.1 INTRODUCTION
- 8.2 EMULSIFICATION
- 8.3 STARCH COMPLEXING
- 8.4 PROTEIN INTERACTION
- 8.5 AERATION AND STABILIZATION
- 8.6 CRYSTAL MODIFICATION
- 8.7 OIL STRUCTURING
- 8.8 LUBRICATION AND PROCESSING AIDS
- 9.1 INTRODUCTION
-
9.2 PLANT SOURCEDEMAND FOR VEGAN FOOD PRODUCTS TO DRIVE PLANT-SOURCED FOOD EMULSIFIERS MARKET
-
9.3 ANIMAL SOURCEDEMAND FOR LOW-FAT FOOD TO DRIVE GELATIN-BASED EMULSIFIERS MARKET
- 10.1 INTRODUCTION
-
10.2 MONO- & DI-GLYCERIDES AND THEIR DERIVATIVESWIDE RANGE OF FUNCTIONALITIES TO BOOST APPLICATIONS
-
10.3 LECITHININCREASING DEMAND FOR VEGAN PRODUCTS TO DRIVE GROWTH FOR PLANT-SOURCED LECITHIN
-
10.4 SORBITAN ESTERSAERATION PROPERTY OF SORBITAN ESTERS TO WIDEN ITS SCOPE OF APPLICATION AND DRIVE GROWTH
-
10.5 POLYGLYCEROL ESTERSCOST-EFFICIENCY ASSOCIATED WITH USAGE OF POLYGLYCEROL ESTERS TO DRIVE MARKET GROWTH
-
10.6 STEAROYL LACTYLATESDOUGH STRENGTHENING AND FOAMING PROPERTIES TO WIDEN USAGE OF STEAROYL LACTYLATES IN BAKERY INDUSTRY
- 10.7 OTHER TYPES
- 11.1 INTRODUCTION
- 11.2 RECESSION IMPACT ON FOOD EMULSIFIERS MARKET
- 11.3 1.2.1 MACRO INDICATORS OF RECESSION
-
11.4 NORTH AMERICANORTH AMERICA: RECESSION IMPACT ANALYSISUS- Market saturation to lead to steady growth rate in marketCANADA- Growing demand for emulsifiers in extensive range of food products to drive marketMEXICO- Distinctive use of emulsifiers in food products to drive market
-
11.5 EUROPEEUROPE RECESSION IMPACT ANALYSISGERMANY- Growing food & beverage industry to boost demand for processed food productsFRANCE- New food products with low-fat content to experience high demandITALY- Artisanal products to be at forefront of packaged food marketUK- Growing health awareness to drive demand for food emulsifiersSPAIN- Market to witness increasing demand due to growing food & beverage industry and changing lifestyles of peopleREST OF EUROPE- Market for emulsifiers to be driven by significant consumption of processed food products
-
11.6 ASIA PACIFICASIA PACIFIC RECESSION IMPACT ANALYSISCHINA- Technological and product-related advancements to lead to higher adoption of emulsifiersJAPAN- Rising demand for RTE meals to drive marketINDIA- Rising demand for healthier products to lead to adoption of food emulsifiersAUSTRALIA & NEW ZEALAND- Increasing demand for healthier food products to drive growthSOUTH KOREA- Ease of usage due to labeling allowances to drive marketREST OF ASIA PACIFIC- Rising demand for healthier food products to aid usage of emulsifiers
-
11.7 REST OF THE WORLDROW RECESSION IMPACT ANALYSISSOUTH AMERICA- Increasing awareness about quality of bakery, processed food, and dairy products to drive demandAFRICA- Food & beverage industry to witness increasing demandMIDDLE EAST- Growing base of food processing & production units to fuel market growth

- 12.1 OVERVIEW
- 12.2 SEGMENTAL REVENUE ANALYSIS OF KEY PLAYERS
- 12.3 STRATEGIES ADOPTED BY KEY PLAYERS
- 12.4 MARKET SHARE ANALYSIS, 2022
-
12.5 COMPANY EVALUATION QUADRANT (KEY PLAYERS)STARSEMERGING LEADERSPERVASIVE PLAYERSPARTICIPANTSPRODUCT FOOTPRINT
-
12.6 STARTUPS/SMES EVALUATION QUADRANT (OTHER PLAYERS)PROGRESSIVE COMPANIESSTARTING BLOCKSRESPONSIVE COMPANIESDYNAMIC COMPANIESCOMPETITIVE BENCHMARKING OF KEY STARTUPS/SMES
-
12.7 COMPETITIVE SCENARIOPRODUCT LAUNCHESDEALSOTHERS
-
13.1 KEY PLAYERSADM- Business overview- Products/Solutions/Services offered- MnM viewCARGILL, INCORPORATED- Business overview- Products/Solutions/Services offered- MnM viewINTERNATIONAL FLAVORS & FRAGRANCES INC.- Business overview- Products/Solutions/Services offered- Recent developments- MnM viewINGREDION- Business overview- Products/Solutions/Services offered- Recent developments- MnM viewKERRY GROUP PLC- Business overview- Products/Solutions/Services offered- Recent developments- MnM viewCORBION- Business overview- Products/Solutions/Services offered- Recent developments- MnM viewPALSGAARD- Business overview- Products/Solutions/Services offered- Recent developments- MnM viewRIKEN VITAMIN CO., LTD.- Business overview- Products/Solutions/Services offered- MnM viewTATE & LYLE- Business overview- Products/Solutions/Services offered- Recent developments- MnM viewFOODCHEM INTERNATIONAL CORPORATION- Business overview- Products/Solutions/Services offered- MnM viewABF INGREDIENTS- Business overview- Products/Solutions/Services offered- MnM viewFINE ORGANICS- Business overview- Products/Solutions/Services offered- MnM viewBASF SE- Business overview- Products/Solutions/Services offered- MnM viewSTEPAN COMPANY- Business overview- Products/Solutions/Services offered- Recent developments- MnM viewAMERICAN LECITHIN COMPANY- Business overview- Products/Solutions/Services offered- MnM view
-
13.2 OTHER PLAYERSGSI- Business overview- Products/Solutions/Services offered- MnM viewLASENOR EMUL, S.L.- Business overview- Products/Solutions/Services offered- Recent developments- MnM viewBARENTZ- Business overview- Products/Solutions/Services offered- Recent developments- MnM viewMITSUBISHI CHEMICAL CORPORATION- Business overview- Products/Solutions/Services offered- Recent developments- MnM viewPURATOS- Business overview- Products/Solutions/Services offered- Recent developments- MnM viewSISTERNAESTELLE CHEMICALS PVT. LTD.LECICO GMBHJEEVIKA YUGCHEM PRIVATE LTD.SAVANNAH SURFACTANTS LTD.
- 14.1 INTRODUCTION
- 14.2 LIMITATIONS
-
14.3 SUCROSE ESTERS MARKETMARKET DEFINITIONMARKET OVERVIEWSUCROSE ESTERS MARKET, BY APPLICATION
-
14.4 BAKERY PREMIXES MARKETMARKET DEFINITIONMARKET OVERVIEWBAKERY PREMIXES MARKET, BY APPLICATION
- 15.1 DISCUSSION GUIDE
- 15.2 KNOWLEDGESTORE: MARKETSANDMARKETS’ SUBSCRIPTION PORTAL
- 15.3 CUSTOMIZATION OPTIONS
- 15.4 RELATED REPORTS
- 15.5 AUTHOR DETAILS
- TABLE 1 USD EXCHANGE RATES CONSIDERED, 2018–2022
- TABLE 2 FOOD EMULSIFIERS MARKET SNAPSHOT, 2023 VS. 2028
- TABLE 3 TOP IMPORTERS OF LECITHINS AND OTHER PHOSPHOAMINOLIPIDS, 2021 (KG)
- TABLE 4 TOP EXPORTERS OF LECITHINS & OTHER PHOSPHOAMINOLIPIDS, 2019 (KG)
- TABLE 5 AVERAGE SELLING PRICE (ASP) OF FOOD EMULSIFIERS, BY TYPE, 2020–2022 (USD/TON)
- TABLE 6 AVERAGE SELLING PRICE (ASP) OF FOOD EMULSIFIERS, BY REGION, 2020–2022 (USD/TON)
- TABLE 7 FOOD EMULSIFIERS MARKET: SUPPLY CHAIN (ECOSYSTEM)
- TABLE 8 SOME PATENTS PERTAINING TO FOOD EMULSIFIERS, 2019–2021
- TABLE 9 FOOD EMULSIFIERS MARKET: PORTER’S FIVE FORCES ANALYSIS
- TABLE 10 SEEKING ALTERNATIVE SOLUTIONS FOR SUNFLOWER LECITHIN
- TABLE 11 DEVELOPING INSTANT NOODLE PRODUCTS WITH IMPROVED TEXTURE AND CLEAN-LABEL INGREDIENTS
- TABLE 12 LIST OF FOOD EMULSIFIERS IN ANNEX I
- TABLE 13 LIST OF FOOD EMULSIFIERS IN ANNEX IV
- TABLE 14 LIST OF EMULSIFYING AGENTS PERMITTED IN FOODS IN CANADA
- TABLE 15 LIST OF FOOD EMULSIFIERS WITH PERMITS IN JAPAN
- TABLE 16 LIST OF FOOD EMULSIFIERS AND THEIR INS NUMBER
- TABLE 17 FOOD EMULSIFIERS MARKET, BY APPLICATION, 2018–2022 (USD MILLION)
- TABLE 18 FOOD EMULSIFIERS MARKET, BY APPLICATION, 2023–2028 (USD MILLION)
- TABLE 19 BAKERY PRODUCTS: FOOD EMULSIFIERS MARKET, BY REGION, 2018–2022 (USD MILLION)
- TABLE 20 BAKERY PRODUCTS: FOOD EMULSIFIERS MARKET, BY REGION, 2023–2028 (USD MILLION)
- TABLE 21 DAIRY & FROZEN DESSERTS: FOOD EMULSIFIERS MARKET, BY REGION, 2018–2022 (USD MILLION)
- TABLE 22 DAIRY & FROZEN DESSERTS: FOOD EMULSIFIERS MARKET, BY REGION, 2023–2028 (USD MILLION)
- TABLE 23 CONFECTIONERY PRODUCTS: FOOD EMULSIFIERS MARKET, BY REGION, 2018–2022 (USD MILLION)
- TABLE 24 CONFECTIONERY PRODUCTS: FOOD EMULSIFIERS MARKET, BY REGION, 2023–2028 (USD MILLION)
- TABLE 25 CONVENIENCE FOODS: FOOD EMULSIFIERS MARKET, BY REGION, 2018–2022 (USD MILLION)
- TABLE 26 CONVENIENCE FOODS: FOOD EMULSIFIERS MARKET, BY REGION, 2023–2028 (USD MILLION)
- TABLE 27 MEAT PRODUCTS: FOOD EMULSIFIERS MARKET, BY REGION, 2018–2022 (USD MILLION)
- TABLE 28 MEAT PRODUCTS: FOOD EMULSIFIERS MARKET, BY REGION, 2023–2028 (USD MILLION)
- TABLE 29 OTHER APPLICATIONS: FOOD EMULSIFIERS MARKET, BY REGION, 2018–2022 (USD MILLION)
- TABLE 30 OTHER APPLICATIONS: FOOD EMULSIFIERS MARKET, BY REGION, 2023–2028 (USD MILLION)
- TABLE 31 FOOD EMULSIFIERS MARKET, BY SOURCE, 2018–2022 (USD MILLION)
- TABLE 32 FOOD EMULSIFIERS MARKET, BY SOURCE, 2023–2028 (USD MILLION)
- TABLE 33 PLANT-SOURCED EMULSIFIERS MARKET, BY REGION, 2018–2022 (USD MILLION)
- TABLE 34 PLANT-SOURCED EMULSIFIERS MARKET, BY REGION, 2023–2028 (USD MILLION)
- TABLE 35 ANIMAL-DERIVED FOOD ADDITIVES
- TABLE 36 ANIMAL-SOURCED EMULSIFIERS MARKET, BY REGION, 2018–2022 (USD MILLION)
- TABLE 37 ANIMAL-SOURCED EMULSIFIERS MARKET, BY REGION, 2023–2028 (USD MILLION)
- TABLE 38 FOOD EMULSIFIERS MARKET, BY TYPE, 2018–2022 (USD MILLION)
- TABLE 39 FOOD EMULSIFIERS MARKET, BY TYPE, 2023–2028 (USD MILLION)
- TABLE 40 FOOD EMULSIFIERS MARKET, BY TYPE, 2018–2022 (KT)
- TABLE 41 FOOD EMULSIFIERS MARKET, BY TYPE, 2023–2028 (KT)
- TABLE 42 MONO- & DI-GLYCERIDES AND THEIR DERIVATIVES MARKET, BY REGION, 2018–2022 (USD MILLION)
- TABLE 43 MONO- & DI-GLYCERIDES AND THEIR DERIVATIVES MARKET, BY REGION, 2023–2028 (USD MILLION)
- TABLE 44 MONO- & DI-GLYCERIDES AND THEIR DERIVATIVES MARKET, BY REGION, 2018–2022 (KT)
- TABLE 45 MONO- & DI-GLYCERIDES AND THEIR DERIVATIVES MARKET, BY REGION, 2023–2028 (KT)
- TABLE 46 LECITHIN MARKET, BY REGION, 2018–2022 (USD MILLION)
- TABLE 47 LECITHIN MARKET, BY REGION, 2023–2028 (USD MILLION)
- TABLE 48 LECITHIN MARKET, BY REGION, 2018–2022 (KT)
- TABLE 49 LECITHIN MARKET, BY REGION, 2023–2028 (KT)
- TABLE 50 SORBITAN ESTERS MARKET, BY REGION, 2018–2022 (USD MILLION)
- TABLE 51 SORBITAN ESTERS MARKET, BY REGION, 2023–2028 (USD MILLION)
- TABLE 52 SORBITAN ESTERS MARKET, BY REGION, 2018–2022 (KT)
- TABLE 53 SORBITAN ESTERS MARKET, BY REGION, 2023–2028 (KT)
- TABLE 54 POLYGLYCEROL ESTERS MARKET, BY REGION, 2018–2022 (USD MILLION)
- TABLE 55 POLYGLYCEROL ESTERS MARKET, BY REGION, 2023–2028 (USD MILLION)
- TABLE 56 POLYGLYCEROL ESTERS MARKET, BY REGION, 2018–2022 (KT)
- TABLE 57 POLYGLYCEROL ESTERS MARKET, BY REGION, 2023–2028 (KT)
- TABLE 58 STEAROYL LACTYLATES MARKET, BY REGION, 2018–2022 (USD MILLION)
- TABLE 59 STEAROYL LACTYLATES MARKET, BY REGION, 2023–2028 (USD MILLION)
- TABLE 60 STEAROYL LACTYLATES MARKET, BY REGION, 2018–2022 (KT)
- TABLE 61 STEAROYL LACTYLATES MARKET, BY REGION, 2023–2028 (KT)
- TABLE 62 OTHER TYPES MARKET, BY REGION, 2018–2022 (USD MILLION)
- TABLE 63 OTHER TYPES MARKET, BY REGION, 2023–2028 (USD MILLION)
- TABLE 64 OTHER TYPES MARKET, BY REGION, 2018–2022 (KT)
- TABLE 65 OTHER TYPES MARKET, BY REGION, 2023–2028 (KT)
- TABLE 66 FOOD EMULSIFIERS MARKET, BY REGION, 2018–2022 (USD MILLION)
- TABLE 67 FOOD EMULSIFIERS MARKET, BY REGION, 2023–2028 (USD MILLION)
- TABLE 68 NORTH AMERICA: FOOD EMULSIFIERS MARKET, BY COUNTRY, 2018–2022 (USD MILLION)
- TABLE 69 NORTH AMERICA: FOOD EMULSIFIERS MARKET, BY COUNTRY, 2023–2028 (USD MILLION)
- TABLE 70 NORTH AMERICA: FOOD EMULSIFIERS MARKET, BY TYPE, 2018–2022 (USD MILLION)
- TABLE 71 NORTH AMERICA: FOOD EMULSIFIERS MARKET, BY TYPE, 2023–2028 (USD MILLION)
- TABLE 72 NORTH AMERICA: FOOD EMULSIFIERS MARKET, BY TYPE, 2018–2022 (KT)
- TABLE 73 NORTH AMERICA: FOOD EMULSIFIERS MARKET, BY TYPE, 2023–2028 (KT)
- TABLE 74 NORTH AMERICA: FOOD EMULSIFIERS MARKET, BY SOURCE, 2018–2022 (USD MILLION)
- TABLE 75 NORTH AMERICA: FOOD EMULSIFIERS MARKET, BY SOURCE, 2023–2028 (USD MILLION)
- TABLE 76 NORTH AMERICA: FOOD EMULSIFIERS MARKET, BY APPLICATION, 2018–2022 (USD MILLION)
- TABLE 77 NORTH AMERICA: FOOD EMULSIFIERS MARKET, BY APPLICATION, 2023–2028 (USD MILLION)
- TABLE 78 US: FOOD EMULSIFIERS MARKET, BY APPLICATION, 2018–2022 (USD MILLION)
- TABLE 79 US: FOOD EMULSIFIERS MARKET, BY APPLICATION, 2023–2028 (USD MILLION)
- TABLE 80 CANADA: FOOD EMULSIFIERS MARKET, BY APPLICATION, 2018–2022 (USD MILLION)
- TABLE 81 CANADA: FOOD EMULSIFIERS MARKET, BY APPLICATION, 2023–2028 (USD MILLION)
- TABLE 82 MEXICO: FOOD EMULSIFIERS MARKET, BY APPLICATION, 2018–2022 (USD MILLION)
- TABLE 83 MEXICO: FOOD EMULSIFIERS MARKET, BY APPLICATION, 2023–2028 (USD MILLION)
- TABLE 84 EUROPE: FOOD EMULSIFIERS MARKET, BY COUNTRY, 2018–2022 (USD MILLION)
- TABLE 85 EUROPE: FOOD EMULSIFIERS MARKET, BY COUNTRY, 2023–2028 (USD MILLION)
- TABLE 86 EUROPE: FOOD EMULSIFIERS MARKET, BY TYPE, 2018–2022 (USD MILLION)
- TABLE 87 EUROPE: FOOD EMULSIFIERS MARKET, BY TYPE, 2023–2028 USD MILLION)
- TABLE 88 EUROPE: FOOD EMULSIFIERS MARKET, BY TYPE, 2018–2022 (KT)
- TABLE 89 EUROPE: FOOD EMULSIFIERS MARKET, BY TYPE, 2023–2028 (KT)
- TABLE 90 EUROPE: FOOD EMULSIFIERS MARKET, BY SOURCE, 2018–2022 (USD MILLION)
- TABLE 91 EUROPE: FOOD EMULSIFIERS MARKET, BY SOURCE, 2023–2028 (USD MILLION)
- TABLE 92 EUROPE: FOOD EMULSIFIERS MARKET, BY APPLICATION, 2018–2022 (USD MILLION)
- TABLE 93 EUROPE: FOOD EMULSIFIERS MARKET, BY APPLICATION, 2023–2028 (USD MILLION)
- TABLE 94 GERMANY: FOOD EMULSIFIERS MARKET, BY APPLICATION, 2018–2022 (USD MILLION)
- TABLE 95 GERMANY: FOOD EMULSIFIERS MARKET, BY APPLICATION, 2023–2028 (USD MILLION)
- TABLE 96 FRANCE: FOOD EMULSIFIERS MARKET, BY APPLICATION, 2018–2022 (USD MILLION)
- TABLE 97 FRANCE: FOOD EMULSIFIERS MARKET, BY APPLICATION, 2023–2028 (USD MILLION)
- TABLE 98 ITALY: FOOD EMULSIFIERS MARKET, BY APPLICATION, 2018–2022 (USD MILLION)
- TABLE 99 ITALY: FOOD EMULSIFIERS MARKET, BY APPLICATION, 2023–2028 (USD MILLION)
- TABLE 100 UK: FOOD EMULSIFIERS MARKET, BY APPLICATION, 2018–2022 (USD MILLION)
- TABLE 101 UK: FOOD EMULSIFIERS MARKET, BY APPLICATION, 2023–2028 (USD MILLION)
- TABLE 102 SPAIN: FOOD EMULSIFIERS MARKET, BY APPLICATION, 2018–2022 (USD MILLION)
- TABLE 103 SPAIN: FOOD EMULSIFIERS MARKET, BY APPLICATION, 2023–2028 (USD MILLION)
- TABLE 104 REST OF EUROPE: FOOD EMULSIFIERS MARKET, BY APPLICATION, 2018–2022 (USD MILLION)
- TABLE 105 REST OF EUROPE: FOOD EMULSIFIERS MARKET, BY APPLICATION, 2023–2028 (USD MILLION)
- TABLE 106 ASIA-PACIFIC: FOOD EMULSIFIERS MARKET, BY COUNTRY, 2018–2022 (USD MILLION)
- TABLE 107 ASIA-PACIFIC: FOOD EMULSIFIERS MARKET, BY COUNTRY, 2023–2028 (USD MILLION)
- TABLE 108 ASIA-PACIFIC: FOOD EMULSIFIERS MARKET, BY TYPE, 2018–2022 (USD MILLION)
- TABLE 109 ASIA PACIFIC: FOOD EMULSIFIERS MARKET, BY TYPE, 2023–2028 (USD MILLION)
- TABLE 110 ASIA PACIFIC: FOOD EMULSIFIERS MARKET, BY TYPE, 2018–2022 (KT)
- TABLE 111 ASIA PACIFIC: FOOD EMULSIFIERS MARKET, BY TYPE, 2023–2028 (KT)
- TABLE 112 ASIA PACIFIC: FOOD EMULSIFIERS MARKET, BY SOURCE, 2018–2022 (USD MILLION)
- TABLE 113 ASIA PACIFIC: FOOD EMULSIFIERS MARKET, BY SOURCE, 2023–2028 (USD MILLION)
- TABLE 114 ASIA PACIFIC: FOOD EMULSIFIERS MARKET, BY APPLICATION, 2018–2022 (USD MILLION)
- TABLE 115 ASIA PACIFIC: FOOD EMULSIFIERS MARKET, BY APPLICATION, 2023–2028 (USD MILLION)
- TABLE 116 CHINA: FOOD EMULSIFIERS MARKET, BY APPLICATION, 2018–2022 (USD MILLION)
- TABLE 117 CHINA: FOOD EMULSIFIERS MARKET, BY APPLICATION, 2023–2028 (USD MILLION)
- TABLE 118 JAPAN: FOOD EMULSIFIERS MARKET, BY APPLICATION, 2018–2022 (USD MILLION)
- TABLE 119 JAPAN: FOOD EMULSIFIERS MARKET, BY APPLICATION, 2023–2028 (USD MILLION)
- TABLE 120 INDIA: FOOD EMULSIFIERS MARKET, BY APPLICATION, 2018–2022 (USD MILLION)
- TABLE 121 INDIA: FOOD EMULSIFIERS MARKET, BY APPLICATION, 2023–2028 (USD MILLION)
- TABLE 122 AUSTRALIA & NEW ZEALAND: FOOD EMULSIFIERS MARKET, BY APPLICATION, 2018–2022 (USD MILLION)
- TABLE 123 AUSTRALIA & NEW ZEALAND: FOOD EMULSIFIERS MARKET, BY APPLICATION, 2023–2028 (USD MILLION)
- TABLE 124 SOUTH KOREA: FOOD EMULSIFIERS MARKET, BY APPLICATION, 2018–2022 (USD MILLION)
- TABLE 125 SOUTH KOREA: FOOD EMULSIFIERS MARKET, BY APPLICATION, 2023–2028 (USD MILLION)
- TABLE 126 REST OF ASIA-PACIFIC: FOOD EMULSIFIERS MARKET, BY APPLICATION, 2018–2022 (USD MILLION)
- TABLE 127 REST OF ASIA PACIFIC: FOOD EMULSIFIERS MARKET, BY APPLICATION, 2023–2028 (USD MILLION)
- TABLE 128 ROW: FOOD EMULSIFIERS MARKET, BY COUNTRY, 2018–2022 (USD MILLION)
- TABLE 129 ROW: FOOD EMULSIFIERS MARKET, BY COUNTRY, 2023–2028 (USD MILLION)
- TABLE 130 ROW: FOOD EMULSIFIERS MARKET, BY TYPE, 2018–2022 (USD MILLION)
- TABLE 131 ROW: FOOD EMULSIFIERS MARKET, BY TYPE, 2023–2028 (USD MILLION)
- TABLE 132 ROW: FOOD EMULSIFIERS MARKET, BY TYPE, 2018–2022 (KT)
- TABLE 133 ROW: FOOD EMULSIFIERS MARKET, BY TYPE, 2023–2028 (KT)
- TABLE 134 ROW: FOOD EMULSIFIERS MARKET, BY SOURCE, 2018–2022 (USD MILLION)
- TABLE 135 ROW: FOOD EMULSIFIERS MARKET, BY SOURCE, 2023–2028 (USD MILLION)
- TABLE 136 ROW: FOOD EMULSIFIERS MARKET, BY APPLICATION, 2018–2022 (USD MILLION)
- TABLE 137 ROW: FOOD EMULSIFIERS MARKET, BY APPLICATION, 2023–2028 (USD MILLION)
- TABLE 138 SOUTH AMERICA: FOOD EMULSIFIERS MARKET, BY APPLICATION, 2018–2022 (USD MILLION)
- TABLE 139 SOUTH AMERICA: FOOD EMULSIFIERS MARKET, BY APPLICATION, 2023–2028 (USD MILLION)
- TABLE 140 AFRICA: FOOD EMULSIFIERS MARKET, BY APPLICATION, 2018–2022 (USD MILLION)
- TABLE 141 AFRICA: FOOD EMULSIFIERS MARKET, BY APPLICATION, 2023–2028 (USD MILLION)
- TABLE 142 MIDDLE EAST: FOOD EMULSIFIERS MARKET, BY APPLICATION, 2018–2022 (USD MILLION)
- TABLE 143 MIDDLE EAST: FOOD EMULSIFIERS MARKET, BY APPLICATION, 2023–2028 (USD MILLION)
- TABLE 144 FOOD EMULSIFIERS MARKET: DEGREE OF COMPETITION, 2021
- TABLE 145 COMPANY TYPE FOOTPRINT
- TABLE 146 COMPANY APPLICATION FOOTPRINT
- TABLE 147 COMPANY REGIONAL FOOTPRINT
- TABLE 148 OVERALL COMPANY FOOTPRINT
- TABLE 149 FOOD EMULSIFIERS MARKET: DETAILED LIST OF KEY STARTUPS/SMES
- TABLE 150 FOOD EMULSIFIERS MARKET: COMPETITIVE BENCHMARKING OF KEY STARTUPS/SMES
- TABLE 151 PRODUCT LAUNCHES, 2020-2022
- TABLE 152 DEALS, 2019–2023
- TABLE 153 OTHERS, 2020–2022
- TABLE 154 ADM: BUSINESS OVERVIEW
- TABLE 155 CARGILL, INCORPORATED: BUSINESS OVERVIEW
- TABLE 156 INTERNATIONAL FLAVORS & FRAGRANCES INC.: BUSINESS OVERVIEW
- TABLE 157 INTERNATIONAL FLAVORS & FRAGRANCES INC.: DEALS
- TABLE 158 INTERNATIONAL FLAVORS & FRAGRANCES INC.: OTHERS
- TABLE 159 INGREDION: BUSINESS OVERVIEW
- TABLE 160 INGREDION: PRODUCT LAUNCHES
- TABLE 161 INGREDION: DEALS
- TABLE 162 KERRY GROUP PLC: BUSINESS OVERVIEW
- TABLE 163 KERRY GROUP PLC: PRODUCT LAUNCHES
- TABLE 164 KERRY GROUP PLC: DEALS
- TABLE 165 KERRY GROUP PLC: OTHERS
- TABLE 166 CORBION: BUSINESS OVERVIEW
- TABLE 167 CORBION: DEALS
- TABLE 168 PALSGAARD: BUSINESS OVERVIEW
- TABLE 169 PALSGAARD: DEALS
- TABLE 170 PALSGAARD: OTHERS
- TABLE 171 RIKEN VITAMIN CO., LTD.: BUSINESS OVERVIEW
- TABLE 172 TATE & LYLE: BUSINESS OVERVIEW
- TABLE 173 TATE & LYLE: DEALS
- TABLE 174 FOODCHEM INTERNATIONAL CORPORATION: BUSINESS OVERVIEW
- TABLE 175 ABF INGREDIENTS: BUSINESS OVERVIEW
- TABLE 176 FINE ORGANICS: BUSINESS OVERVIEW
- TABLE 177 BASF SE: BUSINESS OVERVIEW
- TABLE 178 STEPAN COMPANY: BUSINESS OVERVIEW
- TABLE 179 STEPAN COMPANY: DEALS
- TABLE 180 AMERICAN LECITHIN COMPANY: BUSINESS OVERVIEW
- TABLE 181 GSI: BUSINESS OVERVIEW
- TABLE 182 LASENOR EMUL, S.L.: BUSINESS OVERVIEW
- TABLE 183 LASENOR EMUL, S.L.: PRODUCT LAUNCHES
- TABLE 184 LASENOR EMUL, S.L.: OTHERS
- TABLE 185 BARENTZ: BUSINESS OVERVIEW
- TABLE 186 BARENTZ: DEALS
- TABLE 187 BARENTZ: OTHERS
- TABLE 188 MITSUBISHI CHEMICAL CORPORATION: BUSINESS OVERVIEW
- TABLE 189 MITSUBISHI CHEMICAL CORPORATION: OTHERS
- TABLE 190 PURATOS: BUSINESS OVERVIEW
- TABLE 191 PURATOS: DEALS
- TABLE 192 PURATOS: OTHERS
- TABLE 193 SISTERNA: BUSINESS OVERVIEW
- TABLE 194 ESTELLE CHEMICALS PVT. LTD.: BUSINESS OVERVIEW
- TABLE 195 LECICO GMBH: BUSINESS OVERVIEW
- TABLE 196 JEEVIKA YUGCHEM PRIVATE LTD.: BUSINESS OVERVIEW
- TABLE 197 SAVANNAH SURFACTANTS LTD.: BUSINESS OVERVIEW
- TABLE 198 SUCROSE ESTERS MARKET, BY APPLICATION, 2017–2025 (USD MILLION)
- TABLE 199 BAKERY PREMIXES MARKET, BY APPLICATION, 2017–2025 (USD THOUSAND)
- FIGURE 1 MARKET SEGMENTATION
- FIGURE 2 FOOD EMULSIFIERS MARKET: RESEARCH DESIGN
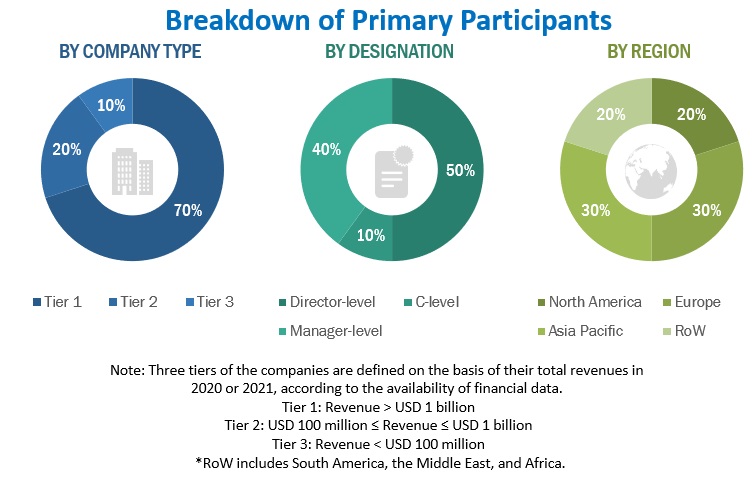
- FIGURE 3 BREAKDOWN OF PRIMARY INTERVIEWS: BY COMPANY TYPE, DESIGNATION, AND REGION
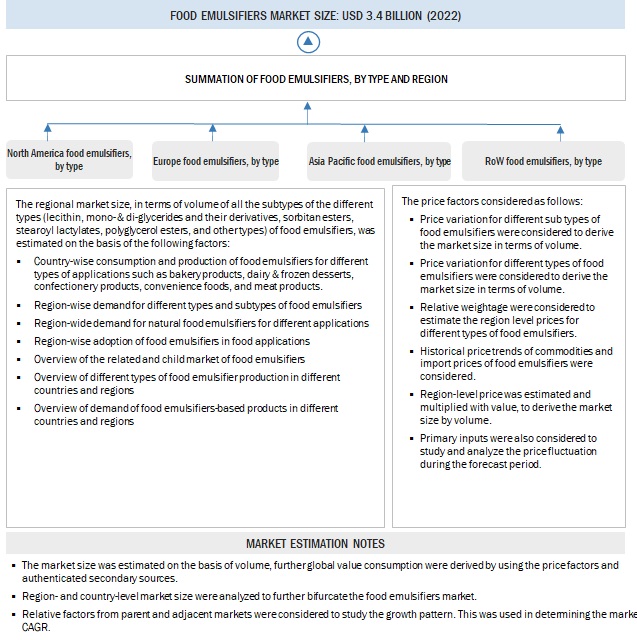
- FIGURE 4 MARKET SIZE ESTIMATION METHODOLOGY: BOTTOM-UP APPROACH
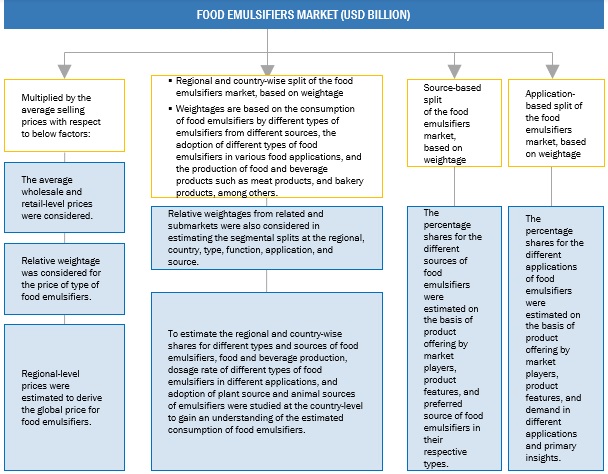
- FIGURE 5 MARKET SIZE ESTIMATION METHODOLOGY: TOP-DOWN APPROACH
- FIGURE 6 DATA TRIANGULATION
- FIGURE 7 FOOD EMULSIFIERS MARKET, BY TYPE, 2023 VS. 2028 (USD MILLION)
- FIGURE 8 FOOD EMULSIFIERS MARKET, BY SOURCE, 2023 VS. 2028 (USD MILLION)
- FIGURE 9 FOOD EMULSIFIERS MARKET, BY APPLICATION, 2023 VS. 2028 (USD MILLION)
- FIGURE 10 FOOD EMULSIFIERS MARKET SHARE (VALUE), BY REGION, 2022
- FIGURE 11 ASIA PACIFIC TO ACCOUNT FOR HIGHEST GROWTH RATE DURING FORECAST PERIOD
- FIGURE 12 GERMANY AND PLANT SOURCE ACCOUNTED FOR LARGEST RESPECTIVE SHARES IN 2022
- FIGURE 13 MONO-& DI-GLYCERIDES AND THEIR DERIVATIVES TO DOMINATE MARKET DURING FORECAST PERIOD
- FIGURE 14 MONO-& DI-GLYCERIDES AND THEIR DERIVATIVES TO DOMINATE GLOBAL MARKET DURING FORECAST PERIOD
- FIGURE 15 NORTH AMERICA TO DOMINATE CONFECTIONERY PRODUCTS AND OTHER APPLICATIONS SEGMENT DURING FORECAST PERIOD
- FIGURE 16 FOOD EMULSIFIERS MARKET DYNAMICS
- FIGURE 17 VALUE CHAIN ANALYSIS OF FOOD EMULSIFIERS MARKET: MANUFACTURING AND QUALITY & SAFETY CONTROLLERS TO BE KEY CONTRIBUTORS
- FIGURE 18 FOOD EMULSIFIERS MARKET: SUPPLY CHAIN
- FIGURE 19 FOOD EMULSIFIERS MARKET MAP
- FIGURE 20 FOOD EMULSIFIERS MARKET: TRENDS IMPACTING BUYERS
- FIGURE 21 FOOD EMULSIFIERS: NUMBER OF PATENTS GRANTED BETWEEN 2012 AND 2021
- FIGURE 22 FOOD EMULSIFIERS: TOP 10 INVENTORS WITH HIGHEST NUMBER OF PATENT DOCUMENTS
- FIGURE 23 FOOD EMULSIFIERS: TOP 10 APPLICANTS WITH HIGHEST NUMBER OF PATENT DOCUMENTS
- FIGURE 24 FOOD EMULSIFIERS MARKET, BY APPLICATION, 2023 VS. 2028 (USD MILLION)
- FIGURE 25 FOOD EMULSIFIERS MARKET, BY SOURCE, 2023 VS. 2028 (USD MILLION)
- FIGURE 26 FOOD EMULSIFIERS MARKET, BY TYPE, 2023 VS. 2028 (USD MILLION)
- FIGURE 27 GEOGRAPHIC SNAPSHOT: RAPIDLY GROWING MARKETS ARE EMERGING AS NEW HOTSPOTS, 2022
- FIGURE 28 INDICATORS OF RECESSION
- FIGURE 29 WORLD INFLATION RATE: 2011-2021
- FIGURE 30 GLOBAL GDP: 2011-2021 (USD TRILLION)
- FIGURE 31 RECESSION INDICATORS AND THEIR IMPACT ON FOOD EMULSIFIERS MARKET
- FIGURE 32 GLOBAL FOOD EMULSIFIERS MARKET: EARLIER FORECAST VS RECESSION FORECAST
- FIGURE 33 US DOMINATED NORTH AMERICAN FOOD EMULSIFIERS MARKET
- FIGURE 34 NORTH AMERICA: RECESSION IMPACT ANALYSIS
- FIGURE 35 EUROPE: FOOD EMULSIFIERS MARKET: RECESSION IMPACT ANALYSIS
- FIGURE 36 ASIA PACIFIC: FOOD EMULSIFIERS MARKET SNAPSHOT
- FIGURE 37 ASIA PACIFIC FOOD EMULSIFIERS MARKET: RECESSION IMPACT ANALYSIS
- FIGURE 38 ROW FOOD EMULSIFIERS MARKET: RECESSION IMPACT ANALYSIS
- FIGURE 39 SEGMENTAL REVENUE ANALYSIS OF KEY PLAYERS IN MARKET, 2017–2021 (USD MILLION)
- FIGURE 40 FOOD EMULSIFIERS MARKET: COMPANY EVALUATION QUADRANT, 2022 (KEY PLAYERS)
- FIGURE 41 FOOD EMULSIFIERS MARKET: COMPANY EVALUATION QUADRANT, 2022 (OTHER PLAYERS)
- FIGURE 42 ADM: COMPANY SNAPSHOT
- FIGURE 43 CARGILL, INCORPORATED: COMPANY SNAPSHOT
- FIGURE 44 INTERNATIONAL FLAVORS & FRAGRANCES INC.: COMPANY SNAPSHOT
- FIGURE 45 INGREDION: COMPANY SNAPSHOT
- FIGURE 46 KERRY GROUP PLC: COMPANY SNAPSHOT
- FIGURE 47 CORBION: COMPANY SNAPSHOT
- FIGURE 48 RIKEN VITAMIN CO., LTD.: COMPANY SNAPSHOT
- FIGURE 49 TATE & LYLE: COMPANY SNAPSHOT
- FIGURE 50 ABF INGREDIENTS: COMPANY SNAPSHOT
- FIGURE 51 FINE ORGANICS: COMPANY SNAPSHOT
- FIGURE 52 BASF SE: COMPANY SNAPSHOT
- FIGURE 53 STEPAN COMPANY: COMPANY SNAPSHOT
- FIGURE 54 MITSUBISHI CHEMICAL CORPORATION: COMPANY SNAPSHOT
The study involved four major activities in estimating the current size of the food emulsifiers market. Exhaustive secondary research was done to collect information on the market, peer market, and parent market. The next step was to validate these findings, assumptions, and sizing with industry experts across the value chain through primary research. Both top-down and bottom-up approaches were employed to estimate the complete market size. After that, market breakdown and data triangulation were used to estimate the market size of segments and subsegments.
Secondary Research
Secondary sources referred to for this research study include financial statements of companies offering food emulsifiers and information from various trade, business, and professional associations. The secondary data was collected and analyzed to arrive at the overall size of the food emulsifiers market, which was validated by the primary respondent.
Primary Research
In the primary research process, various sources from the supply and demand sides were interviewed to obtain qualitative and quantitative information. The primary sources from the supply side included industry experts such as CEOs, vice presidents, marketing directors, technology and innovation directors, and related key executives from various key companies and organizations operating in the food emulsifiers market.
To know about the assumptions considered for the study, download the pdf brochure
Food Emulsifiers Market Size Estimation
- Both the top-down and bottom-up approaches were used to estimate and validate the total size of the food emulsifiers market. These methods were also used extensively to estimate the size of the various subsegments in the market. The research methodology used to estimate the market size includes the following:
- The key players in the industry and market have been identified through extensive secondary research.
- The revenues of major food emulsifier manufacturers were determined through primary and secondary research, such as paid databases, which were used as the basis for market estimation.
- All macroeconomic and microeconomic factors affecting the growth of the food emulsifiers market were considered while estimating the market size.
- All possible parameters that affect the market covered in this research study were accounted for, viewed in extensive detail, verified through primary research, and analyzed to obtain final quantitative and qualitative data.
Market Size Estimation Methodology: Bottom-up Approach
Market Size Estimation Methodology: Top-Down Approach
Data Triangulation
After arriving at the overall market size from the estimation process explained above, the total market was split into several segments and subsegments. To complete the overall market engineering process and arrive at the exact statistics for all segments and subsegments, data triangulation and market breakdown procedures were employed wherever applicable. The data was triangulated by studying various factors and trends from the demand and supply sides. Along with this, the market size was validated using the top-down and bottom-up approaches.
Market Definition
- The definition of a food emulsifier, according to EUROPA (Council of the European Union), is as follows:
- Emulsifiers are substances that make it possible to form or maintain a homogenous mixture of two or more immiscible phases such as oil and water in a foodstuff. Emulsifiers are molecules with amphiphilic properties-part of the structure of hydrophilic and another of lipophilic nature. Emulsifiers position themselves at the oil-water or air-water interface and stabilize the emulsion by reducing the surface tension.
Key Stakeholders
- Raw material suppliers
- Food safety agencies such as the Food and Drug Administration (FDA)
- European Food Safety Authority (EFSA)
- Food Standards Australia New Zealand (FSANZ)
- The Food Standards Agency – UK
- Saudi Food & Drug Administration (SFDA)
- Government agencies and NGOs
- Food safety agencies
- Food & beverage manufacturers/suppliers
- Retailers
- Importers and exporters of end-use products
- Traders, distributors, and suppliers of food emulsifiers
- Government and research organizations
- Commercial research & development (R&D) institutions and financial institutions
- Trade associations and industry bodies
Report Objectives
- To determine and project the size of the food emulsifier market with respect to type, source, application, function, and region.
- To identify the attractive opportunities in the market by determining the largest and fastest-growing segments across regions.
- To provide detailed information about the key factors influencing the market growth (drivers, restraints, opportunities, and industry-specific challenges)
- To provide the regulatory framework for major countries related to the food emulsifiers market.
- To analyze the micro-markets with respect to individual growth trends, prospects, and their contribution to the total market
Available Customizations:
With the given market data, MarketsandMarkets offers customizations according to company-specific scientific needs.
The following customization options are available for the report:
Product Analysis
- Product Matrix, which gives a detailed comparison of the product portfolio of each company
Geographic Analysis
With the given market data, MarketsandMarkets offers customizations according to company-specific scientific needs.
- Further breakdown of the Rest of Europe region for food emulsifiers market into Russia, Belgium, and the Netherlands, and other EU and non-EU countries.
- Further breakdown of the Asia Pacific region for food emulsifiers market into Indonesia, Thailand, the Philippines, Vietnam, Singapore, and Malaysia.
- Further breakdown of other countries in the RoW market for food emulsifiers market into South America, Middle East and Africa.
Company Information
- Detailed analyses and profiling of additional market players (up to five)


 Generating Response ...


Growth opportunities and latent adjacency in Food Emulsifiers Market
Hello, I am looking for key players benchmarking in the food emulsifiers market, specifically in Europe. Is this information available?